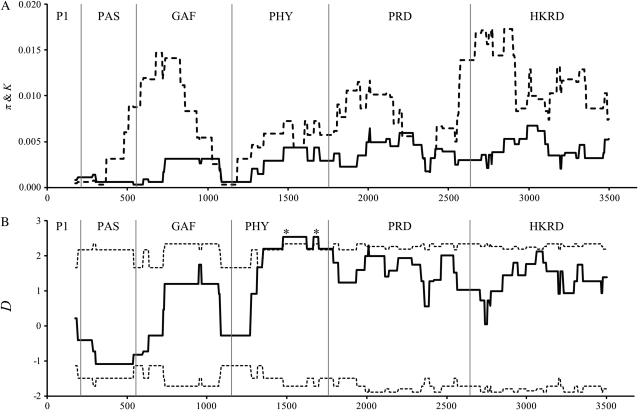
Figure 3.—
Sliding-window plots of (A) nucleotide diversity within C. nipponica (π) and genetic divergence between C. nipponica and C. resedifolia (K) and (B) Tajima's D in PHYE. A 350-bp-wide window was moved along the sequence in 5-bp increments, and statistics were calculated for each window segment. The locations of functional domains are indicated within the plot. (A) Solid and dashed lines represent nucleotide diversity (π) and genetic divergence (K), respectively. (B) Solid and dashed lines represent the estimated values (D) and 97.5% confidence interval, respectively, obtained through 10,000 coalescent simulations. Asterisks (*) indicate the significant deviations of D.

