


Abstract
The convergently transcribed restriction (R) and methylase (M) genes of the Restriction–Modification system Esp1396I are tightly regulated by a controller (C) protein that forms part of the CR operon. We have mapped the transcriptional start sites from each promoter and examined the regulatory role of C.Esp1396I in vivo and in vitro. C-protein binding at the CR and M promoters was analyzed by DNA footprinting and a range of biophysical techniques. The distal and proximal C-protein binding sites at the CR promoter are responsible for activation and repression, respectively. In contrast, a C-protein dimer binds to a single site at the M-promoter to repress the gene, with an affinity much greater than for the CR promoter. Thus, during establishment of the system in a naïve host, the activity of the M promoter is turned off early, preventing excessive synthesis of methylase. Mutational analysis of promoter binding sites reveals that the tetranucleotide inverted repeats long believed to be important for C-protein binding to DNA are less significant than previously thought. Instead, symmetry-related elements outside of these repeats appear to be critical for the interaction and are discussed in terms of the recent crystal structure of C.Esp139I bound to the CR promoter.
INTRODUCTION
Restriction–modification (R–M) systems encode a restriction endonuclease and a DNA methyltransferase (methylase). The methylase protects the bacterial host DNA from cleavage by the associated endonuclease by methylation of the cognate DNA recognition sequence. Bacterial cells carrying R–M genes become resistant to infection by bacteriophages with unmethylated (unmodified) DNA and thus gain a selective advantage over bacteria of the same species but lacking R–M genes. Thus, R–M genes frequently spread through horizontal transfer on broad host range plasmids (1,2). R–M systems can also be considered as ‘addictive’ modules that are impossible to eliminate because the protective methylase is less stable than the toxic restriction endonuclease (2,3). Plasmids containing R–M systems can be readily transformed into cells containing unmodified DNA, suggesting that sufficient amounts of methylase are produced to completely methylate host DNA before the endonuclease activity appears. Thus, R–M systems must have evolved mechanisms of coordinate expression of their genes to minimize potentially fatal consequences to the host bacterium.
Many type II R–M systems rely on specialized Controller (C) proteins for coordinated expression of their genes (4–10). All C-proteins are related through common ancestry and contain a DNA binding helix–turn–helix motif (11). The structures of two C-proteins that have been studied by crystallography revealed that these proteins form dimers and that each monomer is similar to the DNA-binding domain of the λ repressor (12,13), although there are important differences at the dimer interface that determine the strength of dimerization, which is crucial to the timing of the genetic switch (14,15).
Genes coding for C-proteins are almost invariably located upstream of, and partially overlap with the endonuclease gene (7–9), forming a single operon. Two C-protein binding sites are located upstream of and partially overlapping with the CR operon promoter (16). When a C-protein dimer binds to the high-affinity promoter–distal site, transcription is activated leading to increased C-protein and endonuclease gene expression. Binding to the weaker promoter–proximal site inhibits transcription (7,14,17). C-proteins were also shown to inhibit expression of methylases in some R–M systems (8,18).
The regulation of R–M gene expression depends on the relative positions of genes in the system. In C-protein-dependent R–M systems with divergent organization of CR and M genes, such as the EcoRV system, interaction of the C-protein with the high-affinity distal (with respect to CR promoter) site decreases transcription from the M promoter due to direct interference from the bound C-protein (7). In the C-protein-dependent R–M system AhdI, the M and the CR operons are transcribed convergently (14,17). The ahdI CR operon expression is regulated by C-protein in a manner generally analogous to that observed in the case of EcoRV CR operon regulation. However, M gene expression is C-protein-independent and is instead regulated by the Ahd I methylase, which methylates an AhdI site embedded in the −10 element of the M promoter leading to decreased transcription (17).
The object of this study, C-protein-dependent R–M system Esp1396I, contains convergent M and CR genes but with no Esp1396I restriction sites in front of the M gene. Nevertheless, in vivo analysis revealed that esp1396IM expression is inhibited by C.Esp1396I (8). Sequence analysis suggested the presence of tetranucleotide inverted repeats in front of the esp1396ICR operon (two sets of repeats) and the esp1396IM gene (one set of perfect repeats and another putative set that contained several substitutions) (9). The repeats matched well with C-protein binding sites from several other C-protein-dependent R–M systems and very recently the esp1396ICR operon repeats were shown to indeed interact with C.Esp1396I (19). However, the overall role of C.Esp1396I binding sites locations in differential regulation of the esp1396ICR operon and esp1396IM gene expression has not yet been investigated. Moreover, the result of the structural analysis suggests that elements of the binding site distinct from tetranucleotide repeat per se contribute significantly to C.Esp1396I binding. These elements, such as a conserved TATA spacer between the repeats and inverted dinucleotides flanking the site upstream of the esp1396ICR operon, are missing in one of the putative binding sites upstream of esp1396IM, raising a question about its significance. Here, we determine transcription initiation start points of both esp1396I transcription units, show that there is only one C-protein binding site in front of esp1396IM, analyze C.Esp1396I interactions with DNA operator sequences, discuss the regulatory consequences of these interactions in vivo and in vitro, and derive a plausible scenario of transcription regulation of the esp1396I genes. In addition, we test the importance of the elements of protein–DNA recognition indicated by the crystal structure of the complex (19).
MATERIALS AND METHODS
Bacteria strains, phages and media
Escherichia coli HB101 and XL1-Blue were used as host strains in experiments to study the esp1396I genes expression and λvir phage resistance. Phage λvir was propagated as described (20). Cells were grown in LB medium (1% bactotryptone, 1% NaCl, 0.5% yeast extract, with or without 1.5% bactoagar) supplemented with appropriate antibiotics. To test for esp1396I genes expression in vivo, McConkey agar base plates containing 1% galactose were used.
Plasmids and proteins
Plasmid pEsp1396IRM5.6 (8) carrying the entire Esp1396I R–M system was used as a template for PCR amplification of DNA fragments used for cloning, mutagenesis and in vitro transcription. Plasmids pEspMet and pEspRes are derivatives of the pFD51 plasmid (21) with the galactokinase gene (galK) under the control of the esp1396IM and esp1396ICR promoters, respectively. Plasmid pEspMet contains a 101-bp PCR-amplified esp1396IM fragment (−74 to +27 with respect to the transcription start point at +1); pEspRes contains a 103-bp esp1396IR fragment (−70 to +33 with respect to the transcription start). Plasmid pCesp184 was created by cloning a 347-bp PCR fragment containing the esp1396IC gene and the esp1396ICR promoter between the NcoI and EcoRI sites of plasmid pACYC184.
Hexahistidine-tagged C.Esp1396I (C.Esp1396I-6His) and C.Esp1396I without hexahistidine tag were purified as described (19). The protein concentration was determined using the Bradford method with BSA as a standard. For analytical ultracentrifugation experiments, UV absorption spectroscopy was used to measure the protein concentration, taking the theoretical extinction coefficient ε276 = 2900 M−1 cm−1. Throughout the text, molar concentration of C.Esp1396I refers to monomer concentration.
Escherichia coli RNAP σ70 holoenzyme was purified as described (22).
Primer extension reactions
HB101 cells harboring the pEspMet and pEspRes plasmids with or without compatible pCesp184 plasmid were grown to OD600 = 0.4 and total RNA was extracted using RNeasy Mini Kit (Qiagen) according to the manufacturer's protocol with the inclusion of the DNaseI digestion step. For a single extension reaction, 10 μg of total RNA were reverse-transcribed with 100 U of SuperScript III enzyme of First-Strand Synthesis Kit for RT–PCR (Invitrogen) according to the manufacturer's protocol in the presence of 1 pmol of [32P] 5′-end-labeled primers. The reaction products were treated with RNase H, precipitated by ethanol and dissolved in a loading buffer containing 7 M urea–formamide and resolved on 6% sequencing gels. Sequencing reactions performed with the same end-labeled primers and pEspMet and pEspRes as a templates using fmol DNA Cycle Sequencing System (Promega).
Electrophoretic mobility shift assay
A 10 nM [32P]-end-labeled DNA fragments containing the wild-type or mutant C-protein-binding sites were incubated for 10 min at 37°C in 10 µl reaction buffer [40 mM Tris–HCl (pH 8.0) 10 mM NaCl, 10 mM MgCl2, 1 mM DTT, 5% glycerol] with 0–1024 nM of C.Esp1396I-6His in the presence of 5 µg/ml of competitor DNA. Following the addition of 2 µl of loading buffer (30% glycerol, 0.05% bromophenol blue, 10 mM EDTA), samples were loaded onto 8% native polyacrylamide gels. After electrophoresis, reaction products were visualized and quantified using a PhosphorImager.
Footprinting and in vitro transcription
For in vitro transcription, promoter complexes were allowed to form for 10 min at 37°C in 10 µl reactions containing 40 mM Tris–HCl (pH 8.0) 40 mM KCl, 10 mM MgCl2, 1 mM DTT, 5% glycerol, 100 nM E. coli RNAP σ70 holoenzyme and 10 nM esp1396I DNA fragments. Where indicated, DNA was incubated with C.Esp1396I-6His prior to the addition of RNAP. To initiate transcription reaction, a mixture of 200 μM ATP, CTP and UTP, 20 μM GTP and 10 μCi of [α-32P]GTP (3000 Ci/mmol) and heparin (final concentration 30 μg/ml) was added to promoter complexes. After incubation at 37°C for 15 min, reactions were terminated by the addition of equal volume of 7 M urea–formamide-containing loading buffer and resolved on 8% sequencing gels.
KMnO4 probing and DNase I footprinting were conducted under conditions used for in vitro transcription using P32-labeled promoter fragments as described (17). G+A sequencing reactions were carried out as described (23). Samples were applied on 6% sequencing gels and reaction products revealed using a PhosphorImager.
Sedimentation velocity and sedimentation equilibrium experiments
Sedimentation velocity experiments were performed in a Beckman XL-A analytical ultracentrifuge equipped with an An50-Ti rotor using double sector cells of 12 mm optical path-length. Sample cells contained 400 μl of C.Esp1396I at 0, 10 and 20 μM and Hex-labeled 35-bp DNA fragments containing the binding sites (5 μM). The reference cells contained 425 μl of buffer (40 mM Tris–HCl pH 8.0, 100 mM NaCl and 5% glycerol). The cells were loaded and left to equilibrate to 20°C. The rotor was accelerated to 40 000 r.p.m. and readings of absorbance versus radial distance were taken every 12 min at 540 nm. The raw data were analyzed with program Sedfit (24), using radial data within the range 6.07–6.93 cm for the first 75 scans. Partial specific volumes for the dimer and tetramer (0.644 and 0.678 ml/g, respectively) were calculated using the program Sednterp and corrected for temperature (25). For DNA alone, a value of 0.55 ml/g was used corresponding to tabulated values (26); for dimer and tetramer nucleoprotein complexes, weight average values were calculated. Finally, the experimental sedimentation coefficients obtained from the c(S) distribution plot were corrected for temperature and solvent to obtain a s20,w value.
Sedimentation equilibrium experiments were performed using the same centrifuge and rotor as for the velocity experiments. Six-channel cells of 12 mm optical path-length containing 90 µl of solution at protein concentrations ranging from 5 to 64 µM were used; 100 µl of the sample buffer (40 mM Tris–HCl, pH 8.0, 100 mM NaCl, 5% glycerol) was loaded into the corresponding channel. The rotor was accelerated to 15 000, 21 000 and 28 000 r.p.m. and scans of absorbance (275 and 235 nm) versus radial displacement were taken at a resolution of 0.001 cm for times up to 21 h. The temperature was set at 20°C.
Fluorescence polarization assays
HPLC-purified fluorescein-labeled oligonucleotides and their complementary partners were obtained from ITD (Corralville, IA, USA). The 20 μl reaction mixtures (in 40 mM Tris–HCl, pH 8.0, 10 mM MgCl2, 5% glycerol and 50 μg/ml calf thymus DNA) containing 10 nM fluorescein-labeled DNA and indicated C.Esp1396I protein concentration were prepared in triplicates and fluorescence polarization was read in 384-well microplates using Analyst AD reader (Molecular Devices, Sunnyvale, CA, USA).
Fluorescence polarization data were analyzed using numerical nonlinear regression with SCIENTIST (MicroMath, Salt Lake City, UT, USA). Equilibrium titrations of Pesp1396IM DNA with C.Esp1396I were fitted to:
where, pol is observed fluorescence polarization, pol1 and pol2 are specific fluorescence polarizations of free DNA and DNA in complex with the C.Esp1396I protein dimer (P), respectively. Binding of C.Esp1396I to the Pesp1396IM DNA is described by two equilibrium constants: protein dimerization constant (Kdim; it was fixed at 600 nM during fitting, the value measured by analytical centrifugation) and dissociation constant of protein dimer–DNA complex (K). Equilibrium titrations of Pesp1396ICR DNA with the protein were fitted to:
where, pol is observed fluorescence polarization, pol1, pol2 and pol3 are specific fluorescence polarizations of free DNA, DNA in complex with one C.Esp1396I dimer, and DNA in complex with two C.Esp1396I dimers, respectively. P:DNAp and P:DNAd refer to of C.Esp1396I dimers bound to the proximal and distal site, respectively. Binding of C.Esp1396I to the Pesp1396ICR DNA is described by four parameters: protein dimerization constant (Kdim; fixed at 600 nM during fitting, the value measured by analytical centrifugation), dissociation constants of C.Esp1396I dimer complexes with proximal and distal sites (Kp and Kd, respectively) and a cooperatively constant describing the effect of C.Esp1396I binding to one site on the affinity of the protein to the other site (calculated as the ratio of equilibrium constants for a given site when the other site is bound and free, respectively). During the fit, concentrations of all species were calculated numerically for each point by solving the appropriate set of mass conservation equations defined by a particular model (27). The data for the wild-type and all of the mutant DNA fragments were fitted simultaneously to force common parameters between data sets to be the same.
RESULTS
Mapping transcription start sites in Esp1396I
The genetic organization of Esp1396I is shown in Figure 1. The esp1396IC and esp1396IR genes partially overlap and likely form an operon. The esp1396IM gene is transcribed convergently with respect to the esp1396ICR gene pair. A putative bidirectional transcription terminators is located in the intergenic region separating the esp1396ICR genes and the esp1396IM gene.
Figure 1.

Genetic organization of restriction–modification system Esp1396I. The esp1396I genes with upstream C.Esp1396I binding sites are schematically shown on the top. Arrows show the direction of transcription. Two esp1396I transcription units (M and CR) are separated by a region that may contain a bidirectional transcription terminator (depicted as a hairpin). DNA sequences around transcription start points of the esp1396IM and esp1396ICR promoters are expanded below (both DNA strands are shown). Beginnings of coding regions are indicated with colors that match those at the top of the figure and esp1396IC and esp1396IM are highlighted in bold typeface and indicated as ‘Met1’. The Pesp1396IM and Pesp1396ICR start sites are indicated by red color and bold typeface, and leftward and rightward arrows below and above the sequence. Conserved promoter elements are labeled and underlined. The esp1396ICR C-box is indicated by blue color and a black line above the sequence with distal and proximal C.Esp1396I binding sites labeled. Two sets of inverted repeats are shown by convergent arrows. Sequences constituting the recently discovered ‘TATA’-based dyad are boxed. Sequences within one set of perfect inverted repeats in Pesp1396IM are similarly indicated and highlighted with orange-colored font. An imperfect set of repeats in Pesp1396IM identified in ref. (8) is shown by inverted arrows above black-colored font. At the top of the figure, the orientation of C.Esp1396I dimers at promoter-distal (subunits A, B) and promoter-proximal (subunits C, D) Pesp1396ICR binding sites is shown (19).
To better understand the regulation of Esp1396I, we identified transcription start points of Esp1396I genes by performing primer extension reactions with total RNA prepared from E. coli cells harboring a plasmid containing complete Esp1396I R–M system (8). This plasmid is stably maintained in E. coli and cells harboring this plasmid restrict the growth of phage λ (Figure 2A, left panel) indicating that both Esp1396I methyltransferase and restriction endonuclease are expressed. We wished to use RNA from cells harboring an Esp1396I R–M plasmid containing a lesion in the esp1396IC gene to reveal C.Esp1396I-dependent transcription start sites. However, no such plasmid could be constructed, indicating that intact esp1396IC is necessary for establishment and/or maintenance of esp1396I genes in the cell. Similar observations were made previously and were explained by postulating that expression of the esp1396IM gene in the absence of C.Esp1396I is toxic to the cell (8). Extension of primers annealing to various places within the esp1396ICR genes revealed a single primer extension product (Figure 2A, center panel and data not shown), supporting the notion that the esp1396ICR gene pair is transcribed from a single promoter (8). The primer extension product mapped to an adenine located 27-bp upstream of the initiating ATG codon of esp1396IC. Thus, unlike several other studied CR transcripts that were shown to be leaderless (7,17,28), the esp1396ICR transcript is translated in a conventional way (indeed, there is a recognizable Shine–Dalgarno sequence at an appropriate distance from the initiating ATG codon of esp1396I.C, Figure 1). The esp1396ICR transcription start site is preceded by a CATTAT sequence that is appropriately positioned to serve as a −10 promoter element (consensus sequence TATAAT). The place where the −35 promoter element (consensus sequence TTGACA) should be located contains a GTGTGA sequence. Thus, the similarity of the esp1396ICR promoter (Pesp1396ICR) elements to consensus elements is low, suggesting that basal activity level of this promoter is also low. Primer extension reactions with a primer designed to reveal transcription from the Esp1396I methylase promoter (Pesp1396IM) revealed a single product whose 5′-end corresponded to a thymidine located 20-bp upstream of the initiating ATG of esp1396IM (Figure 2A, right panel). This residue is preceded by an appropriately positioned TAGAAT sequence that is highly similar to the consensus −10 promoter element sequence TATAAT; at an appropriate distance upstream, a TTGAAA sequence that is similar to the −35 promoter consensus element sequence TTGACA is located (Figure 1).
Figure 2.

Expression of the esp1396I genes in vivo. (A) The horizontal lines on the left panel show overnight 37°C growth of E. coli cells harboring a plasmid containing the entire Esp1396I system of without such a plasmid on an LB agar plate. Cells were spotted with indicated dilutions of λ-vir phage lysate. Two panels on the right show the results of primer extension analysis carried out with RNA purified from cells harboring a plasmid containing the entire Esp1396I system with a primer specific for esp1396ICR transcription unit (middle panel) or with a esp1396IM-specific primer (right panel). Primer extension products are indicated by arrows. (B and C) Top panels shows the results of overnight 37°C growth of E. coli cells harboring esp1396ICR (B) or esp1396IM (C) promoters fused to promotorless galK in the absence (1) or presence (2) or a compatible plasmid expressing C.Esp1396I on McConkey agar plates. Bottom panels show the results of primer extension analysis of RNA purified from cells shown at the top with a galK specific primer.
To show C.Esp1396I-dependence of esp1396I promoters, fragments containing Pesp1396ICR or Pesp1396IM with corresponding flanking sequences were cloned in front of promoterless galK gene of the pFD51 plasmid. Cells containing the resultant Pesp1396ICR::galK fusion plasmid pEspRes formed white colonies on McConkey agar (Figure 2B, top, plate sector 1) and no primer extension product corresponding to Pesp1396ICR transcript could be detected (Figure 2B, bottom, lane 1). However, cells harboring pEspRes and a compatible plasmid producing C.Esp1396I formed colonies of deep red color (Figure 2B, top, plate sector 2) and robust primer extension product corresponding to Pesp1396ICR transcript was detected (Figure 2B, bottom, lane 2). Thus, C.Esp1396I is required for Pesp1396ICR activity. Cells carrying Pesp1396IM::galK fusion plasmid formed purple colonies on McConkey plates (Figure 2C, top, plate sector 1) and robust primer extension product corresponding to a transcript initiated from the Pesp1396IM start site as well as two positions immediately upstream and downstream of this point were observed (Figure 2C, bottom, lane 1). In contrast, cells harboring pEspMet and a compatible plasmid producing C.Esp1396I formed white colonies (Figure 2C, top, plate sector 2) and no primer extension product corresponding to Pesp1396IM transcript could be detected (Figure 2C, bottom, lane 2). We therefore conclude that C.Esp1396I represses transcription from Pesp1396IM.
In vitro analysis of C.Esp1396I effects on transcription from Esp1396I promoters
To determine the effect of C.Esp1396I on the formation of transcription-competent open complexes on Pesp1396ICR, KMnO4 probing was performed. The addition of the RNAP σ70 holoenzyme alone did not lead to appearance of KMnO4-sensitive thymines in the −10 element of Pesp1396ICR (Figure 3A, lane 3). However, the addition of 8-fold excess (over DNA) of C.Esp1396I and RNAP led to the appearance of robust KMnO4-sensitivity of thymines in the −10 element of Pesp1396ICR and around the transcription start point (Figure 3A, lane 4). The results thus indicate that C.Esp1396I promotes open complex formation on Pesp1396ICR. In vitro transcription experiments revealed very little transcription from Pesp1396ICR in the absence of C.Esp1396I (Figure 3B, lane 1). The addition of increasing concentrations of C.Esp1396I strongly stimulated transcription initially, while further increase in the amount of C.Esp1396I led to gradual decrease in transcription (the latter effect was not strongly pronounced).
Figure 3.

In vitro transcription from esp1396I promoters. (A) Escherichia coli RNAP σ70 holoenzyme (100 nM) was combined with DNA fragments containing 8 nM Pesp1396ICR (A–C) or Pesp1396IM (D and E) in the presence, where indicated, of C.Esp1396I, whose concentrations ranged 0 to 500 nM. In (D), a component indicated by red color was added to DNA first, following an incubation long enough to allow complex formation and subsequent addition of component indicated by black color. In (A and D), complexes were probed with KMnO4. On the left of these panels, the sequence of the relevant portion of each promoter is mapped on the A+G sequencing marker lane. In (B and E), a single-round transcription reaction was performed. In (C), abortive initiation reaction was performed using RNAP holoenzymes reconstituted with indicated σ factors. Reaction products were separated by denaturing gel electrophoreses and revealed using a Phosphorimager.
Recently, a structure of C.Esp1396I bound to a binding site located upstream of Pesp1396ICR was determined in one of our laboratories (19). The structure revealed two C.Esp1396I dimers that interacted with each other through a contact between Glu25 of a dimer bound to the distal (with respect to Pesp1396ICR transcription start site) and Arg35 of the dimer bound to the proximal site. Based on molecular modeling, it has been proposed that the dimer bound to the distal site can activate transcription through a protein–protein interaction between Glu25 and Arg588 of the RNAP σ70 subunit (19). To test this hypothesis, we prepared recombinant σ70 subunit containing an alanine at position 588, and tested the ability of RNAP containing such subunit to transcribe from Pesp1396ICR in the presence or in the absence of C.Esp1396I. The results, presented in Figure 3C, demonstrate that RNAP holoenzyme containing mutant σ70 did not respond to C.Esp1396I, confirming the idea that Arg588 is required for transcription activation by C.Esp1396I.
KMnO4 probing showed robust open complex formation on Pesp1396IM in the presence of RNAP σ70 holoenzyme (Figure 3D, lane 3). The addition of increasing concentrations of C.Esp1396I to preformed Pesp1396IM open complexes caused only a slight decrease in KMnO4 sensitivity (Figure 3D, lanes 7–9), indicating that C.Esp1396I is relatively ineffective in dislodging Pesp1396IM open complexes. In contrast, bound C.Esp1396I effectively inhibited promoter complex formation in a concentration-dependent manner (Figure 3D, lanes 4–6). We therefore conclude that RNAP open complex formation and C.Esp1396I binding to Pesp1396IM are mutually exclusive. This conclusion is supported by the results of electrophoretic mobility shift (EMSA) experiments that revealed that RNAP is unable to bind to Pesp1396IM DNA in the presence of bound C.Esp1396I (data not shown). Transcription assays also showed that C.Esp1396I abolished transcription from Pesp1396IM when added before (Figure 3E), but not after (data not shown) RNAP.
In vitro analysis of C.Esp1396I interaction with its binding sites
Sedimentation equilibrium analytical ultracentrifugation (AUC) experiments were carried out to confirm the dimeric status of C.Esp1396I and to obtain the Kd for dimerisation (Supplementary Figure 1). An Mr of 17 920 Da was obtained, which compares well with the theoretical Mr of an C.Esp1396I dimer (18 450 Da). Analysis of the data with a monomer–dimer equilibrium model gave a dimerization constant (Kd) of ∼0.6 μM, 4-fold lower than that observed for C.AhdI (14), indicating that the C.Esp1396I dimer is significantly more stable.
The nature of complexes formed at each esp1396I promoter was determined in sedimentation-velocity AUC experiments using hex-labeled 35-bp esp1396I DNA fragments containing C.Esp1396I binding sites (Figure 4). With the Pesp1396ICR fragment at a protein:DNA ratio of 4:1, a single species with sedimentation coefficient of 3.9 S predominated. Using the frictional ratio derived from the fit, a molecular weight of 60 kDa was obtained, corresponding to a tetrameric complex with two C.Esp1396I dimers bound to DNA (Supplementary Table 1). At a protein:DNA ratio of 2:1, both the free DNA (2.7 S) and the tetrameric complex (3.9 S) were observed but no C.Esp1396I dimer–DNA complexes were discernible, indicating the high cooperativity of binding to Pesp1396ICR. In the case of the Pesp1396IM fragment, which contained the two putative C.Esp1396I binding sites originally postulated (8), identical plots were observed for both 4:1 and 2:1 protein:DNA ratios, with a single species sedimenting at 3.3 S. The derived molecular weight (40 kDa) corresponds to one C.Esp1396I dimer bound to the DNA. Thus, only one of the two postulated C-protein binding sites is occupied at the methylase promoter, even in the presence of excess protein. Moreover, the higher affinity of C.Esp1396I for the Pesp1396IM site, compared to Pesp1396ICR sites, is evident since the former is fully bound at 2:1 protein/DNA ratio, whereas the latter remains only partially bound at a 4:1 ratio.
Figure 4.

Sedimentation velocity analysis of C.Esp1396I–DNA complexes. The c(S) distribution plots for the C.Esp1386I-DNA complexes with Pesp1396ICR (A) and Pesp1396IM (B) derived 35-bp DNA fragments are shown. Plots labeled blue, red and green, correspond to free DNA duplex, a 2:1 C.Esp1396I:DNA molar ratio, and a 4:1 C.Esp1396I:DNA molar ratio, respectively. In all cases, the final concentration of the hex-labeled DNA duplex was 5 μM.
DNase I footprinting of a Pesp1396ICR-containing DNA fragment revealed little protection in the presence of 4-fold molar excess of C.Esp1396I monomers over DNA (Figure 5A, lane 2). However, in the presence of 8-fold excess of C.Esp1396I, complete protection of both sets of inverted repeats as well as adjacent bases was observed (Figure 5A, lane 3), indicating formation of a tetrameric complex (19). The addition of C.Esp1396I to the Pesp1396IM fragment resulted in complete protection of the entire inverted repeat and partial protection extending 5–6 bp in both directions outside the repeat in the presence of both 4-fold and 8-fold molar excess of C.Esp1396I monomers over DNA (Figure 5B, lanes 2 and 3). The result thus confirms that C.Esp1396I binds Pesp1396IM as a dimer, in agreement with the AUC data, and identifies the location of the binding site at this promoter.
Figure 5.

Footprinting of C.Esp1396I complexes with esp1396I promoters. A 4-fold (lane 2) or 8-fold (lane 3) excess of C.Esp1396I was combined with Pesp1396ICR (A) or Pesp1396IM (B) end-labeled DNA fragments; complexes were allowed to form and were footprinted with DNase I. On the left of each panel, the sequences of each promoter are shown along with promoter elements (red) and symmetry-related features of C.Esp1396I binding sites. In (B), only imperfect tetranucleotide repeats from a predicted second set of inverted repeats (see Figure 1) are shown at the top of the figure.
To derive equilibrium binding constants of C.Esp1396I interactions with its binding sites, we performed solution-based fluorescence polarization assays. Fluorescence polarization does not involve steps that could potentially perturb the binding equilibria being measured (such as physical separation of free and bound species) and therefore allows true equilibrium determinations of macromolecular interactions (29,30). Promoter fragments were labeled at the 5′-end with fluorescein and fluorescence polarization of DNA fragments was measured as a function of C.Esp1396I concentration (Figure 6A). Equilibrium constants describing the binding of C.Esp1396I were obtained by nonlinear regression analysis and fitting the data to a model involving binding of a single dimer of C.Esp1396I to Pesp1396IM-containing fragment and cooperative binding of two C.Esp1396I dimers to Pesp1396ICR-containing fragment. While satisfactory fits of polarization data for both Pesp1396IM and Pesp1396ICR sites could be obtained using either of these models, only the specific models described above were considered since they were consistent with data described above. Also, the models were consistent with higher total fluorescence polarization changes observed with Pesp1396ICR DNA indicating larger complexes formed with this DNA (Figure 6A, compare panels on the left and on the right).
Figure 6.

Interaction of C. Esp1396I with esp1396I binding sites measured by fluorescence polarization. (A) DNA binding of C.Esp1396I analyzed by fluorescence polarization of fluorescein-labeled Pesp1396ICR (left) and Pesp1396IM (right) DNA fragments. Solid lines show best fits of the models to experimental data. The best fit parameters for Pesp1936ICR were Kp = 322 nM, Kd = 6.9 nM and cooperativity 219. The best fit equilibrium constant for Pesp1936IM DNA was K = 0.3 nM. (B) Left panel: binding of C.Esp1396I to labeled Pesp1396ICR DNA in the absence (gray symbols) and presence (black symbols) of unlabeled Pesp1396IM DNA. Right panel: binding of C.Esp1396I to labeled Pesp1396IM DNA in the absence (gray symbols) and presence (black symbols) of unlabeled Pesp1396ICR DNA. Both labeled and competing unlabeled DNA (when present) were at 50 nM. Dashed lines depict predicted simulated binding using equilibrium constants derived from the analysis of the data illustrated in (A).
Quantitative analysis was performed assuming that C.Esp1396I exhibits monomer–dimer equilibrium with a dissociation constant of 600 nM (as determined by AUC, above). With these assumptions, the affinity of C.Esp1396I for the single Pesp1396IM binding site (Kd = 0.3 nM) was much higher then the affinity for either of the Pesp1396ICR binding sites (Kd's of 6.9 and 322 nM for the distal and proximal sites, respectively). The significantly weaker binding of C.Esp1396I to the proximal site (OR) compared to the distal site (OL) is in agreement with the results of EMSA experiments (19).
The weaker binding of C.Esp1396I dimers to Pesp1396ICR was partially compensated by high positive cooperativity between the sites (∼200-fold enhancement of binding affinity to a given site when the other site is occupied with the protein). Nevertheless, the net outcome is that Pesp1396IM is a better binder than Pesp1396ICR. This is best illustrated by competition experiments designed to determine how C.Esp1396I partitions between the Pesp1396IM and Pesp1396ICR sites. To this end, fluorescence polarization assays were performed at conditions of competition between Pesp1396IM and Pesp1396ICR fragments. The results, presented in Figure 6B, show that unlabeled Pesp1396IM was an effective competitor of the binding C.Esp1396I to labeled Pesp1396ICR (left panel), whereas unlabeled Pesp1396ICR had no effect on the binding of C.Esp1396I to labeled Pesp1396IM (right panel). We therefore conclude that given a choice, C.Esp1396I binds to Pesp1396IM first, and only then occupies the Pesp1396ICR binding sites.
Mutational analysis of C.Esp1396I binding sites
Structural analysis of a complex of two C.Esp1396I dimers bound to the 35 bp Pesp1396ICR site revealed, surprisingly, that the principal interactions that each dimer makes with its binding site are not determined by a pseudo 2-fold axis that separates two sets of inverted tetranucleotide repeats in the idealized consensus GACTnnnAGTCnnnGACTnnnAGTC (19). Rather, they are related by a 2-fold axis that is offset by half a base pair, which leads to a loss of a pseudo-dyad between the inverted tetranucleotide repeats but results in perfectly symmetrical TATA sequences located between each pair of repeats (19). In addition, TG and CA dinucleotides at the outside of the double site also become symmetrical with respect to this axis. In the structure, each C.Esp1396I dimer makes specific interactions with internal TATA spacers and outer TG/CA dinucleotides. The dyad axis of each dimer in the complex is located between the A and the T of the TATA spacer. For the purposes of the discussion presented below, it is convenient to use the notation introduced by McGeehan et al. (19), where C.Esp1396I subunits A/B comprise the dimer that binds the distal site, while the C/D dimer binds to the proximal site (Figure 1). It is also important to note that in the crystal structure, the Arg35 side-chains of the central subunits B and C each appear in dual conformations (occupancy = 0.5) so that they can interact both with the DNA bases in the centre of the sequence, and with the Glu25 side-chains of adjacent subunits.
Analysis of the esp1396ICR promoter
To investigate further the interactions that contribute to site recognition by C.Esp1396I, EMSA experiments were performed with double-stranded DNA fragments carrying mutations in a 33 bp Pesp1396ICR fragment containing both C.Esp1396I binding sites. We specifically sought to determine the importance of ‘outer’ dinucleotides TG and CA in positions 1, 2 and 32, 33, respectively, and what the consequences would be of introducing the ‘missing’ internal symmetry-related dinucleotide on C.Esp1396I binding to each site. Based on structural analysis, we expected that the former substitutions would decrease the binding, while introduction of symmetry related dinucleotides between the individual binding sites would increase the binding of a C.Esp1396I dimer to a site, while decreasing the cooperativity of the binding. We also introduced double substitutions in the tetranucleotide repeats, to check their importance for the binding, despite the apparent lack of visible specific interaction and the fact that these repeats are not symmetry related in the complex. The results are presented in Figure 7A. For the wild-type fragment, a shifted band corresponding to a bound C.Esp1396I tetramer was observed, in agreement with the analyses above. A minor band corresponding to a dimer was seen only transiently at low concentrations of C.Esp1396I.
Figure 7.

Analysis of C.Esp1396I complexes with wild-type and mutant esp1396I promoters using electrophoretic mobility shift assay. (A) The sequences of the wild-type esp1396ICR C-boxes with symmetrical elements highlighted is presented at the top of the figure. Numbers below refer to positions of nucleotides in the C-box. The gels below show the results of native gel separation of complexes formed in the absence or in the presence of increasing concentrations of C.Esp1396I using wild-type esp1396ICR and various mutants. Note on nomenclature, every mutant fragment (‘mut’) is labeled to indicate positions of the boxes substituted (i.e. 1,2 in the second gel) and the bases introduced by the mutations (GT in the second gel). (B) As in (A), but using wild-type or mutant esp1396IM DNA fragments.
Substitution of the symmetry-related TG dinucleotide for GT at positions 1, 2 strongly decreased the amounts of complexes formed; however, all complexes detected corresponded to the tetrameric complex, i.e. two C.Esp1396I dimers bound to DNA. The observed decrease in binding efficiency is consistent with the significance of the TG dinucleotide for C.Esp1396I binding. Substitution of the symmetry-related CA dinucleotide for AC at positions 32, 33 abolished formation of the tetrameric complex; instead, a dimeric complex was formed. We attribute this to the fact that the proximal site is intrinsically weak (19) and that further reduction in binding affinity by substitution of the CA dinucleotide leads to binding only at the distal site.
A fragment containing a CA dinucleotide at positions 17 and 18 (symmetry related to the TG dinucleotide at positions 1, 2) did not form a low-mobility (tetrameric) complex, instead forming a dimeric complex. We suggest the following explanation. Introduction of the CA dinucleotide should favor the interaction of Arg35 of subunit B with these bases, rather than with Glu25 of subunit C in the adjacent dimer. As a result, cooperativity (i.e. enhancement of the binding of the second dimer to the proximal site) is reduced, leading to the occupation of the distal site only.
A fragment containing a TG dinucleotide at positions 16 and 17 (symmetry related to CA at positions 32, 33) did not form specific complexes with C.Esp1396I. Detailed examination of the structure of the complex provides a possible explanation for the absence of binding to the mutant DNA fragment. Although this mutation might be expected to enhance binding of the proximal dimer through the interaction of Arg35 of subunit C with the newly introduced TG, at the same time it would eliminate the possible interaction of Arg35 of subunit B with the highly conserved central GT, and thus weaken the binding of the A/B dimer to the distal site. Since a protein dimer has to bind to the distal site before occupying the proximal site, almost no DNA binding is observed.
For a fragment carrying a substitution in the tetranucleotide repeat in the distal site (positions 5, 6), only a band whose mobility corresponded to the expected mobility of a complex containing a single C.Esp1396I dimer was observed. For a fragment carrying a substitution in the tetranucleotide repeat in the proximal site (positions 27, 28), we observe a minor tetrameric complex band, together with a large diffuse band of higher mobility than that of the dimeric complex. A fragment carrying substitutions in tetranucleotide repeats in both C.Esp1396I binding sites did not form complexes with C.Esp1396I. Thus, the sequence of tetranucleotide repeats clearly contributes to DNA binding affinity. Further understanding of the precise interactions at these sites will require higher resolution structural data than those currently available.
Analysis of the esp1396IM promoter
The sequence of the single C.Esp1396I binding site within Pesp1396IM is more symmetrical than either of the two Pesp1396ICR binding sites, with only two base pairs (positions 4 and 15) not conforming to palindromic symmetry around the dyad axis located within the central TATA sequence. The symmetrical base pairs include the outer TG/CA dinucleotides that are seen to interact strongly with Arg35 in the crystal structure of the tetrameric complex. The importance of the TATA-centered symmetry could explain the strong preference of C.Esp1396I for the M binding site compared to either the distal or proximal CR binding sites. To test this idea, we separately mutated the TG dinucleotide in positions 1, 2 and the equivalent CA dinucleotide in positions 17 and 18 of the Pesp1396IM binding site. It was confirmed that these outer dinucleotides make a major contribution to DNA sequence recognition, as in both cases the binding was abolished (Figure 7B).
Mutation of the central TATA (positions 10, 11) gave an unexpected result: although binding was significantly weakened, the mobility of the complex was lower than that for the wild type sequence. This probably represents a conformational change, as there is only one binding site on this 18-bp sequence. Since DNA bending results in enhanced gel mobility of C-protein complexes (19,31), one plausible explanation of this result would be that changing TATA to TAGT disrupts the alternating purine–pyrimidine sequence and thus reduces DNA bending in the complex, giving rise to a lower mobility complex.
Next, we mutated two base pairs (positions 6 and 7) within the GAC/GTC sequence that are also related by symmetry around the TATA dyad (but were originally postulated to conform to the GACT/AGTC tetranucleotide repeat). This mutation completely abolishes DNA binding (Figure 7B), showing that recognition of these sequences is also important.
Comparing the sequence of Pesp1396IM with the previously proposed GACT. … AGTC symmetry, Cesnaviciene et al. (8) suggested that this sequence aligned better to the consensus if an insertion was made in the “spacer” region. We therefore introduced an additional base (T) into the spacer region to see if DNA binding was enhanced. On the contrary, however, DNA binding to the mutant fragment (labeled ‘wt+T’ on Figure 7B) was weakened when the TATA symmetry was perturbed by this insertion (Figure 7B), despite the presence of GACT/AGTC palindromes on either side of the TAT spacer in the mutated sequence.
DISCUSSION
In this work, we map Esp1396I promoters and demonstrate that transcription of both the restriction endonuclease and methyltransferase genes is controlled by interdependent regulatory loops governed by the C.Esp1396I protein. In the absence of C.Esp1396I, i.e. in a situation encountered when the Esp1396I system genes enter a naïve host, the esp1396IM promoter is highly active, leading to production of the Esp1396I methyltransferase and methylation of Esp1396I sites in the host genome. Basal transcription from Pesp1396ICR results in gradual accumulation of C.Esp1396I, which upon dimerization binds to a single site in Pesp1396IM, preventing further transcription from this promoter. Further accumulation of C.Esp1396I results in activation and then gradual repression of Pesp1396ICR. The interaction of C.Esp1396I with the binding sites in Pesp1396ICR is highly cooperative and we were unable to detect an ‘activating’ complex of C.Esp1396I dimer with the distal binding site. Instead, a ‘repressing’ complex of C.Esp1396I tetramer bound to both binding sites was detected. A similar situation was encountered during the analysis of ahdICR promoter regulation by C.AhdI (17). There, we showed that transcription activation by C.AhdI can be quantitatively explained by a model in which RNAP outcompetes the C.AhdI dimer from the promoter–proximal binding site due to favorable interactions between the C.AhdI dimer bound at promoter–distal site (OL) and RNAP. The same mechanism of transcription activation is likely operational in the case of Pesp1396ICR. In vitro, such mechanism of activation is quite inefficient, since only a small fraction of templates becomes transcriptionally active even when transcription reaches its maximal levels. Indeed, even at conditions when maximal amounts of open promoter complexes at Pesp1396ICR were formed in vitro (as judged by KMnO4 probing) no DNase I footprint of RNAP could be detected (data not shown). The apparent inefficiency of C.Esp1396I activation is likely to be biologically significant as it decreases the steady-state level of expression of restriction endonuclease, a highly toxic protein. This represents a ‘trade-off’ between optimizing the efficiency of transcription of the endonuclease gene, and ensuring complete shut-down of the gene once sufficient enzyme has been synthesized, the latter being more critical.
Unlike most other R-M systems studied, unregulated expression of Esp1396I methylase from its own promoter is toxic to the cell. The effect must be unrelated to specific methylation activity of the enzyme, since all recognition sites in the host genome must be methylated to prevent restriction. The preferential binding of C.Esp1396I to the Pesp1396IM site decreases the level of esp1396IM expression even before Pesp1396ICR is fully turned on. Presumably evolution has fine-tuned the binding affinities of the operators (and in the case of the C/R promoter, the protein-protein interactions responsible for cooperativity) to optimize the time-dependence and steady-state activity of both methylation and restriction in a coordinated manner. Bioinformatic analysis reveals that several other C-protein dependent systems are organized similarly to Esp1396I (8, V. Sorokin, M. Gelfand, and K.S., unpublished data). In all cases, palindromic sites that likely function as C-protein binding sites are present in front of both the M and CR genes.
The relative binding affinities of C.Esp1396I for the three operator sites involved in this regulatory control circuit are markedly different, reflecting their differing biological functions. The highest affinity binding site for C.Esp1396I is the operator site OM controlling repression of the methyltransferase, the binding affinity of which is ∼20-fold higher than that of the distal operator (OL) that activates transcription of the C/R promoter. The distal operator in turn has ∼50-fold higher affinity than the proximal binding site (OR) that governs repression of the C and R genes. Nevertheless, the OR site is occupied soon after the OL site, due to the high degree of cooperativity (∼200) that arises, at least in part, from the interaction of Arg35 and Glu25 at the interface of adjacent dimers (19). This solution (rather than having a high intrinsic affinity for OR) ensures that transcription of the C/R genes occurs at low levels of controller protein, whilst still allowing complete repression at higher concentrations of the protein.
All three operators (Figure 8) have in common the central TATA sequence that allows compression of the minor groove of the DNA, forcing DNA bending at the centre of the dimer binding site in the complex (19). The strongest binding site, OM, in addition contains the symmetry related TG and CA dinucleotide sequences that interact strongly with Arg35 of the controller protein (19), whereas OL and OR have just one of these dinucleotides (clearly, both TG and CA are not possible simultaneously as the binding sites overlap in this region). It is notable that the sequence of the highest affinity site, OM, is almost perfectly palindromic, with 16 of the 18 bases being related by dyad symmetry (Figure 8). Indeed, at least two of the three operators have identical bases at these 16 sites, of which 7 consecutive bases (TATAGTC) are identical in all three operators.
Figure 8.
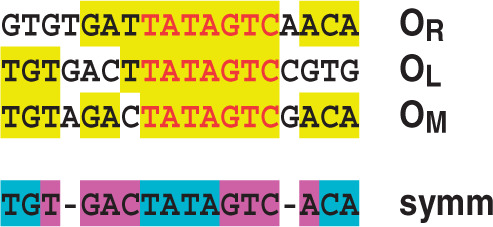
Comparison of operator sequences in Esp1396I. C.Esp1396I binding sites at the CR promoter (proximal, OR; distal, OL) and the M promoter (OM) are aligned. Indicated in yellow are the sites where at least 2/3 of the sequences are identical, seven of which (red lettering) are found in all three. A symmetrical consensus sequence is shown below, closely matching the OM site. Bases identified from the crystal structure as being involved in DNA–protein interactions are indicated in blue; other symmetrical bases likely to interact with helix 3 of the protein are shown in magenta.
Our mutational studies show the importance of the interactions with the TATA and TG/CA bases for complex formation, in agreement with the protein–DNA interactions seen in the crystal structure of the complex (19). In addition, however, it is clear that mutations within the so-called ‘tetranucleotide repeats’ also diminish binding of C.Esp1396I, as has also recently been shown for C.PvuII (32). Interactions of amino acids with bases in this region cannot be clearly identified in the crystal structure at this resolution, but are likely to be present, since this is where the recognition helix (helix 3) inserts into the major groove. Nevertheless, we have shown that insertion of an additional base into the TATA sequence to make the GACT/AGCT sequences symmetric around a TAT spacer reduces DNA binding. Clearly the DNA sequence and structure recognition mechanisms of controller proteins are yet to be fully understood. High-resolution crystallographic studies with all three operator sites are in progress to identify the precise intermolecular interactions in each case.
SUPPLEMENTARY DATA
Supplementary Data are available at NAR Online.
FUNDING
National Institutes of Health (RO1 grant GM59295); National Institutes of Health (FIRCA research grant R03 TW07145); Presidium of Russian Academy of Sciences Molecular and Cellular Biology Program grant (to K.S.) in part. Charles and Johanna Busch Foundation postdoctoral fellowship (to E.B.) in part. BBSRC (BB/E000878/1 to G.K.). Funding for open access charge: National Institutes of Health (grant GM59295 to KS).
Conflict of interest statement. None declared.
Supplementary Material
REFERENCES
- 1.Jeltsch A, Pingoud A. Horizontal gene transfer contributes to the wide distribution and evolution of type II restriction-modification systems. J. Mol. Evol. 1996;42:91–96. doi: 10.1007/BF02198833. [DOI] [PubMed] [Google Scholar]
- 2.Kobayashi I. Restriction-modification systems as minimal forms of life. In: Pingoud A, editor. Restriction Endonucleases. Nucleic Acids and Molecular Biology. Vol. 14. Berlin Heidelberg: Springer; 2004. pp. 19–62. [Google Scholar]
- 3.Kobayashi I. Behavior of restriction-modification systems as selfish mobile elements and their impact on genome evolution. Nucleic Acids Res. 2001;29:3742–3756. doi: 10.1093/nar/29.18.3742. [DOI] [PMC free article] [PubMed] [Google Scholar]
- 4.Ives CL, Nathan PD, Brooks JE. Regulation of the BamHI restriction-modification system by a small intergenic open reading frame, bamHIC, in both Escherichia coli and Bacillus subtilis. J. Bacteriol. 1992;174:7194–7201. doi: 10.1128/jb.174.22.7194-7201.1992. [DOI] [PMC free article] [PubMed] [Google Scholar]
- 5.Anton BP, Heiter DF, Benner JS, Hess EJ, Greenough L, Moran LS, Slatko BE, Brooks JE. Cloning and characterization of the BglII restriction-modification system reveals a possible evolutionary footprint. Gene. 1997;187:19–27. doi: 10.1016/s0378-1119(96)00638-5. [DOI] [PubMed] [Google Scholar]
- 6.Rimseliene R, Vaisvila R, Janulaitis A. The eco72IC gene specifies a trans-acting factor which influences expression of both DNA methyltransferase and endonuclease from the Eco72I restriction-modification system. Gene. 1995;157:217–219. doi: 10.1016/0378-1119(94)00794-s. [DOI] [PubMed] [Google Scholar]
- 7.Semenova E, Minakhin L, Bogdanova E, Nagornykh M, Vasilov A, Heyduk T, Solonin A, Zakharova M, Severinov K. Transcription regulation of the EcoRV restriction-modification system. Nucleic Acids Res. 2005;33:6942–6951. doi: 10.1093/nar/gki998. [DOI] [PMC free article] [PubMed] [Google Scholar]
- 8.Cesnaviciene E, Mitkaite G, Stankevicius K, Janulaitis A, Lubys A. Esp1396I restriction-modification system:structural organization and mode of regulation. Nucleic Acids Res. 2003;31:743–749. doi: 10.1093/nar/gkg135. [DOI] [PMC free article] [PubMed] [Google Scholar]
- 9.Vijesurier RM, Carlock L, Blumenthal RM, Dunbar JC. Role and mechanism of action of C. PvuII, a regulatory protein conserved among restriction-modification systems. J. Bacteriol. 2000;182:477–487. doi: 10.1128/jb.182.2.477-487.2000. [DOI] [PMC free article] [PubMed] [Google Scholar]
- 10.Heidmann S, Seifert W, Kessler C, Domdey H. Cloning, characterization and heterologous expression of the SmaI restriction-modification system. Nucleic Acids Res. 1989;17:9783–9796. doi: 10.1093/nar/17.23.9783. [DOI] [PMC free article] [PubMed] [Google Scholar]
- 11.Tao T, Bourne JC, Blumenthal RM. A family of regulatory genes associated with type II restriction-modification systems. J. Bacteriol. 1991;173:1367–1375. doi: 10.1128/jb.173.4.1367-1375.1991. [DOI] [PMC free article] [PubMed] [Google Scholar]
- 12.McGeehan JE, Streeter SD, Papapanagiotou I, Fox GC, Kneale GG. High-resolution crystal structure of the restriction-modification controller protein C.AhdI from Aeromonas hydrophila. J. Mol. Biol. 2005;346:689–701. doi: 10.1016/j.jmb.2004.12.025. [DOI] [PubMed] [Google Scholar]
- 13.Sawaya MR, Zhu Z, Mersha F, Chan SH, Dabur R, Xu SY, Balendiran GK. Crystal structure of the restriction-modification system control element C.Bcll and mapping of its binding site. Structure. 2005;13:1837–1847. doi: 10.1016/j.str.2005.08.017. [DOI] [PubMed] [Google Scholar]
- 14.Streeter SD, Papapanagiotou I, McGeehan JE, Kneale GG. DNA footprinting and biophysical characterisation of the controller protein C.AhdI suggests the basis of a genetic switch. Nucleic Acids Res. 2004;32:6445–6453. doi: 10.1093/nar/gkh975. [DOI] [PMC free article] [PubMed] [Google Scholar]
- 15.McGeehan JE, Papapanagiotou I, Streeter SD, Kneale GG. Cooperative binding of the C.AhdI controller protein to the C/R promoter and its role in endonuclease gene expression. J. Mol. Biol. 2006;358:523–531. doi: 10.1016/j.jmb.2006.02.003. [DOI] [PubMed] [Google Scholar]
- 16.Bart A, Dankert J, van der Ende A. Operator sequences for the regulatory proteins of restriction modification systems. Mol. Microbiol. 1999;31:1277–1278. doi: 10.1046/j.1365-2958.1999.01253.x. [DOI] [PubMed] [Google Scholar]
- 17.Bogdanova E, Djordjevic M, Papapanagiotou I, Kneale G, Severinov K. Transcription regulation of type II restriction-modification system AhdI. Nucleic Acids Res. 2008;36:1429–1442. doi: 10.1093/nar/gkm1116. [DOI] [PMC free article] [PubMed] [Google Scholar]
- 18.Lubys A, Jurenaite S, Janulaitis A. Structural organization of the plasmid-borne restriction-modification system type II Kpn2I from Klebsiella pneumoniae RLF2. Nucleic Acids Res. 1999;27:4228–4234. doi: 10.1093/nar/27.21.4228. [DOI] [PMC free article] [PubMed] [Google Scholar]
- 19.McGeehan JE, Streeter SE, Thresh S-J, Ball N, Ravelli RBG, Kneale G. Structural analysis of the genetic switch that regulates the expression of restriction-modification genes. Nucleic Acids Res. 2008;36:4778–4787. doi: 10.1093/nar/gkn448. [DOI] [PMC free article] [PubMed] [Google Scholar]
- 20.Sambrook J, Fritsch EF, Maniatis T. Molecular Cloning: A Laboratory Manual. 2nd. Cold Spring Harbor, NY: Cold Spring Harbor Laboratory Press; 1989. [Google Scholar]
- 21.Rak B, Von-Reutern M. Insertion element IS5 contains a third gene. EMBO J. 1984;3:807–811. doi: 10.1002/j.1460-2075.1984.tb01889.x. [DOI] [PMC free article] [PubMed] [Google Scholar]
- 22.Tang H, Kim Y, Severinov K, Goldfarb A, Ebright R. Escherichia coli RNA polymerase holoenzyme: rapid reconstitution from recombinant α, β, β′, and σ subunits. Methods Enzymol. 1996;273:130–134. doi: 10.1016/s0076-6879(96)73012-4. [DOI] [PubMed] [Google Scholar]
- 23.Leblanc B, Moss T. DNAse I footprinting. In: Kneale G, editor. DNA-Protein Interactions; Principles and Protocols. Methods in Molecular Biology. Vol. 30. Totowa, NJ: Humana Press Inc.; 1994. pp. 1–10. [DOI] [PubMed] [Google Scholar]
- 24.Schuck P. Size distribution analysis of macromolecules by sedimentation velocity ultracentrifugation and Lamm equation modelling. Biophys. J. 2000;78:1606–1619. doi: 10.1016/S0006-3495(00)76713-0. [DOI] [PMC free article] [PubMed] [Google Scholar]
- 25.Laue TM, Shah BD, Ridgeway TM, Pelletier SL. Computer-aided interpretation of analytical sedimentation data for proteins. In: Harding S, Rowe A, editors. Analytical Ultracentrifugation in Biochemistry and Polymer Science. Cambridge, UK: Royal Society of Chemistry; 1992. pp. 359–393. [Google Scholar]
- 26.Durchshlag H. Specific volumes of biological macromolecules and some other molecules. In: Hinz HJ, editor. Thermodynamic Data for Biochemistry and Biotechnology. New York: Springer; 1986. p. 108. [Google Scholar]
- 27.Heyduk E, Knoll E, Heyduk T. Molecular beacons for detecting DNA binding proteins: mechanism of action. Anal. Biochem. 2003;316:1–10. doi: 10.1016/s0003-2697(03)00004-6. [DOI] [PubMed] [Google Scholar]
- 28.Knowle D, Lintner RE, Touma YM, Blumenthal RM. Nature of the promoter activated by C.PvuII, an unusual regulatory protein conserved among restriction-modification systems. J. Bacteriol. 2005;187:488–497. doi: 10.1128/JB.187.2.488-497.2005. [DOI] [PMC free article] [PubMed] [Google Scholar]
- 29.Heyduk T, Lee JC. Application of fluorescence energy transfer and polarization to monitor Escherichia coli cAMP receptor protein and lac promoter interaction. Proc. Natl Acad. Sci. USA. 1990;87:1744–1748. doi: 10.1073/pnas.87.5.1744. [DOI] [PMC free article] [PubMed] [Google Scholar]
- 30.Heyduk T, Ma Y, Tang H, Ebright RH. Fluorescence anisotropy: rapid, quantitative assay for protein-DNA and protein-protein interaction. Methods Enzymol. 1996;274:492–503. doi: 10.1016/s0076-6879(96)74039-9. [DOI] [PubMed] [Google Scholar]
- 31.Papapanagiotou I, Streeter SD, Cary PD, Kneale GG. DNA structural deformations in the interaction of the controller protein C.AhdI with its operator sequence. Nucleic Acids Res. 2007;35:2643–2650. doi: 10.1093/nar/gkm129. [DOI] [PMC free article] [PubMed] [Google Scholar]
- 32.Mruk I, Blumenthal RM. Tuning the relative affinities for activating and repressing operators of a temporally regulated restriction-modification system. Nucleic Acids Res. 2009 doi: 10.1093/nar/gkn1010. [Epub ahead of print; doi:10.1093/nar/gkn1010] [DOI] [PMC free article] [PubMed] [Google Scholar]
Associated Data
This section collects any data citations, data availability statements, or supplementary materials included in this article.