

Abstract
Altitude exposure has been associated with loss of appetite and weight loss in healthy humans; however, the endocrine factors that contribute to these changes remain unclear. Leptin and glucagon-like peptide-1 (GLP-1) are peptide hormones that contribute to the regulation of appetite. Leptin increases with hypoxia; however, the influence of hypoxia on GLP-1 has not been studied in animals or humans to date. We sought to determine the influence of normobaric hypoxia on plasma leptin and GLP-1 levels in 25 healthy humans. Subjects ingested a control meal during normoxia and after 17 h of exposure to normobaric hypoxia (fraction of inspired oxygen of 12.5%, simulating approximately 4100 m). Plasma leptin was assessed before the meal, and GLP-1 was assessed premeal, at 20 min postmeal, and at 40 min postmeal. We found that hypoxia caused a significant elevation in plasma leptin levels (normoxia, 4.9 ± 0.8 pg·mL−1; hypoxia, 7.7 ± 1.5 pg·mL−1; p < 0.05; range, −16% to 190%), no change in the average GLP-1 response to hypoxia, and only a small trend toward an increase in GLP-1 levels 40 min postmeal (fasting, 15.7 ± 0.9 vs 15.9 ± 0.7 pmol·L−1; 20 min postmeal, 21.7 ± 0.9 vs 21.8 ± 1.2 pmol·L−1; 40 min postmeal, 19.5 ± 1.2 vs. 21.0 ± 1.2 pmol·L−1 for normoxia and hypoxia, respectively; p > 0.05 normoxia vs hypoxia). There was a correlation between SaO2 and leptin after the 17 h exposure (r= 0.45; p < 0.05), but no relation between SaO2 and GLP-1. These data confirm that leptin increases with hypoxic exposure in humans. Further study is needed to determine the influence of hypoxia and altitude on GLP-1 levels.
Keywords: high-altitude, anorexia, appetite, low-oxygen
Introduction
Appetite suppression and weight loss have been commonly described in high-altitude sojourners (Westerterp et al. 1994; Westerterp-Plantenga 1999). Although a portion of this weight loss is likely due to a loss of muscle mass, a decrease in caloric intake for a given caloric expenditure might also play a role. Although some of the loss of appetite that accompanies high-altitude exposure is likely due to the commonly described symptoms of acute mountain sickness, which include nausea; even with time for acclimatization and minimal symptoms of acute mountain sickness, appetite seems to be suppressed (Tschop and Morrison 2001). In addition to exposure to hypobaric hypoxia, exposure to nortnobaric hypoxia has also been shown to result in appetite suppression and decreased caloric intake (Rose et al. 1988; Westerterp-Plantenga et al. 1999).
The specific pathways that are responsible for the suppression of appetite that accompanies hypoxia and high-altitude exposure remain unclear. Hypoxemia activates a number of hypoxia-inducible genes, through hypoxia-inducible factor alpha (HIF-α) pathways (Wenger and Gassmann 1997). Some of these genes encode for proteins that are known to influence appetite, such as leptin (Grosfeld et al. 2002b; Guerre-Millo et al. 2002). Although most studies have demonstrated that leptin levels increase with hypoxia — this increase has been described as a possible mechanism for the reduction in food intake at high altitudes — leptin-receptor-deficient mice also demonstrate a reduction in caloric intake with hypoxia, suggesting that another protein is responsible for altitude-induced anorexia (Simler et al. 2006). Other peptides involved in the regulation of hunger include glucagon-like peptide (GLP)-1, adiponectin, and ghrelin (Bailey 2000; Lovshin and Drucker 2000; Drucker 2002; Anini and Brubaker 2003; Cupples 2005). In particular, there has been much interest in GLP-1 as a protein that is synthesized in intestinal endocrine cells and controls satiety and food intake (Drucker 2002). GLP-1 levels increase after meals, and there is a growing body of evidence that demonstrates that GLP-1 administration can reduce acute and chronic food intake in normal and diabetic subjects; however, no studies have looked at the effects of hypoxia on GLP-1 levels in animals or humans (Bailey 2000; Drucker 2002; Gutzwiller et al. 2004).
Leptin and GLP-1 have an additive effect on the decrease of food intake in rats (Bojanowska and Nowak 2007). Leptin has been shown to lead to an increase in GLP-1 secretion in cell lines, leptin resistance is associated with impaired GLP-1 secretion, and promoter activity for the GLP-1 receptor increases in the presence of leptin (Anini and Brubaker 2003; Brubaker and Anini 2003; Sanz et al. 2008). Given these findings, it is possible that the increase in leptin that accompanies hypoxia and high-altitude exposure is stimulating the secretion of the appetite-suppressing GLP-1, and therefore indirectly altering appetite. The focus of this study was to examine the influence of 17 h of normobaric hypoxia (fraction of inspired oxygen (FiO2), 12.5%, equivalent to an altitude of 4100 m) on plasma leptin and GLP-1 levels in healthy adults. We hypothesized that acute hypoxia would lead to an increase in both leptin and GLP-1 levels, and that these changes would be associated with changes in oxygen saturation (SaO2) during hypoxia.
Materials and methods
Subjects
The protocol was reviewed and approved by the Mayo Clinic Institutional Review Board, all participants provided written informed consent before the study, and all aspects of the study were performed in accordance with the Declaration of Helsinki. Participating in this study were 25 healthy nonsmokers who did not meet the exclusion criteria (cardio-pulmonary abnormalities, pregnancy, inability to exercise), and who were not taking prescription medications for cardiovascular or lung disease. All subjects were from the Rochester, Minnesota area, were of normal weight, were moderately active, were diabetes free, and had not been to an altitude higher than 500 m in the previous 12 months.
Protocol
The study involved 2 separate visits to our laboratory: a screening visit and a 17 h hypoxic exposure visit. The screening tests included baseline pulmonary function testing, an incremental cycle ergometry test to exhaustion (to rule out cardiopulmonary abnormalities), a complete blood count (to rule out anemia), and, in women, a pregnancy test.
After screening, on a separate day, subjects checked into our laboratory at 1300 hours for the hypoxic exposure visit. Prehypoxia blood samples were drawn for a complete blood count and for the fasting assessment of leptin and GLP-1 levels. In addition, GLP-1 was sampled 20 and 40 min after the intake of a control meal. This testing protocol for GLP-1 was based on work that demonstrated that response to food intake is important when studying GLP-1 (Deacon 2004). Upon completion of the baseline room-air tests, subjects entered a hypoxic tent, with a controlled FiO2 of 12.5% (Colorado Altitude Training Corporation, Boulder, Colo.), at approximately 1600 hours, and remained in the tent for 17 h. While in the tent, heart rate and oxygen saturation (SaO2) were monitored continuously by pulse-oximetry (Nellcor; Pleasanton, Calif.). Blood pressure, symptoms (Lake Louise scale), and tent gasses were monitored every 2 hours by a nurse from the Mayo Clinic General Clinic Research Center (Savourey et al. 1995). The Lake Louise scale has been shown to be useful for assessing symptoms of high-altitude illness, including high-altitude pulmonary edema and high-altitude cerebral edema (Savourey et al. 1995). Subjects are asked a series of questions, ranging from gastrointestinal discomfort, to evidence of systemic edema, to dyspnea, to general fatigue. Subjects are given a score of 0 if they had no discomfort for a given symptom, and 3 if they had major discomfort. After the overnight stay in the hypoxic tent, and while maintaining hypoxia, fasting and post-meal blood samples were again drawn (starting at 0700h). The relation between increases in Lake Louise score and changes in physiological parameters with hypoxia was then assessed.
Assays
Leptin
Leptin was assessed in a fasting state both before and after hypoxic exposure. Leptin was assessed with radio-immunoassay at the Mayo Clinic immunochemical core laboratory, as described elsewhere (Pelleymounter et al. 1995). Briefly, 3 mL of plasma was collected in EDTA tubes from each subject. For the assay, 2 levels of control, supplied by the manufacturer, were assessed with each run. The assay buffer (300 μL) was pippetted into nonspecific binding tubes: 200 μL into reference (Bo) tubes, and 100 μL into the remaining tubes. 125I-leptin was added to all tubes. In addition, 100 μL of leptin antibody was added to all tubes, except the total binding tubes and the nonspecific binding tubes. Tubes were covered, vortexed, and incubated overnight at 4 °C. After 18–24 h of incubation, 1 mL of cold precipitating reagent was added to all tubes, except the total binding tubes, and tubes were incubated again at 4 °C for 20 min. Tubes were then centrifuged, the supernate was aspirated, and the tubes were counted in a gamma counter. StatLIA software (Brendan Scientific, Oak Park, Mich.) was used for curve fitting, with a minimal detection limit of 0.5 ng·mL−1.
GLP-1
GLP-1 was assessed in the fasting state, and at 20 and 40 min after ingestion of a control meal, as described elsewhere (Deacon 2004). The 500 kcal meal was identical with and without hypoxic exposure; 58% of the calories were derived from carbohydrate, 33% from fat, and 9% from protein. Venous blood (3 mL) was drawn into chilled tubes, containing EDTA (final concentration, 7.4 mmol·L−1), at each timepoint during normoxia and at each timepoint after 17 h of hypoxic exposure. Immediately after the blood was drawn, valine-pyrrolidide, a dipeptidyl peptidase IV inhibitor (final concentration, 0.01 mmol·L−1; Novo Nordisk, Bagsvaerd, Denmark), was added. The plasma was separated by centrifugation at 4 °C, and stored at −20 °C until the analysis was performed.
GLP-1 concentrations were determined, as described elsewhere, using antiserum 89390, which has an absolute requirement for the intact amidated COOH terminus of GLP-1 (7–36) amide (Orskov et al. 1994). This assay cross-reacts 83% with the NH2-terminally truncated metabolite, GLP-1 (9–36) amide and, therefore, is suitable for determining the total amount of GLP-1 secreted in response to the meal (Hansen et al. 1999). All samples were measured in a single assay (intra-assay variation, <6%) after ethanol extraction (70% v/v; giving a recovery of 75% for GLP-1 added to plasma before extraction) (Orskov and Poulsen 1991).
Data analysis
All statistical analyses were performed using the SPSS statistical software package (v. 12.0, Chicago, III.). Changes in heart rate, blood pressure, SaO2, hemoglobin, hematocrit, and symptoms that accompanied hypoxia were compared using a paired-samples t test. Changes in leptin and GLP-1 were compared using a repeated-measures ANOVA. Pearson’s correlation coefficient was used to determine the relation between the changes in leptin, GLP-1, and SaO2. Correlations were also used to determine the relations of height, mass, age, body mass index (BMI), and body surface area, to changes in fasting GLP-1. Characteristics of GLP-1 responders (those who demonstrated an increase in GLP-1 at all timepoints on average) and non-responders (those who demonstrated no change or a decrease in GLP-1 on average) were compared using an independent-samples t test. Homogeneity of variance was determined using a Levene’s test for equality of variance before each ANOVA and t test. An alpha level of 0.05 was used to determine significance for each statistical test.
Results
Twenty-five untrained subjects, with an average age of 30 ± 8 years and an average body mass index of 25 ± 3 kg·m−2, completed all aspects of the study (Table 1).
Table 1.
Subject characteristics, mean ± SD (n = 25)
| Age (y) | 30±8 |
| Sex (% female) | 27 |
| Height (cm) | 179±9 |
| Weight (kg) | 80±12 |
| BMI (kg·m−2) | 25±3 |
| VO2 peak (% predicted) | 103±16 |
Note: BMI, body mass index;
VO2 peak, maximal oxygen consumption determined from cycle ergotmetry test.
Exposure to 17 h of normobaric hypoxia resulted in a significant sustained decrease in SaO2 and diastolic blood pressure, and an increase in heart rate (p < 0.05, Table 2). Hypoxic exposure also resulted in a mild increase in Lake Louise score, indicating significant increases in headache and nausea.
Table 2.
Physiological response to 17 h of hypoxia
| Response | Baseline | Hypoxia |
|---|---|---|
| Heart rate (beats·min−1) | 60±8 | 74±11* |
| Systolic blood pressure (mm Hg) | 115±10 | 119±12 |
| Diastolic blood pressure (mm Hg) | 78±8 | 69±7* |
| Mean arterial pressure (mm Hg) | 90±7 | 87±7 |
| Arterial O2 saturation (%) | 98±0.6 | 83±3* |
| Hemoglobin (g·dL−1) | 15±1 | 15±1 |
| Hematocrit (%) | 42±3 | 44±3 |
| Lake Louise score | 0 | 1.5+1 |
| Headache (out of 3) | 0 | 0.8±0.6* |
| Nausea (out of 3) | 0 | 0.3±0.1* |
| Shortness of breath (out of 3) | 0 | 0.2±0.3 |
p < 0.05, compared with baseline.
Hypoxia caused an increase in serum leptin levels (4.9 ± 0.8 and 7.7 ±1.5 pg·mL−1 for normoxia and hypoxia, respectively; p < 0.05; Fig. 1), but no change in fasting or 20 min postmeal GLP-1 levels (p > 0.05); there was a small trend toward an increase in absolute GLP-1 levels at 40 min postmeal, but this did not reach statistical significance (prehypoxia, 19.5 ± 1 pmol·L−1; posthypoxia, 21.0 ± 1 pmol·L−1; p = 0.10; Figs. 1 and 2). There was considerable heterogenity in the GLP-1 response to hypoxia at the fasting, 20 min postmeal, and 40 min postmeal timepoints (Fig. 3), but this heterogeneity was not related to sex, height (r2 = 0.01), mass (r2 = 0.05), BMI (r2 = 0.04), body surface area (r2 = 0.03), or fitness (r2 = 0.03). We did, however, find a significant relation between normoxia leptin levels and the change in fasting GLP-1 levels with hypoxic exposure (Fig. 4). Interestingly, there was not a strong relation between change in leptin level and change in GLP-1 level, suggesting that this response was altered by differences in the binding of leptin posthypoxia or by the relatively small change in leptin. The ratio of subjects with increases in GLP-1 greater than 1 standard deviation (SD) to subjects with decreases in GLP-1 greater than 1 SD was 5:2 at fasting, 2:1 at 20 min postmeal, and 6:1 at 40 min postmeal timepoints. Subjects with hypoxia who had increases in fasting GLP-1 at the 40 min postmeal timepoint were slightly younger and had a higher BMI than those who had no change or a decrease in fasting GLP-1, but the entire group was fairly homogenous to begin with (responders: mean age, 29 ± 2 y and mean BMI, 26 ± 1 kg·m−2; nonresponders: mean age, 31 ± 3 y and mean BMI, 24 ± 1 kg·m−2). Subjects who had an average increase in GLP-1 with hypoxia (at all 3 timepoints: premeal, 20 min post-meal, and 40 min postmeal) were younger than those with no change or an average decrease in GLP-1 (Table 3). Although the change in leptin was related to SaO2 (r = 0.45; p < 0.05), there was no significant relation between SaO2 and the change in fasting, 20 min, or 40 min post-meal GLP-1 levels (r = 0.11; p > 0.05; Fig. 5). Interestingly, the Lake Louise scale found no significant relation between changes in leptin or GLP-1 levels and nausea.
Fig. 1.
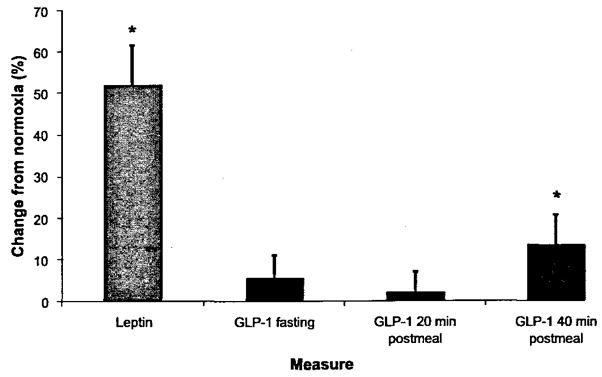
Changes in leptin and glucagon-like peptide (GLP)-1 in response to 17 h of hypoxic exposure. Error bars represent the standard error of the mean; n = 25; *p < 0.05% change from normoxia to hypoxia, compared with 0.
Fig. 2.
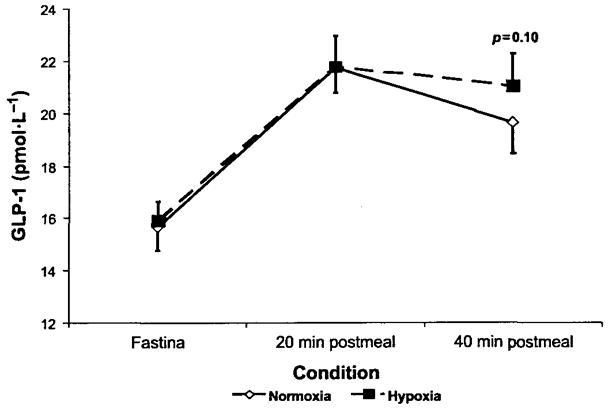
Changes in GLP-1 levels after 17 h of hypoxic exposure.
Fig. 3.
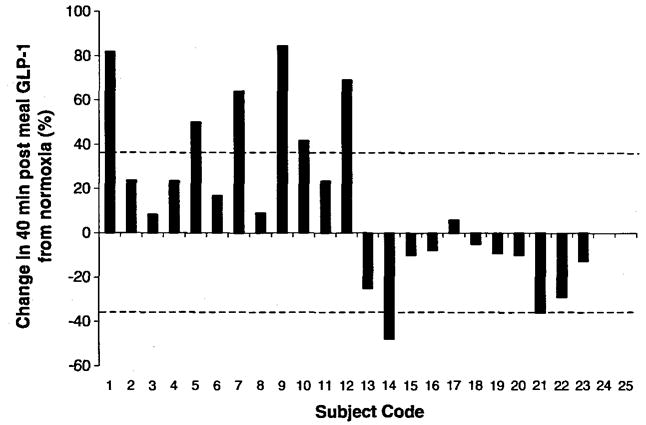
Individual change in GLP-1 after hypoxic exposure. The dashed lines represent 1 SD of the mean for that condition.
Fig. 4.
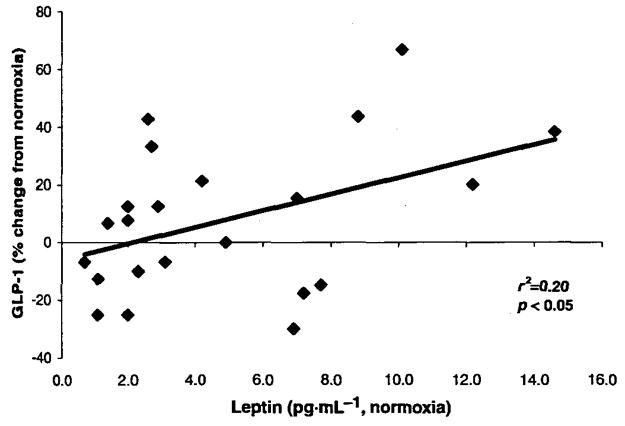
Relation between normoxic leptin levels and changes in fasting GLP-1 levels with hypoxic exposure.
Table 3.
Characteristics of responders and nonresponders with hypoxic exposure
| Variable | Non-responders | Responders |
|---|---|---|
| n | 12 | 13 |
| Change in fasting GLP-1 (%) | −7 | 12 |
| Leptin (% change with hypoxia) | 43±17 | 47±7 |
| O2 saturation (%) | 83±1 | 83±1 |
| Age (y) | 34±3 | 27±1* |
| Height (cm) | 178±3 | 177±2 |
| Mass (kg) | 79±4 | 81±3 |
| BMI (kg·m−2) | 25±1 | 26±1 |
| VO2 peak (% predicted) | 107±6 | 103±4 |
Note: Responders are defined as subjects with an increase in fasting, 20 min postmeal, and 40 min postmeal glucagon-like peptide (GLP)-1 levels with hypoxic exposure; non-responders are defined as those with no change or an average decrease in fasting, 20 min postmeal, and 40 min postmeal GLP-1 levels with hypoxic exposure.
p < 0.05.
Fig. 5.
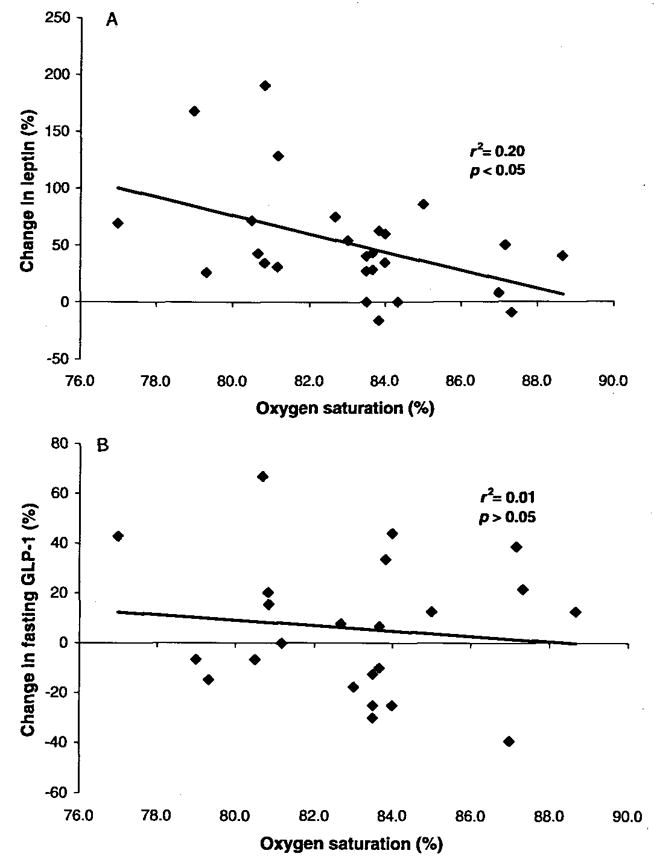
Relation between oxygen saturation and changes in leptin and GLP-1.
Discussion
We found that 17 h of hypoxic exposure resulted in an increase in fasting leptin levels and no change in GLP-1 levels for all 3 time-points, on average, although a minor trend might exist toward an increase in GLP-1 levels at 40 min after the consumption of a control meal. The demonstrated increase in leptin was very similar to the findings of (Shukla et al. (2005), who examined the effects of altitude (4300 m) on leptin levels in humans. The changes in serum leptin were related to SaO2, but the changes in GLP-1 were not; this suggests that leptin, but not GLP-1, is sensitive to changes in SaO2. Approximately half the subjects demonstrated an increase in fasting GLP-1 at all 3 timepoints, on average, and half demonstrated a decrease. The group with increased GLP-1 levels with hypoxia was significantly younger than the group with decreased GLP-1 levels, but no other demographic variables differed significantly between these 2 groups.
Exposure to high altitude results in weight loss, much of which can be attributed to loss of fat mass (Westerterp et al. 1994; Westerterp-Plantenga 1999; Westerterp-Plantenga et al. 1999; Tschop and Morrison 2001; Bailey et al. 2004). This weight loss is typically the result of a combination of an increase in physical activity and a reduction in caloric intake (Westerterp-Plantenga 1999; Westerterp-Plantenga et al. 1999). Leptin is associated with obesity, causes a reduction in food intake, and is released from adipose cells in response to caloric consumption (Ahima and Flier 2000; Ahima et al. 2000). Although some studies have suggested no change or a slight decrease in leptin levels with hypoxic and high-altitude exposure, the majority of studies suggest that leptin increases with hypoxic and high-altitude exposure (Tschop et al. 2000; Grosfeld et al. 2001, 2002a; Grosfeld et al. 2002b; Guerre-Millo et al. 2002; Yasumasu et al. 2002; Cabrera de Leon et al. 2004). The relation we found between changes in leptin and SaO2 levels appears to confirm previous work describing leptin as a hypoxia-inducible protein; however, the fact that we assessed SaO2, leptin, and GLP-1 levels only at specific pre- and posthypoxia time-points, rather than continuously, limits our ability to make conclusions. It is believed that leptin plays a role in angiogenesis with hypoxic and high-altitude exposure. Interestingly, leptin has been shown to be angiostatic in fat cells, possibly retarding the growth of new vessels in these cells, and therefore sparing angiogenic activity for other parts of the body exposed to high altitudes (Grosfeld et al. 2002b; Lerman et al. 2003; Hausman and Richardson 2004). Although leptin levels increase with hypoxia, and leptin is a possible source of the appetite loss that accompanies hypoxia, obese Zucker rats deficient in leptin receptors were found to reduce their intake of food with hypoxic exposure, suggesting that leptin is likely not the only contributing factor to altitude-induced anorexia (Simler et al. 2006).
Of interest, leptin has been shown to have an effect on GLP-1 secretion in rat intestinal cells. In addition, the administration of leptin and exendin-4 (a GLP-1 agonist) has an additive effect on the reduction in food intake in rats, leptin increases the promoter activity of the receptor of GLP-1, and mice with a resistance to leptin have impaired GLP-1 secretion (Brubaker and Anini 2003; Bojanowska and Nowak 2007; Sanz et al. 2008). These findings suggest that leptin has an indirect effect on the appetite suppression that accompanies hypoxia, through a GLP-1-mediated pathway (Anini and Brubaker 2003), which might explain why leptin levels increase and appetite decreases, even in leptin-receptor-deficient animals. In support of this, we did find a relation between fasting leptin levels and the change in fasting GLP-1 levels with hypoxic exposure, suggesting that this increase in availability of leptin augments GLP-1 levels.
The effects of hypoxia on GLP-1 have not been studied previously in humans. GLP-1 levels increase in response to food intake, and the administration of GLP-1 results in caloric restriction (Bailey 2000; Gutzwiller et al. 2004; Cupples 2005). In this study, we found a trend toward elevations in GLP-1 after 17 h of normobaric hypoxic exposure at 40 min postmeal. There was considerable heterogeneity in the GLP-1 response to hypoxia. We performed a post hoc analysis in an attempt to determine the source of this heterogenous response, and found that changes in fasting GLP-1 levels that accompany hypoxia (i.e., responders vs nonresponders) were not related to sex, height, mass, BMI, body surface area, or fitness; however, we did find that those who had increases in GLP-1 with hypoxic exposure were younger and had a slightly higher BMI than those who had no change or who had decreases in GLP-1, although the group as a whole was very homogenous. Further study is needed with a more heterogeneous population.
Limitations
In this study, we assessed fasting leptin and GLP-1 levels and also assessed GLP-1 levels at 20 and 40 min after the intake of a control meal. We noticed a widening in the differences between fasting and 40 min postmeal GLP-1 levels after hypoxic exposure; therefore, future studies should assess GLP-1 levels 60 min postmeal or longer to determine if this difference continues to widen. In support of this, Brubaker and Anini (2003) have described the secretion profile for GLP-1 as biphasic, with an initial peak around 30 min postmeal and a more prolonged peak 60–120 min postmeal. Although we assessed GLP-1 with a test that has been used elsewhere (premeal and 2 postmeal timepoints), we only performed fasting assessments of leptin. Future studies should measure leptin at all timepoints to determine if there is a relation between leptin and GLP-1 changes after food intake.
The novelty of this study is the measurement of GLP-1 levels in normal humans with hypoxia. The use of GLP-1 in appetite suppression and the management of diabetes is gaining interest; however, no previous studies have examined the effects of hypoxia on GLP-1. Although we did monitor Lake Louise scores for symptoms of acute mountain sickness, we did not use a questionnaire that was specific to loss of appetite (Savourey et al. 1995; Blom et al. 2006). Previous studies have examined the relation between loss of appetite and serum leptin levels with high-altitude exposure; future studies should also look at the relation between GLP-1 levels and appetite after hypoxic and high-altitude exposure. In addition, future studies should focus on the influence of hypoxia and altitude on leptin and GLP-1 levels and on the expression of the receptors for these proteins.
Conclusions
We found that 17 h of hypoxic exposure resulted in elevations in serum leptin levels and a small trend toward elevations in GLP-1 levels 40 min after the intake of a control meal. Subjects with hypoxia who had an average increase in fasting GLP-1 levels at all 3 timepoints were younger than those who had no change or a decrease, suggesting that this protein plays a role in the loss of appetite that accompanies hypoxia in younger people. We observed a significant relation between changes in serum leptin levels and SaO2 after hypoxic exposure, but no relation between changes in GLP-1 levels and SaO2. Interestingly, there was also a relation between leptin levels and changes in GLP-1 with hypoxia. These data suggest that the reduction in caloric intake that accompanies hypoxic and high-altitude exposure is the result of increases in fasting levels of leptin and changes in GLP-1 after caloric consumption, but that GLP-1 is not be a hypoxia-inducible protein. This is the first study, to our knowledge, to examine the influence of hypoxic exposure on GLP-1 levels in humans; more study is needed to confirm and expand on these results.
Acknowledgments
This work was supported by NIH Grant HL71478, and AHA Grant 56051Z. We would like to thank Kathy O’Malley and Angela Heydman for their help with data collection, as well as the efforts of the study participants. We would also like to thank the staff of the General Clinical Research Center (GCRC) for their assistance throughout this study. The Mayo Clinic GCRC is supported by US Public Health Service grant M01-RR00585.
Contributor Information
Eric M. Snyder, Department of Pharmacy Practice and Science, University of Arizona, 1703 E. Mabel, Tucson, AZ 85721, USA
Richard D. Carr, Novo-Nordisk, DK-2760 Maaloev, Bagsvaerd, Denmark
Carolyn F. Deacon, University of Copenhagen, 2200 København N, Copenhagen, Denmark
Bruce D. Johnson, Division of Cardiovascular Diseases, Mayo Clinic College of Medicine, 200 1st St., Rochester, MN 55905, USA
References
- Ahima RS, Flier JS. Leptin. Annu Rev Physiol. 2000;62:413–437. doi: 10.1146/annurev.physiol.62.1.413. [DOI] [PubMed] [Google Scholar]
- Ahima RS, Saper CB, Flier JS, Elmquist JK. Leptin regulation of neuroendocrine systems. Front Neuroendocrinol. 2000;21:263–307. doi: 10.1006/frne.2000.0197. [DOI] [PubMed] [Google Scholar]
- Anini Y, Brubaker PL. Role of leptin in the regulation of glucagon-like peptide-1 secretion. Diabetes. 2003;52:252–259. doi: 10.2337/diabetes.52.2.252. [DOI] [PubMed] [Google Scholar]
- Bailey CJ. Potential new treatments for type 2 diabetes. Trends Pharmacol Sci. 2000;21:259–265. doi: 10.1016/S0165-6147(00)01506-6. [DOI] [PubMed] [Google Scholar]
- Bailey DM, Ainslie PN, Jackson SK, Richardson RS, Ghatei M. Evidence against redox regulation of energy homoeostasis in humans at high altitude. Clin Sci (Lond) 2004;107:589–600. doi: 10.1042/CS20040085. [DOI] [PubMed] [Google Scholar]
- Blom WA, Lluch A, Stafleu A, Vinoy S, Holst JJ, Schaafsma G, Hendriks HF. Effect of a high-protein breakfast on the postprandial ghrelin response. Am J Clin Nutr. 2006;83:211–220. doi: 10.1093/ajcn/83.2.211. [DOI] [PubMed] [Google Scholar]
- Bojanowska E, Nowak A. Interactions between leptin and exendin-4, a glucagon-like peptide-1 agonist, in the regulation of food intake in the rat. J Physiol Pharmacol. 2007;58:349–360. [PubMed] [Google Scholar]
- Brubaker PL, Anini Y. Direct and indirect mechanisms regulating secretion of glucagon-like peptide-1 and glucagon-like peptide-2. Can J Physiol Pharmacol. 2003;81:1005–1012. doi: 10.1139/y03-107. [DOI] [PubMed] [Google Scholar]
- Cabrera de Leon A, Gonzalez DA, Mendez LI, Aguirre-Jaime A, del Cristo Rodriguez Perez M, Coello SD, Trujillo IC. Leptin and altitude in the cardiovascular diseases. Obes Res. 2004;12:1492–1498. doi: 10.1038/oby.2004.186. [DOI] [PubMed] [Google Scholar]
- Cupples WA. Physiological regulation of food intake. Am J Physiol Regul Integr Comp Physiol. 2005;288:R1438–R1443. doi: 10.1152/ajpregu.00195.2005. [DOI] [PubMed] [Google Scholar]
- Deacon CF. Circulation and degradation of GIF and GLP-1-Horm. Metab Res. 2004;36:761–765. doi: 10.1055/s-2004-826160. [DOI] [PubMed] [Google Scholar]
- Drucker DJ. Biological actions and therapeutic potential of the glucagon-like peptides. Gastroenterology. 2002;122:531–544. doi: 10.1053/gast.2002.31068. [DOI] [PubMed] [Google Scholar]
- Grosfeld A, Turban S, Andre J, Cauzac M, Challier JC, Hauguel-de Mouzon S, Guerre-Millo M. Transcriptional effect of hypoxia on placental leptin. FEBS Lett. 2001;502:122–126. doi: 10.1016/S0014-5793(01)02673-4. [DOI] [PubMed] [Google Scholar]
- Grosfeld A, Andre J, Hauguel-De Mouzon S, Berra E, Pouyssegur J, Guerre-Millo M. Hypoxia-inducible factor 1 transactivates the human leptin gene promoter. J Biol Chem. 2002a;277:42953–42957. doi: 10.1074/jbc.M206775200. [DOI] [PubMed] [Google Scholar]
- Grosfeld A, Zilberfarb V, Turban S, Andre J, Guerre-Millo M, Issad T. Hypoxia increases leptin expression in human PAZ6 adipose cells. Diabetologia. 2002b;45:527–530. doi: 10.1007/s00125-002-0804-y. [DOI] [PubMed] [Google Scholar]
- Guerre-Millo M, Grosfeld A, Issad T. Leptin is a hypoxia-inducible gene [letter and reply] Obes Res. 2002;10:856–858. doi: 10.1038/oby.2002.116. [DOI] [PubMed] [Google Scholar]
- Gutzwiller J-P, Degen L, Matzinger D, Prestin S, Beglinger C. Interaction between GLP-1 and CCK-33 in inhibiting food intake and appetite in men. Am J Physiol Regul Integr Comp Physiol. 2004;287:R562–R567. doi: 10.1152/ajpregu.00599.2003. [DOI] [PubMed] [Google Scholar]
- Hansen L, Deacon CF, Orskov C, Holst JJ. Glucagon-like peptide-1-(7–36) amide is transformed to glucagon-like peptide-l-(9–36) amide by dipeptidyl peptidase IV in the capillaries supplying the L cells of the porcine intestine. Endocrinology. 1999;140:5356–5363. doi: 10.1210/en.140.11.5356. [DOI] [PubMed] [Google Scholar]
- Hausman GJ, Richardson RL. Adipose tissue angiogenesis. J Anim Sci. 2004;82:925–934. doi: 10.2527/2004.823925x. [DOI] [PubMed] [Google Scholar]
- Lerman OZ, Galiano RD, Armour M, Levine JP, Gurtner GC. Cellular dysfunction in the diabetic fibroblast: impairment in migration, vascular endothelial growth factor production, and response to hypoxia. Am J Pathol. 2003;162:303–312. doi: 10.1016/S0002-9440(10)63821-7. [DOI] [PMC free article] [PubMed] [Google Scholar]
- Lovshin J, Drucker DJ. Synthesis, secretion and biological actions of the glucagon-like peptides. Pediatr Diabetes. 2000;1:49–57. doi: 10.1034/j.1399-5448.2000.010108.x. [DOI] [PubMed] [Google Scholar]
- Orskov C, Poulsen SS. Glucagonlike peptide-I-(7–36)-amide receptors only in islets of Langerhans. Autoradiographic survey of extracerebral tissues in rats Diabetes. 1991;40:1292–1296. doi: 10.2337/diabetes.40.10.1292. [DOI] [PubMed] [Google Scholar]
- Orskov C, Rabenhoj L, Wettergren A, Kofod H, Hoist JJ. Tissue and plasma concentrations of amidated and glycine-extended glucagon-like peptide I in humans. Diabetes. 1994;43:535–539. doi: 10.2337/diabetes.43.4.535. [DOI] [PubMed] [Google Scholar]
- Pelleymounter MA, Cullen MJ, Baker MB, Hecht R, Winters D, Boone T, Collins F. Effects of the obese gene product on body weight regulation in ob/ob mice. Science. 1995;269:540–543. doi: 10.1126/science.7624776. [DOI] [PubMed] [Google Scholar]
- Rose MS, Houston CS, Fulco CS, Coates G, Sutton JR, Cymerman A. Operation everest. II: Nutrition and body composition. J Appl Physiol. 1988;65:2545–2551. doi: 10.1152/jappl.1988.65.6.2545. [DOI] [PubMed] [Google Scholar]
- Sanz C, Vazquez P, Navas MA, Alvarez E, Blazquez E. Leptin but not neuropeptide Y up-regulated glucagon-like peptide 1 receptor expression in GT1–7 cells and rat hypothalamic slices. Metabolism. 2008;57:40–48. doi: 10.1016/j.metabol.2007. 08.005. [DOI] [PubMed] [Google Scholar]
- Savourey G, Guinet A, Besnard Y, Garcia N, Hanniquet AM, Bittel J. Evaluation of the Lake Louise acute mountain sickness scoring system in a hypobaric chamber. Aviat Space Environ Med. 1995;66:963–967. [PubMed] [Google Scholar]
- Shukla V, Singh SN, Vats P, Singh VK, Singh SB, Banerjee PK. Ghrelin and leptin levels of sojourners and acclimatized lowlanders at high altitude. Nutr Neurosci. 2005;8:161–165. doi: 10.1080/10284150500132823. [DOI] [PubMed] [Google Scholar]
- Simler N, Grosfeld A, Peinnequin A, Guerre-Millo M, Bigard AX. Leptin receptor-deficient obese Zucker rats reduce their food intake in response to hypobaric hypoxia. Am J Physiol Endocrinol Metab. 2006;290:E591–E597. doi: 10.1152/ajpendo.00289.2005. [DOI] [PubMed] [Google Scholar]
- Tschop M, Morrison KM. Weight loss at high altitude. Adv Exp Med Biol. 2001;502:237–247. doi: 10.1007/978-1-4757-3401-0_16. [DOI] [PubMed] [Google Scholar]
- Tschop M, Strasburger CJ, Topfer M, Hautmann H, Riepl R, Fischer R, et al. Influence of hypobaric hypoxia on leptin levels in men. Int J Obes Relat Metab Disord. 2000;24:S151. doi: 10.1038/sj.ijo.0801309. [DOI] [PubMed] [Google Scholar]
- Wenger RH, Gassmann M. Oxygen(es) and the hypoxia-inducible factor-1. Biol Chem. 1997;378:609–616. [PubMed] [Google Scholar]
- Westerterp KR, Kayser B, Wouters L, Le Trong JL, Richalet JP. Energy balance at high altitude of 6,542 m. J Appl Physiol. 1994;77:862–866. doi: 10.1152/jappl.1994.77.2.862. [DOI] [PubMed] [Google Scholar]
- Westerterp-Plantenga MS. Effects of extreme environments on food intake in human subjects. Proc Nutr Soc. 1999;58:791–798. doi: 10.1017/S002966519900107X. [DOI] [PubMed] [Google Scholar]
- Westerterp-Plantenga MS, Westerterp KR, Rubbens M, Verwegen CR, Richelet JP, Gardette B. Appetite at “high altitude” [Operation Everest III (Comex-‘97)]: a simulated ascent of Mount Everest. J Appl Physiol. 1999;87:391–399. doi: 10.1152/jappl.1999.87.1.391. [DOI] [PubMed] [Google Scholar]
- Yasumasu T, Takahara K, Nakashima Y. Hypoxia inhibits leptin production by cultured rat adipocytes [letter] Obes Res. 2002;10:128. doi: 10.1038/oby.2002.20. [DOI] [PubMed] [Google Scholar]