

Abstract
Proteins of the CLCA gene family including the human ClCa1 (hClCa1) have been suggested to constitute a new family of chloride channels mediating Ca2+-dependent Cl− currents. The present study examines the relationship between the hClCa1 protein and Ca2+-dependent Cl− currents using heterologous expression of hClCa1 in HEK293 and NCIH522 cell lines and whole cell recordings. By contrast to previous reports claiming the absence of Cl− currents in HEK293 cells, we find that HEK293 and NCIH522 cell lines express constitutive Ca2+-dependent Cl− currents and show that hClCa1 increases the amplitude of Ca2+-dependent Cl− currents in those cells. We further show that hClCa1 does not modify the permeability sequence but increases the Cl− conductance while decreasing the GSCN−/GCl− conductance ratio from ∼2–3 to ∼1. We use an Eyring rate theory (two barriers, one site channel) model and show that the effect of hClCa1 on the anionic channel can be simulated by its action on lowering the first and the second energy barriers. We conclude that hClCa1 does not form Ca2+-dependent Cl− channels per se or enhance the trafficking/insertion of constitutive channels in the HEK293 and NCIH522 expression systems. Rather, hClCa1 elevates the single channel conductance of endogenous Ca2+-dependent Cl− channels by lowering the energy barriers for ion translocation through the pore.
Three molecularly distinct Cl− channel families (CLC, CFTR, and ligand-gated GABA and glycine receptors) are well established whereas other gene families (ClCa) were also reported to encode Cl− channels but are less well characterized (Jentsch et al. 2002; Eggermont, 2004; Hartzell et al. 2005; Loewen & Forsyth, 2005). The human ClCa protein (hClCa1) is strongly up-regulated in mucus-producing epithelium of cystic fibrosis and asthmatic patients (Hoshino et al. 2002; Toda et al. 2002; Hauber et al. 2003, 2004), therefore generating great interest in its clinical relevance. The hClCla1 protein was initially proposed to be a Ca2+-dependent Cl− channel. Evidence for this came from its heterologous expression in a range of cellular systems, which resulted in membrane currents activated in Cl−-selective conditions and with high internal Ca2+ concentrations. Currents were also blocked with chloride channel blockers (Gandhi et al. 1998; Gruber et al. 1998). More recently, Gibson et al. (2005) expressed hCLCA1 in HEK293 cells and showed that hCLCA1 is constitutively secreted in the extracellular medium. The N-terminal cleavage products of hCLCA1 could also be detected in bronchoalveolar lavage fluid taken from asthmatic subjects demonstrating release from cells in a pathological setting (Gibson et al. 2005). A bioinformatics analysis did not support the notion of transmembrane domains, further indicating that hCLCA1 is a non-integral membrane protein and is not a chloride channel per se. So far, electrophysiological data do not distinguish between ClCa1 family members being modulators or ion channels themselves. Studies with pClCa1, the porcine ortholog of hClCa1, suggest that ClCa1 are chloride channel modulators that increase the amplitude of endogenous Ca2+-dependent Cl− currents (Loewen et al. 2002, 2003, 2004). Even in light of this evidence, questions still remain as to how members of the ClCa family are responsible for the increase of the amplitude of the chloride current. The present study seeks to shed new light on the relationship between the hClCa1 protein and the Ca2+-dependent Cl− channel by quantifying separate facets of the anion permeation process in cell lines expressing hClCla1. We found that HEK293 and NCIH522 cell lines express constitutive Ca2+-dependent chloride currents. When expressed in those two cell lines, hClCa1 increased the conductance of Ca2+-dependent Cl− currents while leaving the relative permeability of other anions unaffected. We used a rate theory analysis to develop a model that describes the alteration of anion selectivity in the presence of hClCa1 and showed that the increase of the Ca2+-dependent Cl− conductance in the presence of hClCa1 is due to its effect on the energy barriers that impact on the ion translocation event.
Methods
Cell culture
HEK293 and NCIH522 (a human lung epithelial adenocarcinoma cell line) were grown in Dulbecco's modified Eagle's medium (Sigma-Aldrich Company Ltd, Dorset, UK), supplemented with 10% heat-inactivated fetal bovine serum; 1% penicillin, streptomycin and glutamine; and 1% non-essential amino acids (all from Invitrogen Ltd, Paisley, UK). HEK293 cells stably expressing hClCA1 (HEK-hClCA1) were cultured in the presence of 0.8 mg ml−1 geneticin. Cells were maintained at 37°C in a humidified environment containing 5% CO2 and split twice a week using Versene (Invitrogen), a solution containing 0.2 g l−1 Na4-EDTA in phosphate-buffered saline for 6–7 min at 37°C.
Cell lines
For generation of the HEK293 clones stably expressing hClCa1, pCIN5-hClCa1 was transfected into HEK293 cells (American Type Culture Collection, Manassas, VA, USA). pCIN5_pl-hClCa1 DNA (0.8 μg) was transfected into HEK293 using the lipofectamine 2000 protocol (Invitrogen). Neomycin-resistant colonies of cells were subsequently isolated by ring cloning and expanded under G418 (Gibco-Invitrogen) selection at 800 μg ml−1, and hClCa1 protein expression was confirmed by immunocytochemistry and Western blotting techniques using the A48 antibody directed against hCLCA1 as described below.
Transient transfections
Cells were cultured the day before transfection and plated on coverslips to achieve ∼70–80% confluency within 24 h. Prior to transfection, cells were washed in serum-free Optimem medium (Gibco-Invitrogen). A first step consisted of adding the reagents (0.8 μg ml−1 pEGFP-N1 (BD Biosciences, Cat. no. 6085-1 (GenBank Accession no. U55762) with 7.2 μg ml−1 pcDNA3.1-hClCa1 or pcDNA3.1(+)) to Optimem, in a polypropylene tube and incubating the mixture for 10 min at room temperature. During the incubation period, 1% (v/v) lipofectamine was mixed to Optimem medium in another tube. A second step consisted of combining the contents of both tubes and incubating the final mixture at room temperature for an additional 20 min. Cells were transfected with this final mixture containing 0.4 μg ml−1 GFP and 3.6 μg ml−1 of either hClCa1 or pcDNA3.1(+) for a 12–18 h period at 37°C before binding and function were assessed.
Plasmids
pcDNA3.1-D-V5-His-TOPO-CACC1 (hClCa1)
pcDNA3.1(+) was purchased from Invitrogen. Nested PCR primers were designed either side of the CACC1 gene sequence (PubMed Accession no. AF127036). Two rounds of nested PCR were necessary to obtain product from the colon template. The insert contains the entire CACC1 gene (with a short Kozak sequence prior to the initiator (i.e. caccATG) and a stop codon followed by one further codon at the very end). The product also contains a single silent (Val–Val) PCR mutation (base 645 gtT–gtA) in the coding sequence.
pCIN5_pl-hClCa1
The hClCa1 gene from pcDNA3.1- D-V5-His-TOPO-CACC1 (hClCa1) was subcloned into the mammalian cell expression plasmid pCIN5_pl to give pCIN5_pl-hClCa1. This plasmid contained the cytomegalovirus promoter and an internal ribosome entry site which allowed bicistronic expression of both hClCa1 and neomycin. As no compatible restriction sites were available for sub-cloning, a compatible NotI site was engineered into the pcDNA3.1-D-V5-His-TOPO-CACC1 (hClCa1) plasmid by site-directed mutagenesis. A pair of mutagenic primer oligonucleotides complementary to the pcDNA3.1 vector was synthesised. The site-directed mutagenesis was carried out according to the manufacturer's protocol (QuikChange Site-Directed Mutagenesis Kit, Stratagene- Agilent Technologies, TX, USA). The ClCa gene was then subcloned into the pCIN5_pl vector using these NotI sites and restriction enzyme analysis allowed for successfully subcloned plasmids to be selected.
Immunocytochemical staining procedure
The A48 anti-hClCa1 antibody is a rabbit polyclonal antibody raised against the peptide sequence (GVNAARRRVIPQQSG), corresponding to amino acid residues 703–717 in hClCa1. Fluorescently tagged secondary antibodies were goat anti-rabbit IgG–Alexa568, and goat anti-rabbit IgG–Alexa488 (from Molecular Probes-Invitrogen). Live cell surface staining was carried out on cells grown on coverslips. Cells were incubated at 4°C for 15 min, in incubation buffer (Hank's balanced salt solution–1% bovine serum albumin–0.1% sodium azide). Primary antibody incubations were carried out in incubation buffer, for 20 min. Cells were washed twice and incubated with fluorescently tagged secondary antibodies, for 30 min. Cells were then washed, fixed in 2% paraformaldehyde, mounted and examined on a Leica TCS-4D confocal microscope (Leica Micosystem UK Ltd, Milton Keynes, UK). The A48 antibody was used at 1 μg.ml−1. The immunizing peptides were used as controls, to neutralize the antibodies, following a 15 min pre-incubation of antibody and peptide.
Western blot analysis
Cells were lysed in RIPA buffer (Upstate Biotech-Millipore UK Ltd, Watford, UK) containing 50 nm Tris-HCl, pH 7.4, 150 mm NaCl, 0.25% deoxycholic acid, 1% NP-40 and 1 mm EDTA. Each sample (10 μg) was run on NuPage 4–12% polyacrylamide Bis-Tris gels (Invitrogen). Proteins were electrophoretically transferred to nitrocellulose membranes (Invitrogen) Membranes were blocked in 5% non-fat milk and in Tris-buffered saline with 1% Tween 20 and probed with the affinity-purified antibody A48 used at 0.5 μg.ml−1. Following incubation with a horseradish peroxidase-conjugated anti-rabbit secondary antibody (Calbiochem–EMD Chemicals, Inc., NJ, USA), bands were visualised using enhanced chemiluminescence detection reagents (Amersham Biosciences, Buckinghamshire, UK).
Flow cytometry
HEK293 cells (5 × 10⁵) were washed in phosphatebuffered saline, containing 2.5% FCS and 0.05% sodium azide, incubated with 0.55 μg A48 antibody, or A48 and blocking peptide, for 10 min at room temperature. Cells were washed, incubated with anti-rabbit IgG-PE (Becton Dickinson Ltd, Plymouth, UK), at a dilution of 1: 50, for 10 min. Cells were washed, resuspended and immediately analysed on a Beckman Coulter EPICS XL-MCL FACS machine using EXPO32 ADC software (Beckman Coulter Ltd, High Wycombe, UK).
TaqMan real time reverse transcriptase polymerase chain reaction
TaqMan quantitative PCR was used to measure the mRNA expression levels for three hClCa protein subtypes (hClCa1, 2 or 4) and two housekeeping genes (β-actin and GAPDH).
Generation of samples for TaqMan mRNA analysis
Total RNA was prepared from up to 107 cells from selected human cell lines (HEK293 and NCIH522) using the SV96 Total RNA isolation System (Promega, Madison, WI, USA). The total RNA samples were quantitfied using the RiboGreen fluorescent method (Molecular Probes, Eugene, OR, USA). The absence of genomic DNA contamination of the RNA samples was confirmed using B-actin TaqMan PCR. RNA (2 μg) was reverse transcribed using the High Capacity cDNA Archive Kit according to manufacturer's instructions (Applied Biosystems, Foster City, CA, USA). Each cDNA prepared was diluted to a concentration of 10 ng.ul−1 and placed into two wells of a 384−well plate. Each well contained the cDNA produced from 20 ng total RNA from the appropriate cell line. All 384-well plates were stored at −80°C prior to use.
TaqMan PCR conditions
An 8 μl volume of a PCR mix (containing 1 μl TaqMan buffer, 2.4 μl 25 mm MgCl2, 0.2 μl of 10 mm dATP, 0.2 μl of 20 mm dUTP, 0.2 μl of 10 mm dCTP, 0.2 μl of 10 mm dGTP, 0.1 μl uracil-N-glycosylase, 0.4 μl of 10 μm forward primer, 0.4 μl of 10 μm reverse primer, 0.2 μl 5 μm fluorogenic TaqMan probe, 0.05 μl TaqGold (Applied Biosystems, Warrington, UK), 2.65 μl water) was added to each well using Biomek FX robotics (Beckman Coulter Ltd, High Wycombe, UK) and the plate was sealed using an Optical Adhesive Cover (Applied Biosystems, Warrington, UK). The PCR reaction was carried out on an ABI7900HT Sequence Detection System (Applied Biosystems, Warrington, UK) using the PCR parameters: 50°C for 2 min, 95°C for 10 min and 45 cycles of 95°C for 15 s, 60°C for 1 min. The level of mRNA-derived cDNA in each sample was calculated from the TaqMan signal using duplicate human genomic DNA calibration standards included in each. Table 1 describes the gene-specific reagents (forward primer, reverse primer and TaqMan probe).
Table 1.
Gene-specific primers/probes used for TaqMan RT-PCR analysis
| Gene | GenBank acc. no. | Primer | Sequence 5′–3′ |
|---|---|---|---|
| hClCa1 | NM_001285 | S | GATGTCCCAAATGCTCCCATAC |
| AS | CCCAGGAGCTGTCCAAGTCA | ||
| P | ATCTCTTCCCACCTGGCCAAATCACC | ||
| hClCa2 | NM_006536 | S | TCGGACAGCTAGTCTTTGGATTC |
| AS | TGATGGGTATTGTTCAGGGTGTAA | ||
| P | AGGAACAGCTAAGCCTGGGCACTGG | ||
| hClCa4 | NM_012128 | S | CTTGGAGGATTTCAGCCGAA |
| AS | AGGGAAGGCTTGGGACTTGT | ||
| P | AGCATCCGGAGGTGCATTTGTGGTA | ||
| B actin | X00351 | S | GAGCTACGAGCTGCCTGAACG |
| AS | GTAGTTTCGTGGATGCCACAGGACT | ||
| P | CATCACCATTGGCAATGAGCGGTTCC | ||
| GAPDH | XM006959 | S | CAAGGTCATCCATGACAACTTTG |
| AS | GGGCCATCCACAGTCTTCTG | ||
| P | AACACAGTCCATGCCATCACTGCCA |
S, sense forward primer; AS, antisense reverse primer; P, Taqman probe; n, nucleotide position relative to first ATG start codon of coding sequence. Primer and probe sequences were designed using Primer Express software (Version 2.0, Applied Biosystems) according to the manufacturer's guidelines. Each TaqMan probe was synthesised with the fluorescent reporter dye FAM (6-carboxy-fluorescein) attached to the 5′-end and a quencher dye TAMRA (6−carboxy-tetramethyl-rhodamine) to the 3′-end.
Patch clamp electrophysiology
Whole cell currents were recorded at room temperature (20–23°C) using an Axopatch 200B (Axon Instruments, Foster City, CA, USA). Data acquisition and analysis were performed via a Digidata 1320 interface (Axon Instruments) using pClamp 9 software (Axon Instruments). After formation of a gigaohm seal and establishment of whole cell access, cells were voltage clamped at −80 mV. Membrane capacitance was calculated from the integral of the current transient in response to 10 mV hyperpolarizing pulses. The series resistance did not exceed 10 MΩ and was compensated by 70–75%. Records were sampled at between 5–10 kHz and filtered at 1–2 kHz with a four-pole Bessel filter. Current–voltage relationships were examined using 600 ms voltage steps from a holding potential of −80 mV to potentials from −100 mV to +80 mV at 20 mV intervals. Ramp currents were examined from a holding potential of −80 mV to potentials from −100 mV to 100 mV over 1 s.
Solutions
Cultured cells plated on glass coverslips were transferred to the stage of an inverted microscope and superfused with an extracellular solution at a rate of 2–3 ml.min−1. Solutions changes were performed using a series of gravitionally fed tubes and valves.
Calcium-dependent chloride currents
The standard extracellular solution contained (in mm): NaCl (126), Hepes (10), sucrose (30), CaCl2 (2) and MgCl2 (2). The pH was set to 7.4 with NaOH. To quantify the chloride current, a Cl−-free external solution was used where gluconate replaced the Cl− in the standard external solution (using sodium gluconate, calcium gluconate and magnesium gluconate at the appropriate concentrations). In chloride substitution experiments described in Fig. 7, 126 mm external Cl− (Cl−o) was replaced by equimolar bromide (Br−), iodide (I−), thiocyanate (SCN−), isethionate (Ise−) or gluconate (Glc−). Patch pipettes (borosilicate glass) were pulled using a Sutter P-97 pipette puller (Instrument Company, Novato, CA, USA) and filled with a solution composed of (in mm): N-methyl-d-glucamine chloride (120), CaCl2 (4.36), MgCl2 (2), HEDTA (8) and Hepes (10), pH 7.1. We quantified the response at steady state by buffering and estimating the actual free intracellular concentration (as described in Kuruma & Hartzell, 2000). The concentration of free Ca2+ in this solution was calculated to be 10 μm using the software WinMAXC (v.2.05; Chris Patton, Stanford, CA, USA). In the experiments where different [Ca2+]i were used, the pipette solution contained: (a) 1.69 mm CaCl2 and 5 mm EGTA; (b) 3.95 mm CaCl2 and 5 mm EGTA; (c) 1.87 mm CaCl2 and 5 mm HEDTA; (d) 1.47 mm CaCl2 and 5 mm nitrilotriacetic acid (NTA); (e) 3.35 mm CaCl2 and 5 mm NTA to give a final free [Ca2+]i of: (a) 130 nm, (b) 1 μm, (c) 5 μm, (d) 100 μm and (e) 486 μm, respectively. Osmolarity was adjusted to 295 mosmol l–1 with sucrose. Currents elicited by 1 or 2 mm[Ca2+]i were recorded with a pipette solution described by Gruber et al. (1998) and Britton et al. (2002) that contained (in mm): NMDG-Cl (112), sucrose (30), Hepes (5), MgCl2 (2) and CaCl2 (1) or (2).
Figure 7. Relative anionic conductance and permeability in HEK293 and NCIH522 cells.

A, representative currents recorded in HEK293 wild type cells during a voltage ramp protocol from a holding potential of −80 mV to +100 mV in control condition (black) and after substituting chloride with thiocyanate (grey). B, representative currents recorded in the same conditions in HEK293 cells stably transfected with PCIN5-hClCa1. Dashed lines in both A and B represent the null value of the current. C–E, summary histograms of the anionic permeability ratios (left) and the conductance ratios (right) obtained in the different cell types (see below). The relative anionic permeability is calculated from the shift of the reversal potential measured after substituting chloride with thiocyanate (SCN), iodide (I), bromide (Br), isethionate (Iseth) and gluconate (Gluc). The conductance was determined by dividing the measured current at +80 mV by the difference between the membrane potential and the membrane at which there is zero current. The relative conductance is the ratio of the conductance values obtained in different anionic conditions. C is a summary of the anionic selectivity measured in HEK293 wild type, stably transfected with PCIN5 or stably transfected with PCIN5-hClCa1 (clones 4 and 8). D is a summary of the anionic selectivity measured in the same condition as described above in HEK293 cells transiently transfected with pcDNA3 or in HEK293 transiently transfected PCDNA3-hClCa1 (hClCa1). E is a summary of the anionic selectivity measured in the same condition as described above in NCIH522 cells transiently transfected with pcDNA3 or in NCIH522 transiently transfected PCDNA3-hClCa1 (hClCa1).
Data analysis
Rectification ratios were calculated as the current amplitude at +80 mV divided by the current amplitude at −80 mV.
Permeability ratios were calculated using the Goldman–Hodgkin–Katz equation as follows:
where ΔErev is the measured shift in zero current (reversal) potential after Cl0 is replaced with the substitute ion subo, [Cl]′0 is the bath concentration of Cl, [Cl]0 is the residual Cl in the substituted solution, [sub]0 is the concentration of the substitute ion and R, T, z and F are the universal gas constant, the absolute temperature, the valency and the Faraday constant, respectively.
Conductance (g) was calculated as follows:
where Em is the membrane voltage, I the measured current and Erev the zero current potential. The conductance was estimated at a stepping potential of +80 mV and the conductance of an anion X relative to that of Cl− ( ) was estimated as the conductance ratio under bi-anionic conditions.
Concentration–response curves relating the free internal calcium [free Ca2+]i to the activation of the chloride current were fitted in Origin 5.0 software, according to a non-linear logistic function as follows:
where x0 (EC50) is the mid-dose effect, p is the slope, A1 and A2 are the predicted responses to a 0 and an infinite [free Ca2+], respectively. Fit estimates were calculated using the least square algorithm.
Statistics
All data are means ±s.d. of n individual cells. A Student's t test was used to compare data and results were considered significant when P < 0.05.
Modelling channel permeation
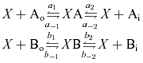
The channel was modelled assuming a single binding site, X, that could be either empty or occupied by a single ion. Thus, in the presence of two permeant ions, A and B, the following scheme indicates the transitions considered, where the rates are represented by lower case letters and the subscripts o and i indicate external and internal, respectively:
 |
At equilibrium, d(XA)/dt= 0 and d(XB)/dt= 0, thus:
Furthermore,
where PX denotes the probability of being in state X (unoccupied binding site) and so on. By solving these simultaneous equations, expressions for the probabilities, PX, PXA and PXB in terms of the rates can be derived. The net flux of ions A and B, JA and JB, respectively, are then obtained from the difference in the absolute transition rates for efflux and influx:
The current carried by ion A is given by iA=zeJA where e is 1.6 × 10⁻¹⁹ C. A similar argument is used for ion B and the total current will therefore be iT=iA+iB.
To calculate the rates, we used a rate theory model (Glässtone et al. 1941; Davies et al. 1996) in which the channel has two energy barriers and a single well or binding site able to accommodate a monovalent anion. For simplicity we distributed the barriers and binding site equally within the voltage field (see Scheme 1).

Scheme 1
The schematic representation of the energy profiles for ion A (continuous line) and ion B (dashed line) in a channel with two barriers (energy levels G12 and G23, where G denotes Gibbs free energy) and one well (binding site, G2). The abscissa represents the positions of the barriers and well within the voltage field of the membrane, which, in our calculations, have been distributed equally, such that δ1, δ2, δ3 and δ4 = 0.25. The ordinate represents the difference in free energy levels (ΔG) in RT units relative to those in the bulk solution. The well can only be occupied by one ion at a time.
An ion traversing from outside of the membrane to the inside must first ‘hop’ over barrier G1 to occupy the binding site and then ‘hop’ over barrier G23 to reach the inside. The general rate constant, k(V), for an ion hopping from one state to another is related to the energy difference between the two states, G(V), by:
where v=kBT/hkB is Boltzmann's constant, h is Planck's constant so v has the dimensions of transitions per unit time. When calculating G(V) an electrical term associated with an ion of valence z moving through a voltage field needs to be included to the zero voltage energy difference G(0). The direction of flow is important with the outward flow resulting in addition of the electrical component and inward flow to subtraction. Thus:
Here δ is the proportion of the voltage field (electrical distance) travelled by the ion for a particular jump and z is the valence of the ion. If the values of the energy levels are in RT units then the rates for ion A moving from outside to inside will be given by:
where R,T and F have their usual thermodynamic meanings.
Results
Detection of hClCal mRNA
We screened for the presence of the hClCa1 gene in different HEK293 clones stably transfected with pCIN5_pl-hClCa1 DNA using a highly sensitive and quantitative PCR approach and proceeded to a quantitative analysis of the hClCa1 gene in those cell lines. Figure 1A shows that hClCa1 gene expression is detected at different levels within different HEK293 clones stably transfected with pCIN5_pl-hClCa1 DNA, ranging from 1.4 × 10⁶ to over 10.5 × 10⁶ copies of mRNA detected per 50 ng−1 mRNA pool for clone 6 and 4, respectively. By comparison, the hClCa1 gene is undetected in HEK293 wild type and in HEK293 stably transfected with the pCIN5 vector with less than 1 × 10³ copies of mRNA detected per 50 ng mRNA pool. The quantitative analysis of hClCa2 and hClCa4 mRNAs was also performed in the same cell types and showed that by contrast to hClCa1 specifically expressed at high levels in HEK293 clones stably transfected with pCIN5_pl-hCLCA1 DNA, hClCa4 and hClCa2 mRNA was undetected in those cells, with less than 1 × 10³ and 4 × 10³ copies of mRNA per 50 ng−1 mRNA pool for hClCa4 and hClCa2, respectively. Those low expression levels are significantly different from control β actin and GAPDH genes ranging from 0.5 × 10⁶ to over 2 × 10⁶ copies of mRNA detected per 50 ng−1 mRNA pool (Fig. 1B–D). Similar experiments have also been performed in NCIH522 or HEK293 transiently transfected with GFP and pcDNA3.1(+)-hClCa1 in which we confirmed the presence of the hClCa1 (see Fig. 6A for NCIH522).
Figure 1. Taqman quantitative PCR analysis of ClCa mRNA protein subtypes in HEK293 cells.

The mRNA is extracted from HEK293 wild type (WT) and HEK293 cells stably expressing PCIN5 (PCIN5) or pCIN5-hCCla1 (clonal cultures C2 to C8). Quantitative PCR analysis was performed for A, hClCa1; B, hClCa2; C, β actin; D, GAPDH.
Figure 6. Characterisation of calcium-dependent chloride currents recorded from NCIH522 cells transiently transfected with hClCa1.

A, Taqman quantitative PCR analysis of hClCa1, β actin and GAPDH, performed after mRNA extraction from NCIH522 cells transienly transfected with the vector pcDNA3 (open bars) or with pcDNA3-hClCa1 (filled bars). B, immunofluorescence light microscopy showing that A48 is labelling the surface of cells (arrows pointing to the labelling at the level of the membrane) transfected with green fluorescent protein-pcDNA3-hClCa1 (cytoplasmic labelling). Co-labelling is always observed (stars in right panel). C, representative whole cell currents from a NCIH522 cell transiently transfected with pcDNA3, recorded during voltage steps from −100 mV to +80 mV (holding potential of −80 mV, 20 mV step). D represents the I–V relationship of the currents measured in C at the beginning of the step (•), at the end of the step (○) and after substituting chloride with gluconate (▾). E, representative whole cell currents from a NCIH522 cell transiently transfected with pcDNA3-hClCa1, recorded in the same conditions as in C. F represents the I–V relationship of the currents measured in E at the beginning of the step (•), at the end of the step (○) and after substituting chloride with gluconate (▾). Note that the circles are superimposed. Note the difference in the amplitude scale bar between C and E and between D and F. G, summary histograms representing the density of chloride currents recorded at +80 mV in different conditions. The first column represents the density of chloride currents in wild type NCIH522 cells (internal free calcium concentration of 10 μm). The second column represents the current density in wild type NCIH522 cells recorded with an internal free calcium concentration of 130 nm. Note the presence of a small background current when cells are recorded in the presence of 10 μm internal free calcium concentration. Columns 3 and 4 represent currents obtained in NCIH522 cells transfected with the vector pcDNA3 and with pcDNA3-hClCa1, respectively (both conditions with internal free calcium concentration of 10 μm). Note that the presence of hClCa1 increases the density of the chloride current. Column 5 represents the density of the chloride current in NCIH522 cells that were incubated with pcDNA3-hClCa1 but stayed untransfected (unlabelled, recorded internal free calcium concentration of 10 μm). Column 6 represents the density of the chloride current obtained in NCIH522 cells transfected with pcDNA3-hClCa1 and recorded at an internal free calcium concentration of 130 nm. H, percentage of block of the chloride current by 300 μm DIDS, 300 μm SITS and 100 μm niflumic acic. Current was recorded at +80 mV from a holding potential of −80 mV in untransfected NCIH522 cells (open bars), NCIH522 transfected with pcDNA3.1 and NCIH522 transfected with pcDNA3.1-hClCa1.
Immunological detection of hClCa1
We used the flow cytometry technique to quantify the fluorescent labelling of hClCa1 on various clones of HEK-hClCa1 (Fig. 2). Whereas the labelling linked to wild type HEK293 (HEK293-WT) and HEK293 stably transfected with the pCIN5 vector was distributed around a single peak of low background fluorescence (Fig. 2A), clones of HEK293 cells transfected with hClCa1 were all emitting a higher level of fluorescence (Fig. 2B–D) with a variation in the fluorescence intensity and the number of labelled cells as summarized in Fig. 2E. Immunofluorescence labelling was absent when HEK-hClCa1 cells were previously treated with the antibody A48 blocking peptide, consistent with the neutralization of the A48 antibody by the blocking peptide (shown for clones 4 and 8 in Fig. 2C–D). Two HEK293 clones stably transfected with pCIN5_pl-hClCa1 DNA (HEK-hClCa1 clones 4 and 8) were fractionated and examined by Western blot with the A48 antibody (Gibson et al. 2005, Fig. 3A). Both HEK-hClCa1 clones were found to contain both the full-length protein (125 kDa) and the N-terminal cleavage product of hClCa1 of 83 kDa or 90 kDa described in previous reports (Gruber et al. 1998; Gibson et al. 2005). Immunofluorescent labelling of hClCa1 using the A48 antibody revealed that hClCa1 was expressed at the cell surface of non-permeabilized HEK-hClCa1 clones 4 and 8 (Fig. 3B) or of NCIH522 cells (Fig. 6B). In this latter case, as expected, the A48 cell surface labelling also coincided with the green GFP-pcDNA3.1(+) hClCa1 cytoplasmic labelling. Electrophysiological studies were conducted on HEK-hClCa1 clones 4 and 8 in which 99% and 97% of cells, respectively, were labelled with the A48 antibody (Fig. 2E).
Figure 2. Flow cytometry quantitative analysis of the A48 fluorescent labelling.

Distribution of the fluorescence intensity from A, HEK293 cells stably transfected with pCIN5 and HEK 293 wild type. B, HEK293 cells stably transfected with pCIN5-hClCa1 clones 2, 3, 6 and 7. C, HEK293 cells stably transfected with pCIN5-hClCa1 clones 4 in control condition and in presence of the A48 blocking peptide. D, HEK293 cells stably transfected with pCIN5-hClCa1 clone 8 in control condition and in presence of the A48 blocking peptide. E, summary histograms showing the intensity of the A48 labelling in the different HEK293 populations in the absence and the presence of the blocking peptide. For each condition the percentage of labelled cells is in parentheses.
Figure 3. Western blot analysis and immunofluorescent labelling of hClCa1 with the A48 antibody.

A, fractionated HEK293 cells were examined by Western blot and probed with anti-hCLCA1 antibody (A48) to show the labelling of hClCa1 in HEK293 cells stably expressing pCIN5-hCCla1 (clones 4 and 8, lanes 3 and 4, respectively) by opposition to HEK293 wild type (WT) and HEK293 cells stably expressing PCIN5 (PCIN5) (lanes 1 and 2, respectively). Lanes 5 to 8 represent the negative control conditions (i.e. with the blocking peptide) for lanes 1 to 4, respectively. B, immunofluorescence light microscopy showing that the A48 is labelling the cell surface of HEK293 cells stably expressing pCIN5-hCCla1 (clones 4 and 8) as opposed to HEK293 wild type (WT) and HEK293 cells stably expressing PCIN5 (PCIN5). No labelling is observed when pre-incubating HEK293 cells stably expressing pCIN5-hCCla1 clone 4 with the blocking peptide.
Presence of Ca2+-sensitive chloride currents in HEK293 and NCIH522 cells
Before studying potential effects of hClCa1 on chloride currents in HEK293 or NCIH522 cells, we checked whether those cells displayed chloride currents in the absence of hClCa1. Intensity–voltage curves following step or ramp stimulations showed outwardly rectifying currents recorded from either wild type, vector or hClCa1 transfected HEK293 cells (Fig. 4C and G) with a rectification ratio at around 2 (see Table 2 for summary). This was similar to the intensity–voltage curves described in HEK293 cells transfected with mouse ClCa1 (Gandhi et al. 1998). By stepping to +80 mV, a fast decaying current with a time constant of around 100–200 ms was first observed. Eighty to ninety per cent of the remaining recorded current was steady state after a 1 s step (Fig. 4A and E). Currents reversed at a potential close to the theoretical chloride equilibrium potential of 0 mV (Table 2) and were abolished when external chloride was replaced with an equimolar concentration of impermeant anion gluconate (Fig. 4B and F). In this latter case, the mean reversal potential shifted to positive potentials exceeding 25 mV consistent with chloride currents. Chloride currents were inhibited by 300 μm DIDS, 300 μm SITS and 100 μm niflumic acic (Table 2). We tested whether chloride currents were dependent on the internal free calcium concentration. Figure 5B shows that chloride currents were dependent on varying the internal free calcium concentration from 130 nm to 486 μm. EC50 values of 21 μm and 7 μm were obtained for HEK293 wild type and PCIN5 vector transfected cells, respectively, whilst values for HEK293 hClCa1 clones 4 and 8 were slightly lower (2 μm and 3 μm, respectively). In previous studies on HEK293 cells (Gandhi et al. 1998; Gruber et al. 1998, 1999), Ca2+-dependent chloride currents required a high concentration of Ca2+ (1–2 mm) for activation. When we used 1 mm Ca2+ in our intracellular medium (similar to Gandhi et al. 1998; Gruber et al. 1998, 1999), the quality of the whole cell recordings became critical after a few minutes of recording, indicating a disrupted membrane. Altogether, results indicate that all HEK293 cells, whether transfected or not with hClCa1, display Ca2+-sensitive chloride currents with the internal free calcium concentration from 130 nm to 486 μm. Similar outwardly rectifying Ca2+-sensitive chloride currents were recorded in NCIH522 (Fig. 6C–H) or in HEK293 (not shown) that were transiently transfected with either pcDNA3(+) or hClCa1.
Figure 4. Whole cell recording of chloride currents in HEK293 cells.

A–D in HEK293 cells stably transfected with PCIN5 and E–H in HEK293 cells stably transfected with PCIN5-hClCa1. A and E are representative whole cell currents in control conditions from a holding potential of –80 mV to 80 mV (20 mV steps). The first step is a hyperpolarising step to −100 mV. B and F represent similar currents recorded after substituting external chloride with external gluconate. C and G represent the I–V relationship of the currents measured at the beginning of the step (▿), at the end of the step (•) and after substituting chloride with gluconate (○). D and H are representative currents recorded during voltage ramp protocols from a holding potential of −80 mV to +100 mV in control condition (black), after substituting chloride with gluconate (arrow) and after perfusion of 300 μm DIDS (grey). Note the difference in the amplitude scale bar between A and E, between C and G and between D and H.
Table 2.
Similar properties of the calcium-dependent chloride current in HEK293 wild type and in HEK293 cells stably transfected with either PCIN5 or with PCIN5-hClCa1 (clones 4 and 8)
| HEK-WT | HEK-PCIN5 | HEK-PCIN5-hClCa1 clone 4 | HEK-PCIN5-hClCa1 clone 8 | |
|---|---|---|---|---|
| % rectification | 2.2 ± 2.8 (9) | 2.1 ± 3.1 (7) | 1.9 ± 2.7 (9) | 2.2 ± 1.9 (9) |
| I steady state (%) | 87 ± 11 (9) | 78 ± 15 (7) | 89 ± 5 (9) | 90 ± 75 (9) |
| Tau I transient (ms) | 141 ± 49 (5) | 118 ± 103 (7) | 100 ± 85 (5) | 180 ± 170 (4) |
| Erev (mV) | –1 ± 10 (8) | 4 ± 8 (9) | 2 ± 7 (8) | 3 ± 8 (8) |
| % block (DIDS) | 94 ± 14 (6) | 90 ± 9 (8) | 98 ± 3 (5) | 99 ± 1 (4) |
| % block (SITS) | 65 ± 27 (4) | 44 ± 18 (7) | 48 ± 28 (6) | 41 ± 18 (6) |
| % block (Nif. acid) | 36 ± 19 (4) | 31 ± 12 (8) | 35 ± 12 (5) | 42 ± 23 (5) |
The rectification was estimated as the current recorded at +80 mV divided by the current at −80 mV. The steady state current was calculated as the proportion of remaining current recorded at the end of a 5 s pulse from −80 mV to +80 mV and the value of the decay was determined by fitting the transient current at the start of the pulse. The percentage of block by 300 μm DIDS, 300 μm SITS and 100 μm niflumic acid was calculated at +80 mV. Values are mean ±s.d. (n, numbers).
Figure 5. Density and calcium dependency of chloride currents in HEK293 cells.

A, density of chloride currents recorded at a potential of +80 mV in HEK293 wild type (WT) and in HEK293 stably transfected with PCIN5 or with pCIN5-hClCa1 clones 2, 3, and 4–8. The internal free calcium concentration was set at 10 μm. Symbols represent individual values obtained for each cells. Crosses and dotted arrows represent the mean and the standard deviation, respectively, besides each condition. B, density of chloride currents recorded at +80 mV in function of varying internal free calcium concentration (in the pipette) in HEK293 wild type (WT, □), in HEK293 cells stably transfected with PCIN5 (○) or with pCIN5-hClCa1 clone 4 (♦) and clone 8 (▪). Values were fitted according to a non-linear logistic function (see Methods).
hClCa1 increases the amplitude of Ca2+-sensitive chloride currents
Whereas an equimolar substitution of gluconate abolished the outwardly rectifying chloride current, the inward current due to the exit of chloride stayed unaffected. This is reflected by the small effect of gluconate substitution on the holding current recorded at −80 mV (Fig. 4D and H). We used the ability of gluconate to substitute for external chloride in a quick and reversible manner to quantify the density of chloride currents at +80 mV in both HEK293 and NCIH522 cells. We found that hClCa1 was associated with an increase in the amplitude of the Ca2+-sensitive chloride HEK293 cells from 118 ± 91 pA (n= 21) to 1033 ± 861 pA (n= 13, clone 4, P= 0.0018). Examples are given in Fig. 4E; Fig. 6E and results normalised to the cell capacitance are summarised in Figs 5A and 6G for HEK293 and NCIH522, respectively). Figure 5A shows that HEK293 wild type and HEK293 transfected with the PCIN5 vector express chloride currents at a density of 7 ± 10 pA.pF−1 (n= 21) and 9 ± 13 pA.pF−1 (n= 8), respectively, while HEK293 clones transfected with hClCa1 express chloride currents at 5 to 10 times higher current density. Density of chloride currents recorded in hClCa1 clones 4 and 8 were 81 ± 46 pA.pF−1 (n= 13) and 117 pA.pF−1± 66 (n= 14), respectively. Figure 6G shows that untransfected (or wild type) NCIH522, pcDNA3.1 transfected NCIH522 and non-hClCa1 transfected NCIH522 all express a similar low density of chloride currents of about 5 pA.pF−1 whereas a 5 times higher density of chloride currents of 26 ± 15 pA.pF−1 can be observed in NCIH522 transfected with hClCa1.
hClCa1 affects the relative conductance between thiocyanate and chloride
To gain an insight into the anion selectivity of hClCa1 extracellular chloride, Cl− was replaced with various anions (bi-ionic condition, Fig. 7), using thiocyanate (SCN−), iodide (I−), bromide (Br−), isethionate and gluconate (Gluc−). In Fig. 7A and B, a ramp pulse protocol was applied in the presence of chloride and thiocyanate and the reversal potential of the currents was calculated to determine the relative permeability of the tested anions (Fig. 7C–E). Replacing external Cl− with SCN−, I−, Br−, isethionate and Gluc− induced a shift of the reversal potential which led to a permeability sequence of PSCN− > PCl− > PBr−=PI− > Pisethionate≥PGluc−. This was the case whether HEK293 or NCIH522 cells were transfected or untransfected with hClCa1 (Fig. 7C–E, left). Anionic conductance was then estimated from the chord conductance between +80 mV and the reversal potential (Fig. 7C–E, right) leading to an anionic conductance sequence of GSCN− > GCl−=GI−=GBr− > Gisethionate > GGluc− in hClCa1 untransfected cells. When HEK293 cells were stably transfected with hClCa1, the conductance carried by the Cl− ion was increased from 1.4 ± 1.2 nS (n= 11) and 1.5 ± 1.47 nS (n= 10) in HEK293 wild type and HEK293-PCIN5, respectively, to 3.4 ± 2.2 nS (n= 8) and 4.5 ± 3.3 nS (n= 12) for HEK293-PCIN5-hClCa1 clone 4 and HEK293-PCIN5-hClCa1 clone 8, respectively. This is in accordance with an increased chloride current in the presence of hClCa1, as observed in Fig. 4 or in Fig. 6. The main effect of hClCa1 is described in Fig. 7B, showing similar current amplitudes in the presence of SCN− or Cl−, leading to GCl− that equals GSCN− and to a conductance sequence of GSCN−=GCl−=GI−=GBr− > Gisethionate > GGluc− (Fig. 7C–E right).
hClCa1 affects chloride channel energy barriers
The increase in chloride current magnitude observed with hClCa1 expression could result from an increase in the number of open channels (NPopen), an increase in single channel amplitude (i) or conductance (g) or a combination of both. A decrease of the whole cell conductance ratio GSCN−/GCl− suggests that hClCa1 expression affects the relative single channel conductance ratio gSCN−/gCl−. To gain insight into possible changes in the pore induced by hClCa1, we modelled the pore with a single binding site (see Methods for details) and obtained fits to whole cell I–V curves obtained with 126 mm of either Cl− or SCN− in the external solution and 130 mm Cl− in the pipette (Fig. 8). Energy profiles for both Cl− and SCN− were fitted simultaneously using the solver function in Microsoft Excel to minimize the sum of the squared difference between data and fit. During this procedure the values of the energy levels G12, G2 and G23 for Cl− and SCN− were free to alter as was the number of open channels (NPopen). As seen in Fig. 8, this single site model fitted the data adequately in the presence or absence of hClCa1 expression in either HEK 293 or NCIH522 cells. It was clear, however, that to obtain an adequate fit to the data it was necessary to alter the energy barriers, as simply scaling the current by altering the number of open channels depending on the presence or absence of hClCa1 was inadequate (see dashed lines in Fig. 8). The single channel conductance (estimated as the average slope conductance) in 126 mm Cl− was 3.7 pS in the HEK 293 stable cell line and this increased to 11.2 pS in the presence of hClCa1 (Table 3). Similar results were obtained with transient transfection using pcDNA3.1 (Table 4). This increased conductance in the presence of hClCa1 was mainly reflected by a decrease in the value of G12, the external energy barrier, for Cl−, which also accounted for the change in the conductance ratio (GSCN−/GCl−) observed. Even though NPopen was free to change during the fitting routine, the value returned was remarkably consistent irrespective of the presence of hClCa1.
Figure 8. Current–voltage relationships fitted with a one energy well and two barriers model.

A–E, typical current–voltage relationships recorded from the different cell types in presence of 135 mm external Cl− (black circles) or 135 mm SCN− (grey squares). Cell types are mentioned above each I–V curves. Continuous lines represent the fit through the data with the values of the energy levels G12, G2 and G23 for Cl− and SCN− free to alter and the number of open channels free to alter. Dashed lines in A, C and E represent the same fit by scaling the continuous line current and multiplying the number of open channels by a factor of 2 to 4. Individual values obtained were for: A: N = 242, g = 3.5 pS; with Cl−: G12 6.5 RT, G2–4 RT, G23 6.9; with SCN−: G12 5.6 RT, G2 –6.0 RT, G23 6.6. Dashed line represents the fit with N× 4 fixed; for B: N = 231, g = 30 pS; with Cl−: G12 4.1 RT, G2 –5.8 RT, G23 5.0 RT; with SCN−: G12 4.3 RT, G2 –5.0 RT, G23 3.7 RT; for C: N = 263, g = 1.8 pS; with Cl−: G12 5.7 RT, G2 –10.5 RT, G23 5.0 RT; with SCN−: G12 5.3 RT, G2 –11.9.0 RT, G23 3.2 RT. Dashed line represents the fit with N× 3 fixed; for D: N = 239, g = 10.5 pS; with Cl−: G12 4.7 RT, G2 –5.8 RT, G23 6.9 RT; with SCN−: G12 3.8 RT, G2 –8.2 RT, G23 6.1 RT; for E: N = 242, g = 3.1 pS; with Cl−: G12 6.3 RT, G2 –7.5 RT, G23 7.0 RT; with SCN−: G12 5.9 RT, G2 –6.0 RT, G23 6.0 RT. Dashed line represents the fit with N× 2 fixed; for F: N = 236, g = 12.7 pS; with Cl−: G12 5.2 RT, G2 –4.7 RT, G23 5.8 RT; with SCN−: G12 5.1 RT, G2 –8.0 RT, G23 5.1 RT.
Table 3.
Energy barriers estimated from a single energy barrier model in the presence and absence of hClCa1 in HEK293 stable cell lines
| HEK293-WT HEK-PCIN5 | HEK293-hClCa1 C4,C8 | P | ||
|---|---|---|---|---|
| Cl− | G12 | 6.7 ± 0.7 | 5.34 ± 0.4 | 0.002 |
| G2 | −7.8 ± 3.4 | −5.3 ± 4.7 | 0.31 | |
| G23 | 2.1 ± 2.3 | 3.7 ± 2.9 | 0.32 | |
| SCN− | G12 | 4.3 ± 1.8 | 2.6 ± 1.9 | 0.15 |
| G23 | −9.4 ± 2.0 | −8.1 ± 1.9 | 0.48 | |
| G3 | 5.2 ± 2.3 | 4.6 ± 1.6 | 0.58 | |
| N | 398 ± 14.1 | 389 ± 11.6 | 0.24 | |
| g (pS) | 3.7 ± 1.9 | 11.2 ± 4.8 | 0.0003 |
Data are mean ±s.d. (n= 6) for each column. Left column comprises the data obtained in HEK293-WT and HEK293 stably transfected with PCIN5 whereas the column on the right shows values obtained from HEK293 stably transfected with PCIN5-hClCa1 (clones 4 and 8). G are in RT units whereas N represents the total numbers of channels × opening probability. g represents the conductance in pS. P values are obtained from a Student's t test.
Table 4.
Energy barriers estimated from a single energy barrier model in the presence and absence of hClCa1 in transiently transfected HEK293 and NCIH522
| HEK293,NCIH522-pcDNA3.1 | HEK293,NCIH522-hClCa1 C4, C8 | P | ||
|---|---|---|---|---|
| Cl− | G12 | 6.2 ± 0.8 | 4.8. ± 1.0 | 0.01 |
| G2 | −8.4 ± 2.6 | −4.8 ± 3.0 | 0.04 | |
| G23 | 4.2 ± 3.4 | 5.9 ± 0.7 | 0.21 | |
| SCN− | G12 | 4.6 ± 2.3 | 3.7 ± 1.4 | 0.38 |
| G23 | −6.7 ± 4.9 | −6.8 ± 2.3 | 0.94 | |
| G3 | 5.0 ± 1.9 | 5.3 ± 1.0 | 0.7 | |
| N | 245 ± 14.4 | 237 ± 5.0 | 0.24 | |
| g (pS) | 2.8 ± 1.3 | 10.0 ± 2.3 | 0.0001 |
Data are mean ±s.d. (n= 6) for each column. Left column comprises the data obtained in HEK293 and NCIH522 transiently with pcDNA3.1(+) whereas the column on the right shows values obtained from HEK293 and NCIH522 transiently transfected with pcDNA3.1(+)-hClCa1 (clones 4 and 8). G are in RT units whereas N represents the total numbers of channels × opening probability. g represents the conductance in pS. P values are obtained from a Student's t test.
Discussion
In the present study, RT-PCR techniques and immunocytochemistry labelling using the specific A48 antibody (Gibson et al. 2005) were used to investigate the expression of hClCa1 in HEK293 and NCIH522, cell types that have not been shown to express ClCa isoforms. We proceeded to a functional characterisation of hClCa1 in HEK293 stable cell lines expressing hClCa1 as well as in HEK293 and NCIH522 cells transiently expressing hClCa1, and accumulated evidence that hClCa1 does not constitute an independent channel but is a Ca2+-dependent chloride channel modulator, lowering energy barriers of the channel.
Properties of the calcium-dependent chloride currents in HEK293 and NCIH522
Species-dependent isoforms of ClCa gene products have been described in HEK293 cells (Gandhi et al. 1998; Gruber et al. 1998, 1999). In all those cases, the expressed current reversed close to 0 mV, exhibited some outward rectification but no time-dependent kinetics. Similarly, we showed that Ca2+-dependent chloride currents upregulated in HEK293 and NCIH522 cells reversed close to 0 mV, exhibited some outward rectification and mainly time-independent kinetics. On step-like depolarisations, the instantaneous current was not followed by an outward relaxation similar to other studies performed on HEK293 cells (Gandhi et al. 1998; Gruber et al. 1998, 1999; Greenwood et al. 2002) and this is in contrast to various cell types including smooth muscle, secretory and epithelial cells chloride currents that exhibit distinctive voltage- and time-dependent characteristics (Large & Wang, 1996; Frings et al. 2000). It is possible that auxiliary subunits are required to exhibit distinctive voltage-dependent kinetics characteristic of native Ca2+-dependent chloride currents as suggested for the BK β subunit that can associate and modulate mClCA1 to get a Ca2+ sensitivity more typical of the native currents in smooth muscle cells (Greenwood et al. 2002). In previous studies on HEK293 cells (Gandhi et al. 1998; Gruber et al. 1998, 1999), Ca2+-dependent chloride currents required a high concentration of Ca2+ (2 mm) for activation. In our experimental conditions, Ca2+-dependent chloride currents upregulated by hClCa1 were activated by a lower concentration of Ca2+ (over 150 nm) which is close to the 100 nm threshold of activation of outwardly rectifying Ca2+-dependent chloride currents in lacrimal acinar cells (Evans & Marty, 1986) or in various cell types including smooth muscles (Large & Wang, 1996; Wang et al. 1997), cardiac myocytes (Collier et al. 1996) or endothelial cells (Nilius et al. 1997) and is also near the resting level of Ca2+ in secretory epithelia (Kidd & Thorn, 2000). Ca2+-dependent chloride currents showed a non-linear dependence of the current relative to the free Ca2+ concentration suggesting that the mechanisms of calcium-dependent chloride channel activation could involve the binding of multiple Ca2+ ions to the channels or to unknown accessory proteins. In lacrimal acinar cells, the EC50 of Ca2+ dependence was ∼1 μm (Evans & Marty, 1986) and our EC50 values in the micromolar range are also in agreement with this figure. In our experiments, the Ca2+ concentration was maintained at 10 μm which is ∼2–3 times the Kd of the channel for Ca2+ in Xenopus oocytes (Kuruma & Hartzell, 2000).
Effect of Cl− channel blockers
Ion channel blockers have been used extensively as tools for the identification of Ca2+-dependent chloride currents. Unfortunately, most of the known Cl− channel blockers are neither selective nor potent (Greenwood & Leblanc, 2007). Commonly used stillbene disulphonate and niflumic acid display inhibitory effects on various cell types (Greenwood & Leblanc, 2007) and we found that, similar to previous reports (Gandhi et al. 1998; Gruber et al. 1998), DIDS blocked the current by about 90% in the absence and presence of hClCa1. DIDS also exerted a more potent block at positive potentials consistent with the voltage dependency of the blocking effect reported in previous studies (Nilius et al. 1997; Kim et al. 2003). Niflumic acid (100 μm) was a relatively weak blocker in HEK293 and NCIH522 cells even at positive potentials. This differs from previous studies (Gandhi et al. 1998; Gruber et al. 1998) showing that niflumic acid abolished the calcium-dependent chloride current in HEK293 cells. One reason for this difference could be the intracellular calcium concentration. Whereas we used 10 μm Ca2+ concentration, previous studies used 2 mm Ca2+ inside the recording pipette. We did not observe complicated effects of niflumic acid like those reported in vascular smooth muscle where niflumic acid inhibits the calcium-dependent chloride current at positive potentials whilst increasing it at negative potentials (Piper et al. 2002).
hClCa1 is a Ca2+-dependent chloride current modulator
hClCa1 has originally been suggested to be an ion channel of the calcium-dependent chloride channel family (Gandhi et al. 1998; Gruber et al. 1998). Later observations showed that hClCa1, as well as cleavage products of mClCa3, the murine homolog of hClCa1, are non-integral membrane proteins released into the medium. In their studies, the authors conclude that hClCa1 cannot form an anion channel on its own (Gibson et al. 2005; Mundhenk et al. 2006). Furthermore, bioinformatics analyses do not predict the presence of any transmembrane domains and thus hClCa1 is unlikely to be an ion channel per se. In their initial study, Gruber et al. (1998) have shown that transient expression of hClCa1 in HEK293 cells increased the Ca2+-activated whole cell currents by a factor of 5, producing a time-independent outwardly rectifying current. As there was no mention of endogenous HEK293 channels that could be responsible for a background current mediated by non-selective anion currents, the conclusion was drawn towards hClCa1 being an ion channel itself. By opposition to Gruber et al. (1998), we have shown that both HEK 293 and NCIH522 cell lines express, in the absence of hClCla1, a small (i.e. about 5 pA.pF−1) calcium-dependent chloride current with 10 μm free internal calcium. In both cell lines, Ca2+-dependent Cl− currents were outwardly rectifying, time independent and inhibited by DIDS, SITS and niflumic acid, similarly to currents described by Gruber et al. 1998 when hClCa1 was expressed in HEK293 cells.
Our study shows that the expression of hClCa1 upregulates similar types of calcium-dependent chloride channel activity in transiently transfected HEK 293, NCIH522 cells or in clonal cultures of HEK293 cells expressing constitutively hClCa1 thereby confirming the observation of Gruber et al. (1998)) that the expression of hClCa1 greatly increased time-independent, outwardly rectifying Ca2+-dependent Cl− currents. Differences in the amplitudes of the Ca2+-activated Cl− currents are highly significant (i.e. by a factor of 10 to 20, leading to currents in the nanoamp range) when hClCa1 is expressed. The presence of Ca2+-activated Cl− channels prior to transfection suggests that hClCa1 is not encoding for novel Ca2+-dependent Cl− channels but rather modulates the amplitude of pre-existing Ca2+-dependent Cl− channels of similar biophysical and pharmacological properties. CLC-3 and bestrophin gene expression also cause the appearance of Ca2+-dependent Cl− currents that lack the typical voltage dependence of Ca2+-dependent Cl− currents seen, for example, in the parotid gland (Arreola et al. 1996) and the possibility exists that hClCa1 is involved in the up-regulation of such channels. Nevertheless, bestrophin or CLC-3 properties do not conform to the behaviour of the Ca2+-dependent Cl− current observed in our study. Ca2+ concentrations higher than 1 μm have an inhibitory effect on Ca2+-dependent Cl− currents expressed by bestrophins (Barro-Soria et al. 2008) and ClC-3 expression induced currents with time-dependent activation that rectified sharply in the outward direction (Matsuda et al. 2008).
We checked whether an increase in the affinity for internal calcium would account for the effect of hClCa1 on the amplitude of the current by measuring the amplitude of the Ca2+-dependent Cl− current at different internal free Ca2+ concentrations ranging from 130 nm to 486 μm. We showed that hClCa1 drastically increases the amplitude of the Ca2+-dependent Cl− currents including maximal current amplitudes obtained at 486 μm internal free Ca2+ concentration. Therefore, the small decrease of the EC50 value in the presence of hClCa1 cannot account for the overall increase of the current amplitude.
Our observations show variability in the expression of hClCa1 mRNA, hClCa1 protein or the amplitude of the chloride currents. Discrepancies also exist between the different expression levels (mRNA, immunolabelling or chloride currents). For example, HEK293 clone 6 expresses low levels of hClCa1 mRNA or A48 immunolabelling but has chloride currents of similar amplitude to those recorded in clones 4 and 8. In fact, the absence of a proportional relationship between the level of expression of hClCa1 and the up-regulation of the Ca2+-dependent Cl− current supports the idea that hClCa1 is not encoding per se for a Ca2+-dependent Cl− channel but is rather a modulator likely to require other proteins in order to get reproducible, quantifiable and predictive effects. Our study also confirms observations with pClCa1, the porcine ortholog of hClCa1, that suggested that ClCa1 was a chloride channel regulator that increased the amplitude of endogenous Ca2+-dependent Cl− channels whose identity remains unknown (Loewen et al. 2002, 2003, 2004). Finally, our results are in concordance with the effects of mClCa3, the mouse homolog of hClCa1, increasing the amplitude of time-independent and outwardly rectifying Ca2+-dependent Cl− currents (Winpenny et al. 2002).
Therefore, hClCa1 appears to be acting as a chloride channel regulator, increasing the amplitude of endogenous Ca2+-dependent Cl− chloride channels whose identity remains unknown. Gibson et al. (2005) showed that hClCa1 can be secreted in the extracellular medium although it is possible that residual hClCa1 remains on the cell surface as shown on microvilli, allowing an interaction with the ion channel. Mouse ClCa1 interacts with the large conductance potassium channel β subunit, increasing the calcium sensitivity of the BK current and evoking large Ca2+-dependent Cl− currents (Greenwood et al. 2002). Whereas in this latter study, a physical association between the two proteins could be demonstrated, resolution of the function of hClCa1 and of the regulatory characteristics will first require a greater understanding of the structure of the Ca2+-dependent Cl− channel(s) and of the pore-conducting subunit of the channel. The identification of proteins coding for the Ca2+-dependent Cl− current in HEK293 cells remains therefore to be elucidated alongside proteins interacting with hClCa1. Recently, Caputo et al. (2008) identified TMEM16A as an intrinsic constituent of the calcium-dependent chloride channel and showed that specific mutagenesis of highly conserved amino acids changed intrinsic properties of the channel. Other family members, such as TMEM16F, TMEM16J or TMEM16K, may represent other types of Cl− channels with different biophysical properties and mechanisms of regulation and may ultimately be the channel modulated by hClCa1.
hClCa1 decreases Ca2+-dependent Cl− channel energy barriers
Altogether our data suggest a modulatory effect of hClCa1 on existing Ca2+-dependent Cl− channels. We performed a substitution of Cl− with different anions and first analysed the permeability sequence (shift of the reversal potential) obtained in those different conditions. Whether in the presence or absence of hClCa1, the permeability sequence for all currents was similar to the permeability sequence reported for Ca2+-dependent Cl− channels in Xenopus oocytes and in other tissues (Qu & Hartzell, 2000). We showed that hClCa1 leaves the shift of the reversal potential under bi-ionic conditions unaffected, reflecting a similar ability for anions to enter the pore (Qu & Hartzell, 2000) in the absence or presence of hClCa1.
Having shown that hClCa1 increased the amplitude of Cl− currents, we then checked whether whole current amplitudes (whole cell conductances, G) were similarly increased for all anions. We found that while hClCa1 increased both GSCN− and GCl−, its relative effect on both conductances was different, leading to a proportional higher increase of the conductance when carried by Cl− in comparison to SCN−. As a result, hClCa1 decreased the whole cell conductance ratio GSCN−/GCl−. This suggests that hClCa1 does not increase the ability of ions to enter the pore (permeability) but rather modifies their ability to traverse the entire length of the pore (conductance) (Qu & Hartzell, 2000). Permeability ratios, determined by the difference between the energy required to dehydrate the anion and some stabilization energy due to the anion entering the pore, are not highly dependent on the channel structure. Likewise, permeability ratios turn out to be properties that are least affected by mutations generally. Therefore, the inability of hClCa1 to affect the permeability ratio suggests that hClCa1 does not modify the anionic dehydration and stabilisation energy while entering the pore. Mutations usually affect the conductance. For example, only minor conformational changes of the hydrophobic region of the pore are required to create macroscopic changes in conductance in the ACh receptor–channel (Corry, 2006).
To gain insight into the mechanisms underlying the effect of hClCa1 on the decreased whole cell conductance ratio GSCN−/GCl−, we performed best fit energy profiles for GSCN−/GCl− using a simple Eyring (Eyring et al. 1949) model. Best fit energy profiles estimated that hClCa1 is likely to neither encode for chloride channels nor alter its opening probability (N unaffected) but instead increases the Cl− channel conductance from an estimated 3 pS to values exceeding 10 pS, mainly by lowering the first energy barrier G12 and also the second energy barrier G2. Those estimated conductances are within the range of conductances previously reported for this channel. Calcium-dependent Cl− conductances as small as 2 pS have been previously reported in Xenopus oocytes (Takahashi et al. 1987) and single channel conductances of 13 pS have also been described in HEK293 cells after transfection with hClCa1 (Gruber et al. 1998). The modulatory effect of hClCa1 could originate from changes in the geometrical properties of the inner core of the channel and modulation of electrostatic interactions between the ion and polar groups within the channel, thereby affecting the free energy profile and lowering the channel energy barriers.
We do not exclude the possibility that hClCa1 induces other similar types of Ca2+-dependent Cl− channels not functionally expressed in the control cells but this possibility seems unlikely considering that the model only fits data when the total number of channels is unchanged. Newly expressed channels would then theoretically need to be accompanied by a proportional decrease of the number of channels already present in order for the model to fit the data. Our results also indicate that the biophysical and pharmacological properties of the Ca2+-dependent Cl− current are left unchanged after expressing hClCa1. Newly expressed channels would then theoretically display similar biophysical and pharmacological properties. Therefore, the most likely and simple explanation of the effect of hClCa1 lies in the increase of the conductance of the single channel.
We tried to verify the prediction from the modelling and measured single channels in cells expressing hClCa1. Despite multiple attempts, those measurements were unsuccessful. This could be due to the small single channel conductance that makes the single channel current indistinguishable from the measurement noise. Another likely explanation is linked to the low probability of recording single channels. We estimated an average number of 250 channels in 15 pF cells. Considering 1 pF equals 1 μf cm−2, this would lead to the probability of measuring a channel in 1 μm2 patches of 0.25. Ion channels may also form clusters that are unequally distributed within the cell thereby decreasing the probability of success even further. Our modelling studies fitted adequately the effect of hClCa1 when increasing the single channel conductance and leaving the channel number unchanged. Similarities in channel sparseness and clustering in cells expressing hClCa1 can de facto explain why in the presence of hClCa1 we could not observe single channels.
hClCa1: a target for asthma?
Mucus gland hyperplasia and mucus overproduction and hypersecretion are main features of the airway during asthma. Chloride channels play a major role in the process of transepithelial electrolyte and fluid absorption or secretion and are also involved in the regulation of mucus overproduction (Anderson et al. 1992; Morris, 1999; Patel et al. 2008). Upregulation of mClCa3 in murine models of asthma is strongly associated with mucus overproduction (Nakanishi et al. 2001). In humans, Toda et al. (2002) have shown an up-regulation of hClCa1 in the IL-9-responsive mucus-producing epithelium of asthmatic subjects that supports the hypothesis that hClCa1 may be responsible for the overproduction of mucus in asthmatic subjects. Nakanishi et al. (2001) have highlighted the potential clinical advantage of hClCa1 inhibitors in animal models of asthma, thus hClCa1 inhibition in asthmatic patients may be a new therapeutic strategy. In summary, an up-regulation of hClCa1 during an asthma attack suggests an alteration of Ca2+-dependent Cl− channel energy profiles that could be related to mucus overproduction.
Acknowledgments
This work was supported by GlaxoSmithKline and the Wellcome Trust.
Glossary
Abbreviations
- Br−
bromide
- Cl−
chloride
- EDTA
ethylenediaminetetraacetic acid
- Glc−
gluconate
- GAPDH
glyceraldehyde 3-phosphate dehydrogenase
- EGTA
glycol tetraacetic acid
- HEK293
human embryonic kidney 293 cells
- hClCa1
human ClCa1
- HEDTA
hydroxyethylethylenediaminetriacetic acid
- I−
iodide
- Ise−
isethionate
- mClCa3
murine ClCa3
- NTA
nitrilotriacetic acid
- NMDG
N-methyl-d-glucamine chloride
- pClCa1
porcine ClCa1
- SCN−
thiocyanate
Authors Contribution
All authors participated in the conception and design (M.H.; A.G.; A.J.; J.P.W.; L.P.; K.A.; D.T.; M.M.) or to the analysis and interpretation of data (M.H.; A.G.; N.D.; J.P.W.; L.P.; K.A.; D.T.; M.M.). All authors participated in drafting the manuscript (M.H.; A.G.; N.D.; J.P.W.; L.P.) or revising it critically for important intellectual content (M.H.; N.D.; D.T.; M.M.). All authors have approved the final manuscript. Experiments and data analysis were performed at GlaxoSmithKline Stevenage and data modelling was performed at Leicester University.
References
- Anderson MP, Sheppard DN, Berger HA, Welsh MJ. Chloride channels in the apical membrane of normal and cystic fibrosis airway and intestinal epithelia. Am J Physiol Lung Cell Mol Physiol. 1992;263:L1–L14. doi: 10.1152/ajplung.1992.263.1.L1. [DOI] [PubMed] [Google Scholar]
- Arreola J, Melvin JE, Begenisich T. Activation of calcium-dependent chloride channels in rat parotid acinar cells. J Gen Physiol. 1996;108:35–47. doi: 10.1085/jgp.108.1.35. [DOI] [PMC free article] [PubMed] [Google Scholar]
- Barro-Soria R, Schreiber R, Kunzelmann K. Bestrophin 1 and 2 are components of the Ca2+ activated Cl− conductance in mouse airways. Biochim Biophys Acta. 2008;1783:1993–2000. doi: 10.1016/j.bbamcr.2008.06.016. [DOI] [PubMed] [Google Scholar]
- Britton FC, Ohya S, Horowitz B, Greenwood IA. Comparison of the properties of CLCA1 generated currents and ICl(Ca) in murine portal vein smooth muscle cells. J Physiol. 2002;539:107–117. doi: 10.1113/jphysiol.2001.013170. [DOI] [PMC free article] [PubMed] [Google Scholar]
- Caputo A, Caci E, Ferrera L, Pedemonte N, Barsanti C, Sondo E, Pfeffer U, Ravazzolo R, Zegarra-Moran O, Galietta LJ. TMEM16A, a membrane protein associated with calcium-dependent chloride channel activity. Science. 2008;322:590–594. doi: 10.1126/science.1163518. [DOI] [PubMed] [Google Scholar]
- Collier ML, Levesque PC, Kenyon JL, Hume JR. Unitary Cl− channels activated by cytoplasmic Ca2+ in canine ventricular myocytes. Circ Res. 1996;78:936–944. doi: 10.1161/01.res.78.5.936. [DOI] [PubMed] [Google Scholar]
- Corry B. An energy-efficient gating mechanism in the acetylcholine receptor channel suggested by molecular and Brownian dynamics. Biophys J. 2006;90:799–810. doi: 10.1529/biophysj.105.067868. [DOI] [PMC free article] [PubMed] [Google Scholar]
- Davies NW, McKillen HC, Stanfield PR, Standen NB. A rate theory model for Mg2+ block of ATP-dependent potassium channels of rat skeletal muscle. J Physiol. 1996;490:817–826. doi: 10.1113/jphysiol.1996.sp021189. [DOI] [PMC free article] [PubMed] [Google Scholar]
- Eggermont J. Calcium-activated chloride channels: (un)known, (un)loved? Proc Am Thorac Soc. 2004;1:22–27. doi: 10.1513/pats.2306010. [DOI] [PubMed] [Google Scholar]
- Evans MG, Marty A. Calcium-dependent chloride currents in isolated cells from rat lacrimal glands. J Physiol. 1986;378:437–460. doi: 10.1113/jphysiol.1986.sp016229. [DOI] [PMC free article] [PubMed] [Google Scholar]
- Eyring H, Lumry R, Woodbury JW. Some applications of modern rate theory to physiological systems. Rec Chem Prog. 1949;100:100–114. [Google Scholar]
- Frings S, Reuter D, Kleene SJ. Neuronal Ca2+-activated Cl− channels–homing in on an elusive channel species. Prog Neurobiol. 2000;60:247–289. doi: 10.1016/s0301-0082(99)00027-1. [DOI] [PubMed] [Google Scholar]
- Gandhi R, Elble RC, Gruber AD, Schreur KD, Ji HL, Fuller CM, Pauli BU. Molecular and functional characterization of a calcium-sensitive chloride channel from mouse lung. J Biol Chem. 1998;273:32096–32101. doi: 10.1074/jbc.273.48.32096. [DOI] [PubMed] [Google Scholar]
- Gibson A, Lewis AP, Affleck K, Aitken AJ, Meldrum E, Thompson N. hCLCA1 and mCLCA3 are secreted non-integral membrane proteins and therefore are not ion channels. J Biol Chem. 2005;280:27205–27212. doi: 10.1074/jbc.M504654200. [DOI] [PubMed] [Google Scholar]
- Glässtone S, Laidler KJ, Eyring H. The Theory of Rate Processes: The Kinetics of Chemical Reactions, Viscosity, Diffusion and Electrochemical Phenomena. New York: McGraw-Hill; 1941. [Google Scholar]
- Greenwood IA, Leblanc N. Overlapping pharmacology of Ca2+-activated Cl− and K+ channels. Trends Pharmacol Sci. 2007;28:1–5. doi: 10.1016/j.tips.2006.11.004. [DOI] [PubMed] [Google Scholar]
- Greenwood IA, Miller LJ, Ohya S, Horowitz B. The large conductance potassium channel β-subunit can interact with and modulate the functional properties of a calcium-activated chloride channel, CLCA1. J Biol Chem. 2002;277:22119–22122. doi: 10.1074/jbc.C200215200. [DOI] [PubMed] [Google Scholar]
- Gruber AD, Elble RC, Ji HL, Schreur KD, Fuller CM, Pauli BU. Genomic cloning, molecular characterization, and functional analysis of human CLCA1, the first human member of the family of Ca2+-activated Cl− channel proteins. Genomics. 1998;54:200–214. doi: 10.1006/geno.1998.5562. [DOI] [PubMed] [Google Scholar]
- Gruber AD, Schreur KD, Ji HL, Fuller CM, Pauli BU. Molecular cloning and transmembrane structure of hCLCA2 from human lung, trachea, and mammary gland. Am J Physiol Cell Physiol. 1999;276:C1261–C1270. doi: 10.1152/ajpcell.1999.276.6.C1261. [DOI] [PubMed] [Google Scholar]
- Hartzell C, Putzier I, Arreola J. Calcium-activated chloride channels. Annu Rev Physiol. 2005;67:719–758. doi: 10.1146/annurev.physiol.67.032003.154341. [DOI] [PubMed] [Google Scholar]
- Hauber HP, Manoukian JJ, Nguyen LH, Sobol SE, Levitt RC, Holroyd KJ, McElvaney NG, Griffin S, Hamid Q. Increased expression of interleukin-9, interleukin-9 receptor, and the calcium-activated chloride channel hCLCA1 in the upper airways of patients with cystic fibrosis. Laryngoscope. 2003;113:1037–1042. doi: 10.1097/00005537-200306000-00022. [DOI] [PubMed] [Google Scholar]
- Hauber HP, Tsicopoulos A, Wallaert B, Griffin S, McElvaney NG, Daigneault P, Mueller Z, Olivenstein R, Holroyd KJ, Levitt RC, Hamid Q. Expression of HCLCA1 in cystic fibrosis lungs is associated with mucus overproduction. Eur Respir J. 2004;23:846–850. doi: 10.1183/09031936.04.00096504. [DOI] [PubMed] [Google Scholar]
- Hoshino M, Morita S, Iwashita H, Sagiya Y, Nagi T, Nakanishi A, Ashida Y, Nishimura O, Fujisawa Y, Fujino M. Increased expression of the human Ca2+-activated Cl− channel 1 (CaCC1) gene in the asthmatic airway. Am J Respir Crit Care Med. 2002;165:1132–1136. doi: 10.1164/ajrccm.165.8.2107068. [DOI] [PubMed] [Google Scholar]
- Jentsch TJ, Stein V, Weinreich F, Zdebik AA. Molecular structure and physiological function of chloride channels. Physiol Rev. 2002;82:503–568. doi: 10.1152/physrev.00029.2001. [DOI] [PubMed] [Google Scholar]
- Kidd JF, Thorn P. Intracellular Ca2+ and Cl− channel activation in secretory cells. Annu Rev Physiol. 2000;62:493–513. doi: 10.1146/annurev.physiol.62.1.493. [DOI] [PubMed] [Google Scholar]
- Kim SJ, Shin SY, Lee JE, Kim JH, Uhm SY. Ca2+ activated Cl− channel currents in rat ventral prostate epithelial cells. Prostate. 2003;55:118–127. doi: 10.1002/pros.10214. [DOI] [PubMed] [Google Scholar]
- Kuruma A, Hartzell HC. Bimodal control of a Ca2+-activated Cl− channel by different Ca2+ signals. J Gen Physiol. 2000;115:59–80. doi: 10.1085/jgp.115.1.59. [DOI] [PMC free article] [PubMed] [Google Scholar]
- Large WA, Wang Q. Characteristics and physiological role of the Ca2+-activated Cl− conductance in smooth muscle. Am J Physiol Cell Physiol. 1996;271:C435–C454. doi: 10.1152/ajpcell.1996.271.2.C435. [DOI] [PubMed] [Google Scholar]
- Loewen ME, Bekar LK, Walz W, Forsyth GW, Gabriel SE. pCLCA1 lacks inherent chloride channel activity in an epithelial colon carcinoma cell line. Am J Physiol Gastrointest Liver Physiol. 2004;287:G33–G41. doi: 10.1152/ajpgi.00023.2004. [DOI] [PubMed] [Google Scholar]
- Loewen ME, Forsyth GW. Structure and function of CLCA proteins. Physiol Rev. 2005;85:1061–1092. doi: 10.1152/physrev.00016.2004. [DOI] [PubMed] [Google Scholar]
- Loewen ME, Gabriel SE, Forsyth GW. The calcium-dependent chloride conductance mediator pCLCA1. Am J Physiol Cell Physiol. 2002;283:C412–C421. doi: 10.1152/ajpcell.00477.2001. [DOI] [PubMed] [Google Scholar]
- Loewen ME, Smith NK, Hamilton DL, Grahn BH, Forsyth GW. CLCA protein and chloride transport in canine retinal pigment epithelium. Am J Physiol Cell Physiol. 2003;285:C1314–C1321. doi: 10.1152/ajpcell.00210.2003. [DOI] [PubMed] [Google Scholar]
- Matsuda JJ, Filali MS, Volk KA, Collins MM, Moreland JG, Lamb FS. Overexpression of CLC-3 in HEK293T cells yields novel currents that are pH dependent. Am J Physiol Cell Physiol. 2008;294:C251–C262. doi: 10.1152/ajpcell.00338.2007. [DOI] [PubMed] [Google Scholar]
- Morris AP. The regulation of epithelial cell cAMP and calcium dependent chloride channels. Adv Pharm. 1999;46:209–251. doi: 10.1016/s1054-3589(08)60472-x. [DOI] [PubMed] [Google Scholar]
- Mundhenk L, Alfalah M, Elble RC, Pauli BU, Naim HY, Gruber AD. Both cleavage products of the mCLCA3 protein are secreted soluble proteins. J Biol Chem. 2006;281:30072–30080. doi: 10.1074/jbc.M606489200. [DOI] [PubMed] [Google Scholar]
- Nakanishi A, Morita S, Iwashita H, Sagiya Y, Ashida Y, Shirafuji H, Fujisawa Y, Nishimura O, Fujino M. Role of gob-5 in mucus overproduction and airway hyperresponsiveness in asthma. Proc Natl Acad Sci U S A. 2001;98:5175–5180. doi: 10.1073/pnas.081510898. [DOI] [PMC free article] [PubMed] [Google Scholar]
- Nilius B, Szucs G, Heinke S, Voets T, Droogmans G. Multiple types of chloride channels in bovine pulmonary artery endothelial cells. J Vasc Res. 1997;34:220–228. doi: 10.1159/000159226. [DOI] [PubMed] [Google Scholar]
- Patel AC, Brett TJ, Holtzman MJ. The role of CLCA proteins in inflammatory airway disease. Annu Rev Physiol. 2008;71:425–449. doi: 10.1146/annurev.physiol.010908.163253. [DOI] [PMC free article] [PubMed] [Google Scholar]
- Piper AS, Greenwood IA, Large WA. Dual effect of blocking agents on Ca2+-activated Cl− currents in rabbit pulmonary arterial smooth muscle cells. J Physiol. 2002;539:119–131. doi: 10.1113/jphysiol.2001.013270. [DOI] [PMC free article] [PubMed] [Google Scholar]
- Qu Z, Hartzell HC. Anion permeation in Ca2+-activated Cl− channels. J Gen Physiol. 2000;116:825–844. doi: 10.1085/jgp.116.6.825. [DOI] [PMC free article] [PubMed] [Google Scholar]
- Takahashi T, Neher E, Sakmann B. Rat brain serotonin receptors in Xenopus oocytes are coupled by intracellular calcium to endogenous channels. Proc Natl Acad Sci U S A. 1987;84:5063–5077. doi: 10.1073/pnas.84.14.5063. [DOI] [PMC free article] [PubMed] [Google Scholar]
- Toda M, Tulic MK, Levitt RC, Hamid Q. A calcium activated chloride channel (hClCa1) is strongly related to IL-9 expression and mucus production in bronchial epithelium of patients with asthma. J Allergy Clin Immunol. 2002;109:246–250. doi: 10.1067/mai.2002.121555. [DOI] [PubMed] [Google Scholar]
- Wang Q, Wang YX, Yu M, Kotlikoff MI. Ca2+-activated Cl− currents are activated by metabolic inhibition in rat pulmonary artery smooth muscle cells. Am J Physiol Cell Physiol. 1997;273:C520–C530. doi: 10.1152/ajpcell.1997.273.2.C520. [DOI] [PubMed] [Google Scholar]
- Winpenny JP, Lavery WL, Watson N, Chazot PL. Biochemical and electrophysiological characterization of the GOB5 (mClCa3) chloride channel protein after expression in HEK 293 cells. J Physiol. 2002;539:2P. [Google Scholar]