

Abstract
Forkhead box P3 (FoxP3) is a transcription factor whose expression characterizes regulatory T cells (Treg), but it is also present on activated T cells, thus hindering correct Treg identification. Using classical markers for Treg recognition, discordant results were found in terms of Treg expansion during active tuberculosis (TB) disease. Recently CD39 has been shown to be an accurate marker for Treg detection. The objectives of this study were: (i) to identify Treg expressing CD39 in patients with TB and to compare the results with those obtained by the standard phenotypic markers; (ii) to evaluate if Treg are expanded in vitro by exogenous interleukin (IL)-2 or by antigen-specific stimulation; and (iii) to characterize Treg function on the modulation of antigen-specific responses. We enrolled 13 patients with pulmonary TB and 12 healthy controls. Treg were evaluated by flow cytometry ex vivo and after antigen-specific in vitro stimulation using CD25, FoxP3, CD127 and CD39 markers. Results indicate that CD39+ cells within the CD4+CD25high cells have Treg properties (absence of interferon-γ production and transforming growth factor-β1 release upon stimulation). Ex vivo analysis did not show significant differences between TB patients and controls of Treg by classical or novel markers. In contrast, a significantly higher percentage of Treg was found in TB patients after antigen-specific stimulation both in the presence or absence of IL-2. Depletion of CD39+ Treg increased RD1-specific responses significantly. In conclusion, CD39 is an appropriate marker for Treg identification in TB. These results can be useful for future studies to monitor Mycobacterium tuberculosis-specific response during TB.
Keywords: CD39, FoxP3, RD1 proteins, TB, Treg
Introduction
Tuberculosis (TB) remains one of the world's leading causes of mortality because of a single infectious agent, with approximately 1·5 million deaths and 9·2 million new cases per year as estimated in 2006 [1]. It is estimated that worldwide one-third of the human population is infected with the causative agent Mycobacterium tuberculosis and is therefore at risk of developing the disease.
Regulatory T cells (Treg) play an important role in immune regulation to prevent autoimmunity diseases and to control the immune responses by down-regulating the function of effector CD4+ or CD8+ T cells [2]. It is believed that Treg down-modulate immune responses after pathogen eradication to avoid exacerbated pathology. Although this mechanism is generally to the benefit of the host in acute infections, it poses problems in chronic infections, notably when pathogen persistence is sustained in the face of an active immune response. Treg comprise multiple subsets: naturally occurring thymus-derived CD4+CD25high T cells, that have the ability of cell-contact-dependent suppression of immune response, and different subsets of adaptive Treg, such as Tr1 cells secreting high levels of interleukin (IL)-10, and T helper type 3 cells which produce high levels of transforming growth factor (TGF)-β1 [3,4]. It has been shown that several factors such IL-2, IL-10 and TGF-β1 are involved in the generation and maintenance of Treg[5].
Natural Treg express constitutively CD25 (α chain of IL-2 receptor); they are identified as CD4 T cells with high expression of CD25 and they have regulatory properties. This fact introduced certain difficulties and confusion in distinguishing Treg from conventional non-regulatory activated CD4+CD25+ T cells. At present, the intracellular forkhead winged-helix family transcriptional repressor p3 (FoxP3) is described as the most specific marker of Treg. FoxP3 expression correlates well with regulatory activity; it is expressed in CD4+CD25+ Treg and is considered a key player for their development and function [6]. FoxP3 represses IL-2, IL-4 and interferon (IFN)-γ gene expression and interacts with nuclear transcription factors of activated T cells (nuclear factor-κB, nuclear factor of activated cells), resulting in poor cytokine production and impaired proliferation [7]. However, the FoxP3 marker is also present in activated T cells [8]. Moreover, recent studies have shown that a lack or low expression of CD127 (the α chain of the IL-7 receptor) is linked with Treg identification similar to CD4+CD25+FoxP3+ T cells [9]. Recently CD39, an ectoenzyme that degrades adenosine triphosphate (ATP) to adenosine 5′-monophosphate, has been shown to be associated specifically to Treg, as described in inflammatory autoimmune diseases [10].
The Treg have been implicated in infectious diseases, particularly in chronic or persistent infections [3,11]. Discordant results were found ex vivo in terms of Treg expansion during active TB disease, some authors reporting an increase of CD4+CD25+FoxP3+ T cells, whereas others reported absence of modulation of this T cell subset [2,12–15]. Thus, the objectives of this study were to: (i) identify Treg expressing CD39 in patients with TB and compare the results with those obtained by the standard phenotypic markers; (ii) to evaluate if Treg can be expanded in vitro by exogenous IL-2 or by antigen-specific stimulation with region of difference (RD)-1 proteins; and (iii) to characterize Treg functions in the modulation of antigen-specific responses.
Materials and methods
Patient population
Thirteen patients with newly diagnosed pulmonary TB and 12 healthy control subjects were recruited at the National Institute for Infectious Diseases ‘Lazzaro Spallanzani’. The study was approved by the Ethics Committee of the Institute, and all enrolled individuals provided written informed consent. All the patients included in the study were sputum culture positive for M. tuberculosis, tested negative for human immunodeficiency virus infection and did not receive immunosuppressive drugs. Healthy subjects were chosen if: (i) no exposure to M. tuberculosis was reported; (ii) negative response to the QuantiFERON-TB Gold (Cellestis Limited, South Melbourne, Australia) was shown; and (iii) negative tuberculin skin test (TST) scoring. The characteristics of all participants are shown in Table 1.
Table 1.
Epidemiological and demographic characteristics of the subjects enrolled.
| Active TB n 13 (%) | Healthy subjects n 12 (%) | |
|---|---|---|
| Median age in years (range) | 33(21–65) | 34(27–45) |
| Female (positive over total) | 4(30·7) | 7(58·3) |
| Origin (positive over total) | ||
| West Europe | 1(7·7) | 12(100) |
| East Europe | 6(46·1) | 0 |
| Asia | 3(23·1) | 0 |
| Africa | 3(23·1) | 0 |
| TST (positive over total) | 9(69·2) | 0 |
| BCG-vaccinated (positive over total) | 13(100) | 0 |
| QuantiFERON-TB Gold In-Tube (positive over total) | 11(84·6) | 0 |
BCG, bacillus Calmette–Guérin; TB, tuberculosis; TST, tuberculin skin test.
Patients with active TB were studied within 7 days of admission and before they started anti-TB therapy. For each enrolled participant, a blood sample was drawn into tubes containing heparin.
The TST was administered by the Mantoux procedure using 5 IU of purified protein derivative (Chiron, Siena, Italy). Results were read after 72 h. Induration of at least 10 mm was considered a positive response [16].
QuantiFERON-TB Gold In-Tube (Cellestis Limited, Carnegie, Victoria, Australia) was performed and its results were scored as indicated by the manufacturer (cut-off value for a positive test was 0·35 IU/ml).
In a group of patients we also evaluated cytomegalovirus (CMV) serology by VIDAS CMV immunoglobulin (Ig)G and IgM (Biomerieux, Marcy l'Etoile, France).
Isolation of peripheral blood mononuclear cells and cultures
Peripheral blood mononuclear cells (PBMC) were isolated from whole blood using Ficoll density gradient centrifugation. After washing, PBMC at a concentration of 1 × 10⁶ cells/ml were cultured for 6 days at 37°C and 5% CO2 in a complete medium (RPMI-1640, 10% heat-inactivated human serum, 10 mM HEPES, 2 mM L-glutamine and 10 U/ml penicillin–streptomycin, all from Euroclone Ltd, Weatherby, UK). Cultures were prepared in 48-well tissue-culture plates (Costar, Corning Inc., NY, USA) in 1 ml/well. PBMC were stimulated with M. tuberculosis-specific antigens identified as early secreted antigenic target-6 (ESAT-6) and culture filtrate protein-10 (RD1) intact proteins (Lionex, Braunschweig, Germany) at 4 µg/ml in the presence or absence of IL-2 (Chiron) at 5 U/ml.
Depletion of CD4+CD25+ T cells
In some experiments, CD4+ T cells were isolated from PBMC by negative selection (Miltenyi Biotec, Bergisch Gladbach, Germany), then CD4+CD25+ T cells were selected positively from CD4+ T cells using a human CD4+CD25+ Treg isolation kit, according to the manufacturer's instructions (Miltenyi Biotec). Approximately 90% of Treg were eliminated after depletion, as determined by flow cytometry analysis. The cell fractions CD4– and CD4+CD25– were pooled and used as Treg-depleted PBMC.
Cytokine detection
From PBMC different cell subsets were sorted (MoFlo, Beckman Coulter, Fullerton, CA, USA) based on the expression of CD39 on CD25high/lowCD4+ T cells, and were used to determine TGF-β1 production; B cells (CD19+ cells) and monocytes (CD14+CD3– cells) were used as controls. The different cell subsets were in vitro stimulated for 1 day with anti-CD3 and anti-CD28 antibodies (Becton Dickinson, San José, CA, USA). TGF-β1 and IL-10 release was evaluated by enzyme-linked immunosorbent assay (ELISA) (R&D Systems, Minneapolis, MN, USA).
The IFN-γ in the cell cultures' supernatants was evaluated by ELISA according to the manufacturer's instructions (QuantiFERON-CMI; Cellestis Limited). Cytokines results were expressed as pg/ml.
Antigen-specific response evaluation
Freshly isolated Treg-undepleted PBMC and Treg-depleted PBMC from TB patients were cultured in 96-well plates at a concentration of 2×10⁵ cells per well in 250 µl of complete medium. The cells were stimulated with M. tuberculosis-specific RD1 intact proteins (Lionex), phytohaemagglutinin at 5 µg/ml (Sigma Aldrich, St Louis, MO, USA) and CMV lysate (StrainAD 169; ABI Inc., Columbia, MD, USA) at 2 µg/ml and cultured for 3 days.
Phenotypic analysis
Phenotypic analysis of PBMC (1 × 10⁶ cells/ml) was performed by flow cytometry either ex vivo or after 1 and 6 days of culture in complete medium in the presence or absence of the stimuli as indicated above. Expression of different markers was assessed by staining with appropriate combinations of monoclonal antibodies (mAb) conjugated directly to fluorochromes: fluorescein isothiocyanate-conjugated anti-CD39 (Ancell, Bayport, MN, USA), phycoerythrin-conjugated anti-CD25 (Becton Dickinson), peridinin chlorophyll–protein complex-conjugated anti-CD4 (Becton Dickinson) and Alexa Fluor 647-conjugated anti-FoxP3 (Becton Dickinson).
To detect intracellular expression of IFN-γ, 10 µg/ml of brefeldin A (Sigma Aldrich) was used, as described previously [17]. Phorbol-12-myristate-13-acetate (PMA) plus ionomycin (Sigma Aldrich) were used as positive controls at 3 nM and 1·5 µM respectively. Briefly, production of IFN-γ was assessed by staining with appropriate combinations of mAb conjugated directly to fluorochromes. Data acquisition and analysis were performed on a FACSCalibur flow cytometer (Becton Dickinson) using CellQUEST software (version 3.1; Becton Dickinson). For all staining procedures, an isotype-matched negative control was processed in parallel.
Statistical analysis
Statistical significance of results was determined with the statistics programme included in the GraphPad Prism software (GraphPad). Statistical analysis was performed using Student's t-test to assess differences between the different study groups. The Wilcoxon matched-pairs t-test was used to analyse cytokines production by Treg. Differences were considered significant when the P value was less than 0·05.
Results
Epidemiological and demographic characteristics of the subjects enrolled
Demographic and clinical characteristics of the 13 patients with active TB and 12 healthy control subjects are summarized in Table 1. Among the 13 patients with active TB, nine (69%) had TST-positive results. All TB subjects were bacillus Calmette–Guérin (BCG)-vaccinated. Among the 12 control subjects, all were TST-negative, BCG-unvaccinated and none was infected with M. tuberculosis (negative result to QuantiFERON-TB Gold).
Phenotypic analysis of Treg
To compare the classical markers for Treg (CD25, FoxP3 and CD127) with the recently identified CD39 marker, we stained PBMC ex vivo with the appropriate combination of mAbs.
As shown in Fig. 1a, the CD25 marker identified three distinct populations of CD4+ T cells (high, low and negative) that also express FoxP3 (Fig. 1b–d), CD127 (Fig. 1e–g) and CD39 (Fig. 1h–j) differently. Interestingly, the CD39 marker is expressed almost exclusively by the CD4+CD25high population (median 40 ± 20% Fig. 1h), similar to FoxP3 (median 86 ± 14% Fig. 1b). Conversely, CD127 is expressed at very low levels by CD4+CD25high compared with the CD4+CD25low and CD4+CD25neg cells.
Fig. 1.
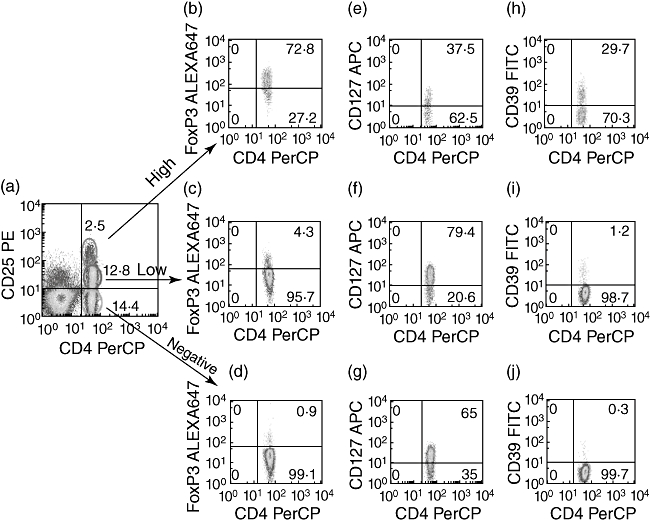
Phenotypic analysis of T regulatory cells (Treg). Classical markers for CD4 Treg[CD25, forkhead box P3 (FoxP3) and CD127] were compared with the innovative CD39 marker. Peripheral blood mononuclear cells (PBMC) from healthy control subjects were stained with appropriate combinations of monoclonal antibodies and fluorescence activated cell sorter (FACS) analysis was performed, as described in the Materials and methods section. The expression of FoxP3 (b–d), CD127 (e–g) or CD39 (h–j) was evaluated among CD4+CD25high, CD4+CD25low and CD4+CD25neg T cells (a). Representative flow cytometric panels from one of five donors are shown.
Characterization of CD39+ T cells
To evaluate whether CD39+ T cells have the functional characteristics of Treg, intracellular IFN-γ cytokine expression was evaluated. As shown previously, the CD4 marker is down-modulated after PMA stimulation [18,19], therefore we analysed IFN-γ cytokine production by CD8–CD3+CD39+ T cells. Among the gated CD3+CD8– T cells (Fig. 2a), we found that CD39 expression correlates with the inability to produce IFN-γ (Fig. 2b), consistent with a regulatory phenotype. Conversely, IFN-γ was produced significantly by CD8–CD3+CD39– cells. TGF-β1 production characterizes Treg function further; however, it cannot be evaluated by intracellular staining. Therefore its release was evaluated by immunoenzymatic methods in different sorted-cell subsets according to the expression of CD39 on CD25high/lowCD4+ Tcells; B cells (CD19+ cells) and monocytes (CD14+ CD3– cells) were used as controls (Fig. 2c and d). The different cell subsets were stimulated in vitro with anti-CD3 and anti-CD28 antibodies, with the exception of B cells and monocytes. As shown in Fig. 2c, IFN-γ production was significantly lower in CD4+CD25highCD39+ compared with the other cell subsets. Conversely, TGF-β1 release (Fig. 2d) was significantly higher in CD4+CD25highCD39+ compared with the other cell subsets, substantiating the notion that these cells have Treg characteristics.
Fig. 2.

Characterization of CD39+ T cells. Peripheral blood mononuclear cells (PBMC) from a healthy control subjects of five tested were stained with CD8 and CD3 monoclonal antibodies (mAbs), as shown in (a). Interferon (IFN)-γ cytokine expression on CD39 T cells was evaluated among CD3+CD8– gated T cells by flow cytometer (b). IFN-γ (c) and transforming growth factor (TGF)-β1 (d) production was evaluated in different cell subsets that were sorted within the CD4+ T cells based on the expression of CD39 on CD25high/low. Moreover, B cells (CD19+ cells) and monocytes were used as controls. Cell subsets, with the exception of monocytes and B cells, were stimulated in vitro for 1 day with anti-CD3 and anti-CD28 mAbs. IFN-γ and TGF-β1 release was evaluated by enzyme-linked immunosorbent assay. Results are shown as IFN-γ and TGF-β1 production from a representative healthy subject of two tested (c–d). Fluorescence activated cell sorter analysis and sorting were performed as described in the Materials and methods section.
Ex vivo and in vitro evaluation of CD4 Treg by different markers in healthy donors and TB patients
We then measured the frequency of CD25highFoxP3+, CD25highCD39+ and CD25highCD127– on gated CD4+ T cells in ex vivo PBMC of subjects with or without active TB (Fig. 3a). The percentage of CD4+CD25highCD39+ and CD4+CD25highCD127– cells was higher in TB patients than in healthy donors, although the difference was not statistically significant. The percentage of CD4+CD25highFoxP3+ cells was comparable in TB versus healthy donors. Thus, no increase of Treg was found in the ex vivo analysis in patients with active TB disease compared with controls.
Fig 3.
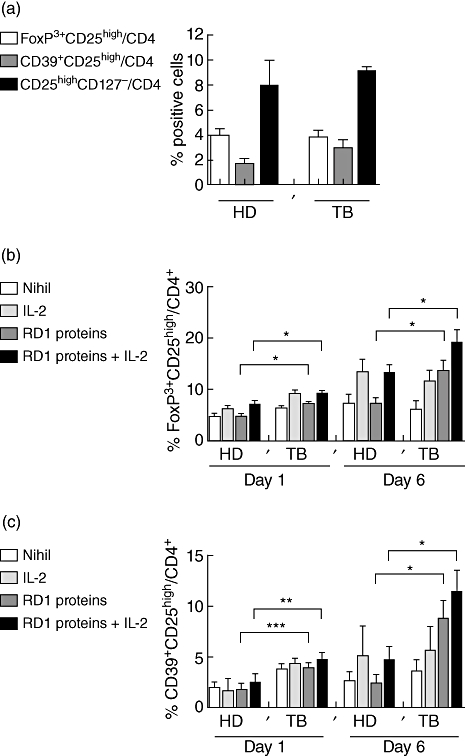
Ex vivo and in vitro evaluation of CD4 T regulatory cells (Treg) by different markers in healthy donors and patients with tuberculosis (TB). Ex vivo evaluation of Treg in patients with or without active TB. Ex vivo expression of CD25high in combination with forkhead box P3 (FoxP3) (white bar), CD39 (grey bar) or CD127 (black bar) on gated CD4+ T lymphocytes, from healthy donors and TB patients, was evaluated by flow cytometry (a). Overtime evaluation of CD25 and FoxP3 expression on gated CD4 T cells after RD1-specific stimulation. In vitro culture of peripheral blood mononuclear cells (PBMC) stimulated for 1 or 6 days by RD1 proteins, in the presence or absence of interleukin (IL)-2, was performed. CD4+CD25highFoxP3+ cells were significantly higher in TB patients at days 1 (P = 0·01) and 6 (P = 0·01) in response to RD1 proteins compared with healthy donors. Exogenous IL-2 increased significantly the expansion of Treg in RD1 protein-stimulated PBMC at days 1 (P = 0·04) and 6 (P = 0·04) (b). Overtime evaluation of CD25 and CD39 expression on gated CD4 T cells after RD1-specific stimulation. CD4+CD25highCD39+ T cells were increased significantly at days 1 (P = 0·0009) and 6 in TB patients (P = 0·03) after RD1 protein-specific stimulation which was increased further by exogenous IL-2 at days 1 (P = 0·0058) and 6 (P = 0·04) (c). Data are shown as the mean of six independent experiments in which 12 healthy donors and 13 patients with active TB were studied. Standard deviations are reported. HD, healthy donors; TB, active pulmonary TB disease patients; RD, region of difference.
Further, we evaluated if in vitro antigen-specific stimulation could expand Treg in TB patients. Concerning the CD4+CD25highFoxP3+ T cells, a significant difference was found in TB patients at days 1 (P = 0·01) and 6 (P = 0·01) stimulated with RD1 proteins compared with healthy donors. Exogenous IL-2 increased the expansion of Treg significantly in RD1 protein-stimulated PBMC at days 1 (P = 0·04) and 6 (P = 0·04) (Fig. 3b).
Similarly, using CD39 as a Treg marker, a significantly higher increase of this cell population was found at days 1 (P = 0·0009) and 6 (P = 0·03) in TB patients compared with healthy donors after RD1 protein-specific stimulation, which was increased further by the addition of exogenous IL-2 at days 1 (P = 0·005) and 6 (P = 0·04) (Fig. 3c). Thus, RD1-specific stimulation induces a significant expansion of Treg in patients with active TB.
Cytokine analysis after RD1-specific stimulation
Among patients with active TB we evaluated whether IL-10 and TGF-β1 were produced upon stimulation with RD1 proteins in the presence or absence of exogenous IL-2. The results indicate that, at day 6, IL-10 production was increased in response to RD1 proteins in TB patients (median 298·7 pg/ml; range: 10·88–1058·26 pg/ml) compared with healthy donors (median: 262·5 pg/ml; range: 48·21–493·6 pg/ml), although it was not statistically significant. On the other hand, TGF-β1 production was not modulated by M. tuberculosis-specific stimulation [TB patients (median 8189 pg/ml, range: 2080–18328 pg/ml) versus healthy donors (median 8460 pg/ml, range: 2378–14607 pg/ml)] (data not shown).
Depletion of CD4+CD25+CD39+ T cells from TB patients PBMC increases responses to recall antigens
To investigate whether Treg may hinder an anti-TB immune response, CD4+CD25highCD39+ T cells were depleted from TB patients' PBMC (Fig. 4).
Fig. 4.
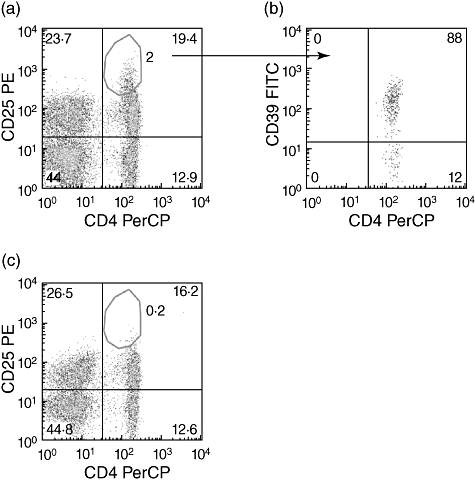
Flow cytometric analysis before and after depletion of T regulatory cells (Treg) from tuberculosis (TB) patients' peripheral blood mononuclear cells (PBMC). TB patients' PBMC were stained with CD4 and CD25 before (a) and after (c) depletion of Treg. CD39 expression was evaluated on gated CD4+CD25high T cells (b). Fluorescence activated cell sorter (FACS) analysis was performed as described in the Materials and methods section. Representative panels from one patient are shown. The percentage of Treg evaluated as CD4+CD25high in Treg-undepleted PBMC is 2% (a). Among them 88% are CD39+ (b). After Treg depletion the percentage of Treg is 0·2% (c).
The Treg (Fig. 4a) were depleted from PBMC; after this depletion, the cells were characterized by fluorocitometric analysis by being almost all CD39+ (88% positivity) (Fig. 4b). The Treg-undepleted (Fig. 4a) and Treg-depleted (Fig. 4c) cell populations were used to perform functional experiments.
In those with detectable serum IgG antibodies to CMV, we used specific stimulation with CMV as control to evaluate the response to a recall antigen. In the four patients analysed, CD4+CD25+CD39+-depleted T cells showed a significantly enhanced RD1 protein- and CMV-mediated production of IFN-γ (P = 0·001) compared with the Treg-undepleted PBMC fraction (Fig. 5a) after 3 days of antigen-specific stimulation. Data are also shown as fold of increase of IFN-γ responses to antigens in Treg-depleted PBMC/Treg-undepleted PBMC (Fig. 5b).
Fig. 5.

Depletion of CD4+CD25+CD39+ T cells from tuberculosis (TB) patients' peripheral blood mononuclear cells (PBMC) increases interferon (IFN)-γ production in response to recall antigens. PBMC from TB patients were cultured in the presence or absence of RD1-specific proteins and cytomegalovirus (CMV). After 3 days of culture IFN-γ production was evaluated in the supernatants by enzyme-linked immunosorbent assay in T regulatory cells (Treg)-undepleted PBMC (grey bar) and Treg-depleted PBMC (black bar). IFN-γ production was increased in response to RD1 proteins and CMV in Treg-depleted PBMC. Results are shown as IFN-γ production from a representative TB patient (a) and as fold of increase of IFN-γ responses to antigens in Treg-depleted PBMC/Treg-undepleted PBMC from four TB patients (b). RD, region of difference; Pt, patient.
Discussion
In this study we evaluated whether Treg were expanded in active TB disease using different Treg markers using ex vivo and in vitro cell culture systems assessment. We demonstrated that CD39 is a useful marker to detect Treg because, within CD4+CD25high cells, it identifies a cell subset characterized by high production of TGF-β1 and the absence of IFN-γ expression. Moreover, we show that ex vivo evaluation of CD4 Treg, identified by either the expression of CD25highFoxP3+CD127– molecules or by the CD39 marker, did not show an increase in the peripheral blood of active TB patients compared with healthy donors. Conversely, in active TB patients, RD1 protein-specific stimulation in vitro expanded Treg, evaluated by the classical and the new marker, which was increased further by IL-2. This Treg expansion was associated with an increase of endogenous IL-10, although it was not statistically significant. Depletion of CD4+CD25highCD39+ increased M. tuberculosis-specific responses, as well as other recall antigens responses. In conclusion, for the first time, to our knowledge, we demonstrated that CD39 is a good marker for Treg identification in an infectious disease such as TB. This information can be useful for future studies to monitor M. tuberculosis-specific response during TB.
To validate CD39 as an appropriate marker for T cells endowed with suppressive abilities, we measured the capability of CD39+ T cells to produce IFN-γ and TGF-β. Interestingly, we found that CD39+ T cells do not produce IFN-γ and those within the CD4+CD25high subset do produce TGF-β. These data, together, indicate that the CD4+CD25highCD39+ present Treg functions.
Discordant results were found ex vivo in terms of Treg expansion in those with TB disease, with some authors reporting an increase of CD4+CD25+FoxP3+ T cells [2,12–14] whereas others showed the absence of modulation of this cell subset [15]. In this study we did not observe any statistical difference between healthy and diseased subjects analysing three different combinations of markers identifying Treg. Conversely, an increase of Treg after in vitro specific-stimulation in patients with active TB was found. The antigen-specific increase of Treg was amplified by exogenous IL-2, which is a well-known factor for Treg generation [5]. Treg increase was demonstrated by the expression of classical (FoxP3, CD25 and CD127) and innovative (CD39) markers.
The mechanisms by which Treg control immune responses are understood incompletely, but there is evidence for a central role of the inhibitory cytokines IL-10 and TGF-β1. When these cytokines were evaluated in TB patients, we found an increase of IL-10 after specific stimulation, although not statistically significant. On the other hand, no modulation of TGF-β1 was found. These data are in line with those found by Roberts et al. [15], who did not find any statistical difference between TB patients and latent TB infection (LTBI) controls in terms of mRNA expression for IL-10 and TGF-β1 after in vitro BCG vaccination.
Depletion of CD4+CD25highCD39+ increased M. tuberculosis-specific responses, as well as other recall antigens responses, indicating that Treg broadly modulate antigen-specific immunity. This result is consistent with the findings by other authors [2,12,13], who reported an increase of IFN-γ response, specific either to BCG or RD1- or heparin-binding haemagglutinin adhesin-proteins after the depletion of CD4+CD25+ T cells.
This study provides the first evidence for a role of Treg identified as CD4+CD25highCD39+ in TB. The added value of this finding is that CD39 may allow an easier detection of Treg compared with FoxP3, which is an intracellular marker. Moreover, at least in humans, FoxP3 is up-regulated during activation, and a fraction of FoxP3+ cells produces IFN-γ (unpublished observations). On the contrary, CD39+ cells do not produce IFN-γ and their role in the control of unwanted immune reactions (such as those that occur in autoimmune diseases) has been suggested recently. Indeed, in patients affected by multiple sclerosis, an autoimmune disease of the central nervous system, CD39+ T cells are greatly reduced compared with healthy subjects. Our results are consistent with the hypothesis that Treg help to control the critical balance between immune-mediated suppression of M. tuberculosis and immunopathology in patients with TB.
More work is required to delineate the role of these Treg in TB disease and infection. It will be interesting to analyse prospectively whether dynamic changes in Treg frequencies are associated with the paradoxical worsening of symptoms and tissue inflammation observed in a proportion of patients with TB during treatment. It is also important to ascertain whether or not Treg are expanded in latent TB infection, where pathogen and antigen loads are low and immunopathology is absent.
Acknowledgments
The authors are grateful to all the patients and nurses that took part in the study. This paper was supported by grants from Ricerca Corrente and Ricerca Finalizzata 06.76.1.
Disclosure
The authors have no conflicting financial interests.
References
- 1.Dye C. Global epidemiology of tuberculosis. Lancet. 2006;367:938–40. doi: 10.1016/S0140-6736(06)68384-0. [DOI] [PubMed] [Google Scholar]
- 2.Chen X, Zhou B, Li M, et al. CD4(+)CD25(+)FoxP3(+) regulatory T-cells suppress Mycobacterium tuberculosis immunity in patients with active disease. Clin Immunol. 2007;123:50–9. doi: 10.1016/j.clim.2006.11.009. [DOI] [PubMed] [Google Scholar]
- 3.Mills KH. Regulatory T-cells: friend or foe in immunity to infection? Nat Rev Immunol. 2004;4:841–55. doi: 10.1038/nri1485. [DOI] [PubMed] [Google Scholar]
- 4.Joosten SA, van Meijgaarden KE, Savage ND, et al. Identification of a human CD8+ regulatory T cell subset that mediates suppression through the chemokine CC chemokine ligand 4. Proc Natl Acad Sci USA. 2007;104:8029–34. doi: 10.1073/pnas.0702257104. [DOI] [PMC free article] [PubMed] [Google Scholar]
- 5.Wan YY, Flavell RA. The roles for cytokines in the generation and maintenance of regulatory T-cells. Immunol Rev. 2006;212:114–30. doi: 10.1111/j.0105-2896.2006.00407.x. [DOI] [PubMed] [Google Scholar]
- 6.Yi H, Zhen Y, Jiang L, Zheng J, Zhao Y. The phenotypic characterization of naturally occurring regulatory CD4+CD25+ T-cells. Cell Mol Immunol. 2006;3:189–95. [PubMed] [Google Scholar]
- 7.Vrabelova Z, Hrotekova Z, Hladikova Z, Bohmova K, Stechova K, Michalek J. CD 127- and FoxP3+ expression on CD25+CD4+ T regulatory cells upon specific diabetogeneic stimulation in high-risk relatives of type 1 diabetes mellitus patients. Scand J Immunol. 2008;67:404–10. doi: 10.1111/j.1365-3083.2008.02074.x. [DOI] [PubMed] [Google Scholar]
- 8.Ziegler SF. FoxP3: not just for regulatory T-cells anymore. Eur J Immunol. 2007;37:21–3. doi: 10.1002/eji.200636929. [DOI] [PubMed] [Google Scholar]
- 9.Seddiki N, Santner-Nanan B, Martinson J, et al. Expression of interleukin (IL)-2 and IL-7 receptors discriminates between human regulatory and activated T-cells. J Exp Med. 2006;203:1693–700. doi: 10.1084/jem.20060468. [DOI] [PMC free article] [PubMed] [Google Scholar]
- 10.Borsellino G, Kleinewietfeld M, Di Mitri D, et al. Expression of ectonucleotidase CD39 by Foxp3+ Treg: hydrolysis of extracellular ATP and immune suppression. Blood. 2007;110:1225–32. doi: 10.1182/blood-2006-12-064527. [DOI] [PubMed] [Google Scholar]
- 11.Belkaid Y, Rouse BT. Natural regulatory T-cells in infectious disease. Nat Immunol. 2005;6:353–60. doi: 10.1038/ni1181. [DOI] [PubMed] [Google Scholar]
- 12.Guyot-Revol V, Innes JA, Hackforth S, Hinks T, Lalvani A. Regulatory T-cells are expanded in blood and disease sites in patients with tuberculosis. Am J Respir Crit Care Med. 2006;173:803–10. doi: 10.1164/rccm.200508-1294OC. [DOI] [PubMed] [Google Scholar]
- 13.Hougardy JM, Place S, Hildebrand M, et al. T-cells depress immune responses to protective antigens in active tuberculosis. Am J Respir Crit Care Med. 2007;176:409–16. doi: 10.1164/rccm.200701-084OC. [DOI] [PubMed] [Google Scholar]
- 14.Hougardy JM, Verscheure V, Locht C, Mascart F. In vitro expansion of CD4+CD25highFoxP3+CD127low/-regulatory T-cells from peripheral blood lymphocytes of healthy Mycobacterium tuberculosis-infected humans. Microbes Infect. 2007;9:1325–32. doi: 10.1016/j.micinf.2007.06.004. [DOI] [PubMed] [Google Scholar]
- 15.Roberts T, Beyers N, Aguirre A, Walzl G. Immunosuppression during active tuberculosis is characterized by decreased interferon-gamma production and CD25 expression with elevated forkhead box P3, transforming growth factor-beta, and interleukin-4 mRNA levels. J Infect Dis. 2007;195:870–8. doi: 10.1086/511277. [DOI] [PubMed] [Google Scholar]
- 16.American Thoracic Society. Diagnostic standards and classification of tuberculosis in adults and children. Am J Respir Crit Care Med. 2000;161:1376–95. doi: 10.1164/ajrccm.161.4.16141. [DOI] [PubMed] [Google Scholar]
- 17.Goletti D, Butera O, Bizzoni F, Casetti R, Girardi E, Poccia F. Region of difference 1 antigen-specific CD4+ memory T-cells correlate with a favorable outcome of tuberculosis. J Infect Dis. 2006;194:984–92. doi: 10.1086/507427. [DOI] [PubMed] [Google Scholar]
- 18.Kemp K, Bruunsgaard H. Identification of IFN-gamma-producing CD4+ T-cells following PMA stimulation. J Interferon Cytokine Res. 2001;21:503–6. doi: 10.1089/10799900152434376. [DOI] [PubMed] [Google Scholar]
- 19.Richie ER, McEntire B, Phillips J, Allison JP. Altered expression of lymphocyte differentiation antigens on phorbol ester-activated CD4+8+ T cells. J Immunol. 1988;140:4115–22. [PubMed] [Google Scholar]