

Abstract
We introduce PULCHRA, a fast and robust method for the reconstruction of full-atom protein models starting from a reduced protein representation. The algorithm is particularly suitable as an intermediate step between coarse grained model-based structure prediction and applications requiring an all-atom structure, such as molecular dynamics, protein-ligand docking, structure-based function prediction, or assessment of quality of the predicted structure. The accuracy of the method was tested on a set of high-resolution crystallographic structures, as well as on a set low-resolution protein decoys generated by a protein structure prediction algorithm TASSER. The method is implemented as a standalone program that is available for download from http://cssb.biology.gatech.edu/skolnick/files/PULCHRA
Keywords: reduced protein representation, protein structure prediction, side chain and backbone reconstruction, protein model refinement
Introduction
In order to efficiently sample protein conformational space, protein structure prediction algorithms often employ a reduced protein representation. For example, instead of calculating interactions between all protein atoms, every amino acid can be represented by a single center of interaction (e.g. positioned on a side chain center of mass) 1. Thus, the amount of calculations necessary to calculate the energy of the system can be dramatically reduced. While the reduced models are necessary to efficiently search conformational space, fine-detailed all-atom models are often essential for subsequent structural studies. The full-atom representation is required for many applications, such as protein function analysis, virtual ligand screening, prediction of protein-protein interactions, and assessment of structure quality 2. Therefore, following assembly of an approximate fold, the reduced models need to be translated into detailed atomic models for later analysis.
The idea behind this work is to develop a fast and complete procedure for the conversion of reduced protein models into all-atom structures suitable for subsequent optimization using molecular mechanics force fields. Reduced representations can include α–carbon only representation, a side chain rotamer center of mass, an α–carbon and side chain rotamer center of mass representation, or other centers of interactions (for instance, Cβ atoms). The procedure should avoid creating structural errors that may render the full-atom model inappropriate for further molecular mechanics optimization. For example, most molecular mechanics force fields can’t fix the problem of “punched” aromatic rings, because they lack the ability to break covalent bonds. Additionally, the procedure should take into consideration the common inaccuracies of the input models, for instance, distorted α-carbon geometries. Such distortions are often present in structures derived from clustering algorithms where the cluster centroid, which, on average, tends to be the most accurate in terms of the global root-mean-square-deviation from native 3, is used. However, the resulting Cα virtual bond distances and angles can be unphysical and need to be brought back to a native range.
Here, we present a method named PULCHRA (“Protein Chain Reconstruction Algorithm”) for the reconstruction of full-atom protein models. We have implemented the procedure as a standalone program written in C programming language. PULCHRA reads atom coordinates in PDB format and outputs full-atom PDB files. Typically, the reconstruction process takes about half a second for a 300-amino acid long protein. The program is a single executable and it doesn’t require any external data files.* The algorithm is not only fast, but also allows for different types of input protein model representation, multi-chain models, or chain breaks. Additionally, the user is allowed to largely control the reconstruction procedure since most of the algorithm parts can be switched off. The current program was developed independently from our previously published approach 4.
Methods
The method developed in the present work consists of several steps. First, input α–carbons are optimized using a simple force field and a steepest-descent minimization. Subsequently, the backbone nitrogen and carbonyl group atoms are reconstructed. The reconstructed backbone can be optimized in order to improve the hydrogen bond pattern. Next, the amino acid side chain heavy atoms are placed on the backbone. Then, the side chains are optimized to minimize possible atom-atom clashes. Finally, hydrogen atoms are added to the protein model. Each of these steps is optional and can be omitted. For example, it is not necessary to rebuild the backbone atoms before the side chains are placed.
The statistics for the backbone and side chain rotamer libraries were gathered from a representative list of 1351 high quality crystallographic protein structures with resolution better than 2.0 A, clustered at a level of 35% sequence identity.
Optimization of alpha-carbon positions
The positions of the α–carbon atoms are optimized using a steepest-descent gradient minimization algorithm and a simple harmonic potential. The potential (V) consists of the following terms: pairwise Cα-Cα distances, Cα-Cα-Cα virtual bond angles, Cα excluded volume, and the deviation from the initial positions (Eq.1):
| (1) |
where N is the number of Cα atoms; w1, w2, w3 and w4 are weights of the corresponding potential terms; di,i+1 is the distance between the ith and i+1th Cα atoms, d0 is the equilibrium Cα-Cα distance equal to 3.8 Å; θi,i+1,i+2 is the virtual bond angle involving the ith, i+1th, and i+2th Cα atoms; θ0 is the equilibrium angle, θ0=70° if θi,i+1,i+2<70°, θ0=150° if θi,i+1,i+2>150°, or θ0=θi,i+1,i+2 otherwise; dex is equal to 4 Å if di,j<4 Å or dex=di,j otherwise; di,i0 is the distance between the actual and initial alpha carbon positions, and if di,i0 is smaller than maximum allowed displacement threshold, du (default value: 0.5 Å), then di,i0 = du. The potential term weights, w1, w2, w3 and w4, were optimized by hand and are equal to 1.0, 2.0, 10.0, and 0.5, respectively.
Two special cases need to be treated differently. The first is cis-proline, where an equilibrium Cα-Cα distance is equal to 2.9 Å. The presence of a cis-proline can be determined from the initial Cα coordinates or can be explicitly defined by the user. The second case is the presence of chain breaks. The chain is considered broken if a distance between two consecutive Cα atoms is larger than a certain threshold (4.5 Å, by default). In such a case, distance and angle restraints are not calculated for the residues involved in the chain break (weights w1 and w2 in equation 1 are equal to 0).
After performing a steepest-descent minimization procedure (dV/dr → 0) the resulting structure has Cα-Cα distances and Cα-Cα-Cα angles close to native values, with the displacements from the initial positions controlled by the parameter du. Typically, less than 100 minimization steps are necessary for the procedure to converge. The optimized structure is always a compromise between local geometric correctness and the deviation from the initial structure. Sometimes, especially in the case of a heavily distorted input chain, the minimization procedure doesn’t converge, or the optimized model still exhibits irregularities. When such an event occurs, it is possible to restart the minimization from a random or fully extended chain conformation rather than from the initial coordinates.
If no alpha carbon coordinates are provided on input, their positions can be approximated from the side chain centers of mass (Eq.2):
| (2) |
and rescaled according to the average distance between the Cα and the side chain center of mass, CM (Eq.3):
| (3) |
In equations 2 and 3, ri is the position of the ith Cα, si is the position of the ith side chain center of mass, Ri is an average statistical Cα-CM distance for an amino acid at position i, |ri-si| is the distance between the ith amino acid Cα atom and the center of mass of its rotamer. Subsequently, the positions of the approximated Cα carbons are optimized, as described above.
Backbone reconstruction
The backbone reconstruction method is based on a refined version o an algorithm proposed by Milik et al. 5. The procedure requires four consecutive alpha carbon positions in order to rebuild the peptide bond atoms between the two central alpha carbons. The procedure works as follows: First, the distances between the first and third (r13), second and fourth (r24), and first and fourth (r14) alpha carbon atoms are calculated (Figure 1). Additionally, the sign of r14 corresponds to the local chirality of the chain. The native distributions of these distances are divided into a number of bins: 10 bins ranging from 4.5 to 7.5 Å for r13 and r24, and 75 bins ranging from −11 to 11 Å for r14. Next, each of the calculated distances is assigned to one of the bins. Subsequently, the bins are used to choose a proper fragment from a backbone fragment library (N, C, and O peptide bond atoms). Then, a local system of coordinates for every Cα atom is calculated, and the backbone atoms are transformed to the local coordinates and added to the chain. The local system of coordinates is defined by three orthogonal axes vx, vy, vz (Eq. 4):
| (4a) |
| (4b) |
| (4c) |
where rxy is a vector connecting the positions of the xth and yth alpha carbon atoms.
Figure 1.

Frame of reference used for reconstruction of the backbone and side chain atoms. The vectors r1, r2, and r3 are used to construct a local system of coordinates, vx, vy, and vz, according to equations 4a–c. The local system of coordinates is used to rebuild the backbone plate between the ith and i+1thα-carbons and the side chain atoms of the ithα-carbon. The distances r3, r4, and r5 are used to choose a proper side chain and peptide plate conformation from a fragment library.
Backbone optimization
Often, in the reconstructed backbone, its hydrogen bond pattern is distorted. The positions of the backbone atoms can be adjusted to optimize this pattern, especially in the regular secondary structure regions (α–helices and β–sheets). This simple optimization procedure calculates the hydrogen bond energy of every peptide plate with respect to its spatially closest neighbor using the hydrogen bond definition found in the DSSP program 6. The hydrogen bond energy of a hydrogen bond C-O ··· H-N is calculated according to a following formula:
| (5) |
where q1 = 0.42e and q2 = 0.20e, with e being the electron charge unit, rXY – the distance between atoms X and Y in angstroms, and EHB – the energy in kcal/mole. As the energy computation requires explicitly defined peptide bond hydrogen atoms, the hydrogen atoms positions are reconstructed at this stage.
For every consecutive Cα-Cα pair, the peptide bond atoms are rotated along the Cα-Cα virtual bonds within a (−10°, 10°) range using an angle step of 1° (Figure 2). The energy is calculated at each step, and if a better peptide plate orientation is found, then the old orientation is replaced by the new one. This procedure is repeated for every peptide plate.
Figure 2.
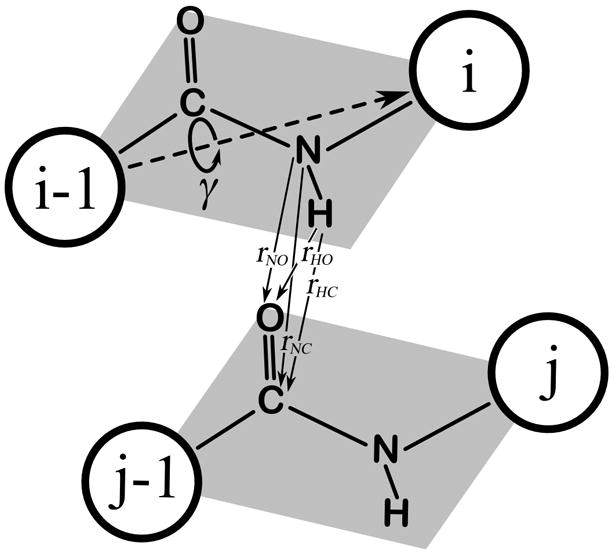
Hydrogen bond pattern optimization procedure. The peptide bond atoms are rotated around a virtual Cα-Cα bond, while the bond energy is calculated according to the DSSP formula (Eq.5). The optimal conformation within a (−10°, 10°) range of the γ angle is stored.
Side chain reconstruction
Even very simple side chain rebuilding algorithms can generate reasonable models comparable with results of more elaborate methods, as suggested elsewhere 7. The accuracy of side chain reconstruction can be significantly higher if positions of side chain centers of mass are present in the input data 8. Our side chain reconstruction procedure uses the same reference frame (local system of coordinates and set of distances) as the backbone reconstruction procedure (Figure 1). Therefore, both reconstruction procedures can be used independently, and it is not necessary to rebuild the backbone atoms before the side chains, contrary to most other side chain reconstruction methods. For every combination of calculated distance bins, there is a list of possible side chain conformations sorted according to the probability of occurrence in the Protein Data Bank, PDB 9. If no side chain center of mass information is given on input, the most probable conformer is used. Otherwise, the procedure reconstructs the side chain closest to the given side chain center of mass.
Side chain optimization
After the side chains are reconstructed, their positions can be fine-tuned to avoid possible heavy-atom clashes, while preserving the side chain – side chain packing. Two atoms are considered clashed if the distance between them is lower than 2 Å. The optimization procedure works as follows: First, the side chain rotamers are sorted according to the number of excluded volume violations, and processed in this order. Next, the rotamer library is searched for less-probable side chain conformations that match the previously calculated Cα frame of reference as closely as possible. The previous rotamer is replaced by a new one, and the excluded volume violations are checked again. This process is repeated iteratively until all clashes are removed, or a certain number of iterations are reached (default: 100 iterations). If the clashes are still present, the side chain is rotated around a virtual Cα-CM bond (Figure 3). This simple procedure works surprisingly well. Usually, over 95% of the initial clashes are removed, while the pattern of side chain side chain contacts remains very similar (over 85% of the contacts are preserved).
Figure 3.

Optimization of side chain positions. The side chain is rotated by an angle γ around a Cα-CM vector until the total number of clashes with other heavy atoms is minimized. Additionally, the χ1 angle is calculated and tested against the allowed range to exclude nonphysical side chain conformations.
The problem of punched aromatic rings due to penetration of the aromatic ring by other side chain heavy atoms is a more serious issue (Figure 4). This kind of nonphysical arrangement can’t be easily solved using molecular mechanics minimization; therefore, such models are often useless in subsequent molecular dynamics simulations. Similarly as above, the rotamer library is scanned to find closest rotamer conformation that avoids the punch. Our algorithm tries to minimize the possibility of punched ring occurrence, even at the cost of excluded volume violations. If, despite reaching a pre-set number of iterations, the problem can’t be fixed – the optimization is stopped and the problem is reported to the user.
Figure 4.

Example of a punched ring. The arginine side chain is threaded through a phenylalanine aromatic ring. The n vector is the ring plane normal, and r1 and r2 are vectors connecting the ring center, c, with the Cγ and Cδ atoms of an arginine side chain. The signs of scalar products of n and r vectors determine the positions of the atoms with respect to the ring plane. If two atoms are positioned on alternate sides of the ring, within a certain distance from a ring center, the ring is considered to be punched by the side chain.
Additionally, the structure is checked for possible chirality errors (occurrence of D amino acid conformations). To perform this check, the improper dihedral angle involving the Cα-N-C-Cβ atoms is calculated. In L amino acid conformations, this angle is right-handed and is close to 34 degrees. In D amino acids, the angle value is negative (the angle is left-handed). If a D amino acid occurs, the side chain is flipped over the N-Cα-C plane, so that the amino acid conformation is inverted.
Hydrogen atom reconstruction
In the final step, hydrogen atoms can optionally be added to the full-atom representation. The positions of the hydrogen atoms are calculated according to the heavy atom types and their hybridization states. While possible clashes with heavy atoms are not checked at this stage, a subsequent molecular minimization procedure usually solves this problem whenever it occurs.
Results
We compared the performance of PULCHRA with two popular side chain reconstruction programs, SCWRL 3.0 10 and SCATD 1.0 11. Both programs use a backbone-dependent rotamer library 12, but the SCATD algorithm is faster and less prone to problems with inaccurate input structures. In contrast to PULCHRA, both algorithms expect an all-atom backbone structure on input. Also, the programs don’t attempt to regularize the backbone geometry nor solve punched rings.
The overall accuracy of heavy atom reconstruction was assessed using 30 high-quality crystallographic structures of resolution better than 1.0 Å, extracted from a recent edition of representative protein structure database clustered at 25% sequence identity level 13. Complete backbone coordinates were taken from the native structures. After reconstruction, we calculated the root mean square deviation (RMSD) of the best superposition of all heavy atoms between the reconstructed model and the native structure (Table I). When the Cα coordinates were used as input, the average all atom RMSD was equal to 1.53 Å. When information about side chain CM was added, the all heavy atom RMSD from the native structure decreased to 0.97 Å. The all-atom RMSD from native conformation calculated using SCWRL and SCATD programs was equal to 1.11 Å and 1.22 Å, respectively. PULCHRA was the fastest out of all three programs, with an average reconstruction time per protein equal to 0.8 s, compared to 2.4 s and 1.3 s in case of SCWRL and SCATD, respectively.
Table I.
Comparison of side chains reconstruction quality between PULCHRA, SCWRL and SCATD.
| Protein PDB code | Resolution (Å) | Length (AA) | All-atom RMSD (starting from a native backbone) |
|||
|---|---|---|---|---|---|---|
| PULCHRA using Cα only | PULCHRA using Cα + CM | SCWRL | SCATD | |||
| 1ejgA | 0.54 | 46 | 0.948 | 0.766 | 0.862 | 1.377 |
| 1et1A | 0.90 | 34 | 1.803 | 0.838 | 1.675 | 1.765 |
| 1f9yA | 0.89 | 158 | 1.655 | 0.995 | 1.152 | 1.311 |
| 1g66A | 0.90 | 207 | 1.350 | 1.008 | 0.910 | 0.914 |
| 1ix9A | 0.90 | 205 | 1.647 | 1.087 | 1.170 | 1.328 |
| 1iqzA | 0.92 | 81 | 1.378 | 0.806 | 1.060 | 1.038 |
| 1iuaA | 0.80 | 83 | 1.303 | 0.952 | 0.918 | 0.965 |
| 1lugA | 0.95 | 259 | 1.615 | 1.120 | 1.109 | 1.226 |
| 1m40A | 0.85 | 263 | 1.621 | 1.095 | 1.296 | 1.365 |
| 1mc2A | 0.85 | 122 | 1.660 | 1.060 | 1.247 | 1.318 |
| 1mj5A | 0.95 | 297 | 1.718 | 1.099 | 1.170 | 1.433 |
| 1n4wA | 0.92 | 498 | 1.534 | 1.001 | 1.164 | 1.268 |
| 1n55A | 0.83 | 249 | 1.515 | 0.831 | 1.035 | 1.073 |
| 1nwzA | 0.82 | 125 | 1.619 | 0.944 | 1.173 | 1.319 |
| 1ok0A | 0.93 | 74 | 1.518 | 0.958 | 1.226 | 1.257 |
| 1p9gA | 0.84 | 41 | 1.472 | 1.136 | 1.113 | 1.220 |
| 1pjxA | 0.85 | 314 | 1.643 | 1.062 | 1.085 | 1.133 |
| 1pq7A | 0.80 | 224 | 1.404 | 0.798 | 0.787 | 0.956 |
| 1r6jA | 0.73 | 82 | 1.325 | 0.861 | 0.859 | 0.925 |
| 1rtqA | 0.95 | 291 | 1.536 | 0.839 | 1.126 | 1.049 |
| 1ucsA | 0.62 | 64 | 1.545 | 1.023 | 0.872 | 0.967 |
| 1us0A | 0.66 | 313 | 1.742 | 0.992 | 1.220 | 1.260 |
| 1v6pA | 0.87 | 62 | 1.523 | 1.047 | 1.360 | 1.467 |
| 1vyrA | 0.90 | 363 | 1.631 | 1.012 | 1.006 | 1.132 |
| 1w0nA | 0.80 | 120 | 1.455 | 0.912 | 1.008 | 0.979 |
| 1wy3A | 0.95 | 35 | 1.897 | 1.236 | 1.458 | 1.718 |
| 1x8qA | 0.85 | 184 | 1.621 | 0.993 | 1.203 | 1.343 |
| 2bt9C | 0.94 | 88 | 1.410 | 1.022 | 1.052 | 1.309 |
| 2pvbA | 0.91 | 107 | 1.477 | 0.749 | 1.075 | 1.182 |
| 7a3hA | 0.95 | 300 | 1.425 | 0.715 | 0.974 | 1.073 |
|
| ||||||
| Average: | 1.533 | 0.965 | 1.112 | 1.222 | ||
Separately, we tested backbone reconstruction accuracy by PULCHRA. The average RMSD from native structures calculated over the reconstructed backbone atoms only was equal to 0.50 Å. Subsequent application of a backbone optimization procedure slightly improved the backbone RMSD by 0.007 Å, while average DSSP hydrogen bond energy dropped by 29.4 kcal/mol (Table II).
Table II.
Quality of backbone reconstruction and optimization tested on 30 high resolution native structures.
| Protein PDB code | PULCHRA backbone RMSD before optimization (A) | PULCHRA backbone RMSD after optimization (A) | DSSP energy change during backbone optimization (kcal/mol) |
|---|---|---|---|
| 1ejgA | 0.470 | 0.466 | −14.3 |
| 1et1A | 0.310 | 0.337 | −12.6 |
| 1f9yA | 0.461 | 0.462 | −16.2 |
| 1g66A | 0.543 | 0.535 | −3.3 |
| 1ix9A | 0.494 | 0.490 | −11.3 |
| 1iqzA | 0.471 | 0.469 | −21.4 |
| 1iuaA | 0.551 | 0.525 | −9.8 |
| 1lugA | 0.518 | 0.511 | −61.2 |
| 1m40A | 0.475 | 0.474 | −11.4 |
| 1mc2A | 0.544 | 0.546 | −9.3 |
| 1mj5A | 0.585 | 0.580 | −10.9 |
| 1n4wA | 0.493 | 0.487 | −36.8 |
| 1n55A | 0.409 | 0.404 | −52.0 |
| 1nwzA | 0.485 | 0.467 | −62.3 |
| 1ok0A | 0.494 | 0.468 | −47.5 |
| 1p9gA | 0.535 | 0.516 | −65.4 |
| 1pjxA | 0.579 | 0.567 | −56.5 |
| 1pq7A | 0.543 | 0.536 | −45.5 |
| 1r6jA | 0.465 | 0.464 | −39.8 |
| 1rtqA | 0.435 | 0.429 | −4.33 |
| 1ucsA | 0.574 | 0.546 | −39.5 |
| 1us0A | 0.401 | 0.406 | −39.8 |
| 1v6pA | 0.578 | 0.553 | −50.2 |
| 1vyrA | 0.507 | 0.505 | −50.2 |
| 1w0nA | 0.542 | 0.538 | −24.9 |
| 1wy3A | 0.663 | 0.663 | −28.2 |
| 1x8qA | 0.458 | 0.445 | −21.0 |
| 2bt9C | 0.627 | 0.624 | −13.9 |
| 2pvbA | 0.388 | 0.381 | −8.1 |
| 7a3hA | 0.428 | 0.424 | −17.0 |
|
| |||
| Average: | 0.501 | 0.494 | −29.4 |
To check our method in a real-life application, we performed a test on 500 decoy structures randomly chosen from a genomic-scale Monte Carlo protein structure prediction benchmark 3. These structures are simulation models closest to average cluster centroids and their local geometry is often seriously distorted. The RMSD from the native structures ranged from 1.1 Å to 25 Å. The reconstructed structures with optimized Cα positions have slightly higher RMSD to native structures than the initial decoy structures. On average, the difference is equal to 0.18 Å. However, in contrast to the initial decoys, local distances and angles in the optimized structures are in the range of the physically acceptable values. After optimizing alpha carbon positions and rebuilding the backbone by PULCHRA, the models were subject to side chain reconstruction using the three programs. The reconstruction accuracy of all three methods was comparable: the average all-atom RMSD from the native, calculated over the reconstructed decoy set, was equal to 10.18 Å, 10.21 Å, and 9.89 Å, for PULCHRA, SCATD, and SCWRL, respectively. PULCHRA calculations took 1.3 s per protein, while SCATD calculations took 2.4 s, and SCWRL took 28.8 s. Sometimes, the SCWRL calculations took a very long time; therefore the program was stopped after running for more than one minute. This was the case for 37 out of 500 decoys. Out of 500 reconstructed decoys, PULCHRA generated 6 cases of unfixed punched rings or excluded volume violations in the output models. SCWRL generated 70 cases of punched rings, and SCATD generated 130 such cases. The detected problems usually were related to side chain – backbone overlap in seriously distorted parts of the input chains.
Conclusions
Reconstruction of an all-atom representation of a predicted protein’s structure is an important part of the protein structure modeling pipeline. Here, we introduce PULCHRA, a fast and robust tool for the reconstruction of full-atom models. We have demonstrated that the program can handle even seriously distorted input structures, still being able to generate reasonable full-atom models. The quality of the rebuilt models is satisfactory, and the reconstructed structures can be directly used for further refinement with molecular mechanics programs. The program can handle incomplete structures that have gaps in the Cα chain. If information about the side chain centers of mass is available, the reconstruction accuracy increases significantly. In addition, PULCHRA can process entire molecular simulation trajectories (in a form of multi-model PDB files,) as well as protein quaternary structures (multi-chain models). Also, the program preserves input information (such as atom numbering, PDB chain labels, or any pre-existing atom coordinates). The calculations can be sped-up by switching off certain parts of the algorithm. For example, disabling the initial Cα position optimization routine reduces the computation time by 20–50%, depending on the degree of distortion of the initial coordinates. PULCHRA was successfully employed as a part of a structure modeling pipeline during the CASP7 experiment 1.
Acknowledgments
PR would like to thank Liliana Wroblewska for helpful discussions and extensive testing of the PULCHRA program. This work was supported in part by NIH grant No. GM-37408 of the Division of General Medical Sciences of the National Institutes of Health.
Footnotes
PULCHRA is available for download from our website: http://cssb.biology.gatech.edu/skolnick/files/PULCHRA
References
- 1.Zhou H, Pandit SB, Lee SY, Borreguero J, Chen H, Wroblewska L, Skolnick J Proteins. 2007 doi: 10.1002/prot.21649. [DOI] [PubMed] [Google Scholar]
- 2.Wroblewska L, Skolnick J. J Comput Chem. 2007;28(12):2059–2066. doi: 10.1002/jcc.20720. [DOI] [PubMed] [Google Scholar]
- 3.Zhang Y, Skolnick J. Proc Natl Acad Sci. 2004;101(20):7594–7599. doi: 10.1073/pnas.0305695101. [DOI] [PMC free article] [PubMed] [Google Scholar]
- 4.Feig M, Rotkiewicz P, Kolinski A, Skolnick J, Brooks CLI. Proteins: Struct Funct Genet. 2000;41:86–97. doi: 10.1002/1097-0134(20001001)41:1<86::aid-prot110>3.0.co;2-y. [DOI] [PubMed] [Google Scholar]
- 5.Milik M, Kolinski A, Skolnick J. J Comput Chem. 1997;18:80–85. [Google Scholar]
- 6.Kabsch W, Sander C. Biopolymers. 1983;22(12):2577–2637. doi: 10.1002/bip.360221211. [DOI] [PubMed] [Google Scholar]
- 7.Samudrala R, Huang SE, Koehl P, Levitt M. Protein Eng. 2000;13(7):453–457. doi: 10.1093/protein/13.7.453. [DOI] [PubMed] [Google Scholar]
- 8.Ka mierkiewicz R, Liwo A, Scheraga HA. Biophys Chem. 2003;100(1–3):261–280. doi: 10.1016/s0301-4622(02)00285-5. [DOI] [PubMed] [Google Scholar]
- 9.Berman HM, Westbrook J, Feng Z, Gilliland G, Bhat TN, Weissig H, Shindyalov IN, Bourne PE. Nucl Acid Res. 2000;28(1):235–242. doi: 10.1093/nar/28.1.235. [DOI] [PMC free article] [PubMed] [Google Scholar]
- 10.Canutescu AA, Shelenkov AA, Dunbrack RLJ. Protein Science. 2003;12:2001–2014. doi: 10.1110/ps.03154503. [DOI] [PMC free article] [PubMed] [Google Scholar]
- 11.Xu J. Lecture Notes in Computer Science. 2005;3500:423–439. [Google Scholar]
- 12.Dunbrack RLJ, Karplus M. J Mol Biol. 1993;230:543–574. doi: 10.1006/jmbi.1993.1170. [DOI] [PubMed] [Google Scholar]
- 13.Hobohm U, Sander C. Prot Sci. 1994;3(3):522–524. doi: 10.1002/pro.5560030317. [DOI] [PMC free article] [PubMed] [Google Scholar]