

Abstract
A sensitive and specific method is presented to simultaneously quantify methadone, heroin, cocaine and metabolites in sweat. Drugs were eluted from sweat patches with sodium acetate buffer, followed by SPE and quantification by GC/MS with electron impact ionization and selected ion monitoring. Daily calibration for anhydroecgonine methyl ester, ecgonine methyl ester, cocaine, benzoylecgonine (BE), codeine, morphine, 6-acetylcodeine, 6-acetylmorphine (6AM), heroin (5–1000 ng/patch) and methadone (10–1000 ng/patch) achieved determination coefficients of >0.995, and calibrators quantified to within ±20% of the target concentrations. Extended calibration curves (1000–10,000 ng/patch) were constructed for methadone, cocaine, BE and 6AM by modifying injection techniques. Within (N=5) and between-run (N=20) imprecisions were calculated at six control levels across the dynamic ranges with coefficients of variation of <6.5%. Accuracies at these concentrations were ±11.9% of target. Heroin hydrolysis during specimen processing was <11%. This novel assay offers effective monitoring of drug exposure during drug treatment, workplace and criminal justice monitoring programs.
Keywords: Sweat, GC/MS, Methadone, Cocaine, Opiates, Heroin
Introduction
In recent years, alternative biological matrices—oral fluid, sweat and hair—have been widely investigated in driving under the influence, drug treatment, criminal justice, and workplace drug-testing programs [1–4]. Although analyses of alternate matrices frequently involve more sophisticated and time-consuming techniques than traditional blood or urine analysis, unique data can be obtained that can improve drug exposure history interpretation. Drug detection windows may be longer: up to 1–2 weeks for sweat and even months to years for hair. Sweat testing offers a cumulative picture of drug use over an extended timeframe and noninvasive specimen collection. Another advantage includes a reduction in the potential for specimen adulteration; homeostatic mechanisms preclude the dilution (a method commonly used in urine testing to produce false negative results) of drug concentrations in sweat.
Sweat has been proposed as an acceptable matrix for drug testing in the Substance Abuse Mental Health Service’s Administration’s (SAMHSA) Mandatory Guidelines for Federal Workplace Drug Testing [5]. Sweat patches, employed for specimen collection, resemble a Band-Aid® that is applied to the back, upper arm or lower chest and is generally worn for about seven days. The collection device consists of an absorbent cellulose pad attached to a thin, transparent polyurethane membrane. The nonocclusive, semipermeable membrane allows oxygen, carbon dioxide and water vapor to escape. The absorbent pad retains the nonvolatile components of sweat, such as salts and proteins and parent drug and metabolites. The waterproof membrane resists environmental contaminants, but it is essential to thoroughly clean the skin prior to patch application. The patch is removed and the absorbent pad analyzed for possible drug content.
The passive diffusion of drugs from blood into sweat glands and the excretion of sweat onto the skin surface account for the majority of drugs in sweat. An ion-trapping phenomenon occurs when basic drugs diffuse into sweat and become ionized at the lower pH of sweat [6], leading to drug accumulation. Other proposed mechanisms include the excretion of substances via sebum and trans- and intercellular diffusion, but these contribute less and show a longer delay before the appearance of the drugs [7]. Excretion in sweat is dependent upon the drug’s physiochemical characteristics, including molecular mass, pKa, protein binding and lipophilicity. Parent drugs are more likely to be encountered in sweat than polar hydrophilic metabolites [8].
In most controlled drug administration research on drug excretion in sweat, dose–concentration relationships have not been observed, suggesting that sweat testing is qualitative rather than quantitative. The extended drug detection window of sweat testing is one of the primary reasons for its effectiveness as a deterrent to drug use and its value in drug treatment, criminal justice and workplace drug testing programs. Sweat testing is of particular interest in heroin treatment programs, as it allows compliance with methadone or buprenorphine treatment to be monitored while simultaneously revealing illicit drug use [3, 9].
Analytical methods for measuring opiates [8, 10, 11], cocaine [12, 13], amphetamines [14, 15], cannabinoids [16, 17] and substitution medications like buprenorphine [18] or methadone [9, 19, 20] in sweat are available. Kintz et al. developed a method for determining four major drug classes (opiates, cocaine, amphetamines and THC), two benzodiazepines and buprenorphine; however, methadone was not included [18]. Skopp et al. modified a method originally applied to hair to analyze methadone, EDDP, cocaine and opiates in sweat [9], while Cone et al. adapted an assay for heroin, cocaine and metabolites in oral fluid and blood for sweat testing [8]. Other methods specifically targeted one or two drug classes, i.e., cocaine and opiates [6], amphetamines [21], cannabinoids [22] or methadone [20]. As only one extraction per sweat patch is possible, our objective was to develop and validate a rugged and sensitive analytical method for multiple classes of drugs from a single sweat patch. In addition to heroin and 6-acetylmorphine (6AM), frequently encountered in sweat, we also incorporated 6-acetylcodeine (6AC) and anhydroecgonine methyl ester (AEME) into our method. 6AC is an effective biomarker of illicit street heroin abuse for patients in pharmaceutical heroin treatment [23, 24], and although 6AC is only present in small quantities in street heroin, its lipophilic nonpolar structure make it an interesting analyte to monitor in sweat. To the best of our knowledge, no 6AC sweat excretion data are available. Relatively high concentrations of AEME in sweat have been reported [25].
We developed and validated a solid-phase extraction gas chromatography–mass spectrometry (GC/MS) method for the simultaneous quantification of methadone, heroin, cocaine and metabolites in sweat. To document the usefulness of the assay for monitoring subjects in drug abuse treatment, results are presented for a heroin user undergoing methadone treatment.
Materials and methods
Chemicals and reagents
AEME, ecgonine methyl ester (EME), methadone, cocaine, benzoylecgonine (BE), codeine, morphine, 6AC, 6AM, heroin (1 mg/mL) and the internal standards cocaine-d3 and heroin-d9 (100 μg/mL) were purchased from Cerilliant Corporation (Round Rock, TX, USA). AEME-d3 and 6AC-d3 (100 μg/mL) were obtained from Lipomed Inc. (Cambridge, MA, USA). In addition, the potential interferents acetaminophen, acetylsalicylic acid, phencyclidine, Δ9-tetrahydrocannabinol, 11-hydroxy-Δ9-tetrahydrocannabinol, 11-nor-9-carboxy-Δ9-tetrahydrocannabinol, pseudoephedrine, hydromorphone, oxymorphone, hydrocodone, oxycodone, phenylpropanolamine, phentermine, diphenhydramine, brompheniramine, fenfluramine, chlorpheniramine, normorphine, norcodeine, norcocaine, m-hydroxycocaine, p-hydroxycocaine, norbenzoylecgonine, m-hydroxybenzoylecgonine, p-hydroxybenzoylecgonine, ecgonine ethyl ester, cocaethylene, norcocaethylene, EMDP, EDDP, methadol, caffeine, nicotine, pentazocine, clonidine, ibuprofen, ketamine, dextromethorphan, gamma hydroxyl butyrate, amphetamine, methamphetamine, p-methoxyamphetamine, p-methoxymethamphetamine, 3,4-methylenedioxyamphetamine, 3,4-methylenedioxymethamphetamine, 3, 4-methylenedioxyethylamphetamine, 3-hydroxy-4-methoxymethamphetamine, and 3-hydroxy-4-methoxyamphetamine also were acquired from Cerilliant Corporation.
N,O-bis(trimethylsilyl)trifluoroacetamide with 1% trimethylchlorosilane (BSTFA-TMCS) was purchased from Pierce Chemical Co. (Rockford, IL, USA); Clean Screen® ZSDAU020 (10 mL/200 mg) extraction columns were from United Chemical Technologies (Bristol, PA, USA); and acetic acid, sodium acetate, ammonium hydroxide, sodium chloride, sodium hydroxide, urea, methylene chloride, 2-propanol, methanol, ethyl acetate and acetonitrile were from JT Baker (Phillipsburg, NJ, USA). Ammonium chloride, triethylamine and lactic acid were obtained from Sigma-Aldrich (St. Louis, MO, USA). Organic solvents were HPLC-grade. PharmCheck™ sweat patches were supplied by PharmChem Inc. (Fort Worth, TX, USA).
Artificial sweat solution contained 327 mmol/L ammonium chloride, 166 mmol/L lactic acid, 83 mmol/L urea, 42 mmol/L acetic acid, 34 mmol/L sodium chloride in deionized water; pH was adjusted to 4.7 with 2 mol/L sodium hydroxide.
Calibrators and quality control samples
Stock 1 mg/mL solutions of AEME, EME, methadone, cocaine, BE, codeine, morphine, 6AC, and 6AM were combined and diluted with methanol to yield working low calibrator solutions (0.05, 0.1, 0.25, 0.5, 1.0, 2.5, 5.0, and 10.0 μg/mL). Additional stock 1 mg/mL methadone, cocaine, BE, and 6AM were combined and diluted with acetonitrile to yield high calibrator solutions (25.0, 50.0, 75.0 and 100 μg/mL). Working calibrator solutions were added to blank sweat patches to create daily calibration curves for up to 1000 ng/patch for AEME, EME, EMDP, codeine, morphine, and 6AC, and for up to 10,000 ng/patch for methadone, cocaine, BE and 6AM. Quality control (QC) solutions were prepared from different stocks and diluted to 0.15, 1.5, 7.5 μg/mL (for solutions containing all analytes) and to 15.0, 30.0 and 80.0 μg/mL (for solutions containing methadone, cocaine, BE and 6AM). Calibrators and QCs were prepared independently for heroin. 1 mg/mL heroin was diluted with acetonitrile to yield working calibrator solutions (0.1, 1.0 and 10.0 μg/mL). QCs were prepared from a different stock heroin solution and diluted to 0.15, 1.5, 7.5 μg/mL. Deuterated AEME, cocaine, 6AC and heroin were diluted in acetonitrile to produce a working 1 μg/mL solution containing all analogs. Solutions were stored in amber glass vials at −20 °C.
Unused drug-free sweat patches were evenly moistened on the pad with 750 μL of artificial sweat and allowed to dry for 2 h at room temperature. To prepare daily calibration curves, patches were spiked with standard solutions (100 μL) yielding concentrations of 5, 10, 25, 50, 100, 250, 500, 1000 ng/patch for all analytes. Additional patches at 2500, 5000, 7500 and 10,000 ng/patch for methadone, cocaine, BE and 6AM were fortified with high calibrator solutions. Internal standards were added to each patch at concentrations of 100 ng/patch.
Control patches also were prepared daily by spiking with low control solutions to yield concentrations of 15, 150 and 750 ng/patch for all analytes. Additional QCs at 1500, 3000 and 8000 ng/patch for methadone, cocaine, BE and 6AM, were prepared from high control solutions. After fortification, all patches were allowed to air-dry at room temperature for 30 min. Similar calibrator (5, 10, 25, 50, 100, 250, 500, 1000 ng/patch) and control (15, 150 and 750 ng/patch) concentrations were prepared daily for heroin analysis.
Extraction and derivatization procedure
Sweat patches containing spiked calibrators, QC samples or clinical specimens were folded twice and placed into 17 mm×60 mm screw-top vials. Six milliliters of 0.5 M sodium acetate buffer (pH 4.0) were added, caps were secured, and vials shaken on a horizontal reciprocating shaker (250 rpm) for 10 min. Extracted buffer was transferred into a 10 mL disposable conical tube. The same procedure was repeated with an additional 3 mL buffer, and the contents combined. A portion of the buffered extract (5 mL) was applied to a Clean Screen® ZSDAU020 extraction column preconditioned with 3 mL acetonitrile, 3 mL distilled water and 1 mL of 0.5 M sodium acetate buffer (pH 4.0). The remaining fraction of buffered extract was stored at 4 °C for further analysis of heroin, if needed. SPE columns were washed sequentially with 3 mL distilled water, 1 mL of 0.1 M acetic acid and 3 mL acetonitrile, and dried for 5 min at full vacuum. Analytes of interest were eluted into clean 5 mL centrifuge tubes with three 1 mL aliquots of freshly prepared elution solvent, methylene chloride:2-propanol:ammonium hydroxide (78/20/2, v/v/v). Eluates were evaporated under nitrogen at 35 °C, and reconstituted with 35 μL BSTFA/TMCS. Tubes were capped, vortex-mixed and heated for 20 min at 60 °C. After cooling, the tubes were vortex-mixed briefly and the samples transferred to crimp-capped autosampler vials.
A 3 mL aliquot of the remaining buffered extract from patches spiked with heroin (calibrators and QCs) or from clinical specimens positive for 6AM was applied to a preconditioned Clean Screen® ZSDAU020 extraction column. SPE columns were washed and dried for 5 min at full vacuum. Heroin was eluted into clean 5 mL centrifuge tubes with three 0.5 mL aliquots of freshly prepared elution solvent, ethylacetate:triethylamine (98/2, v/v). Elution solvent was kept at −20 °C prior to use. Eluates were evaporated under nitrogen at 35 °C, taking care that the evaporation occurred as quickly as possible to prevent the hydrolysis of heroin. Dried extracts were reconstituted with 35 μL of BSTFA/TMCS, and transferred to autosampler vials.
Chromatographic and detection system conditions
Quantitative analyses were performed on an Agilent 6890 gas chromatograph interfaced with an Agilent 5973 mass-selective detector operated in electron impact mode (Agilent Technologies, Wilmington, DE, USA). The temperatures of the quadrupole, ion source and mass selective detector interface were 150, 230 and 280 °C, respectively. A split–splitless capillary inlet system was operated in splitless mode for low calibrators, controls and initial sample injections (2 μL), or in split mode (1:10) for high calibrators, QCs and reinjection of specimens when quantifying above 1000 ng/patch (1 μL injected). The injection port temperature was maintained at 200 °C. An initial oven temperature of 100 °C was held for 0.5 min, followed by ramps of 25 °C/min to 245 °C, 2 °C/min to 255 °C and 30 °C/min to a final temperature of 300 °C for 0.7 min. Chromatographic separation was achieved within 13.5 min with a HP-5MS capillary column (30 m×0.32 mm i.d.×0.25 μm film thickness) and high purity helium (99.999%) as carrier gas at a flow of 1.1 mL/min. An alternate oven temperature program and injector conditions were used for heroin analysis. An initial oven temperature of 180 °C was held for 0.5 min, followed by a ramp of 25 °C/min to 300 °C, holding for 1.2 min. Sample injection was performed in the pulsed splitless mode with a 3 μL injection volume, a pulse pressure of 20 psi and a pulse time of 0.5 min. Chromatographic separation was achieved in 6.5 min with a carrier gas flow of 1.5 mL/min. Mass selective detection was achieved by operating in the selected ion monitoring mode with an electron multiplier at 100 V relative to the daily tuning parameter. The mass defect for all target ions was determined daily utilizing an unextracted standard and a mass resolution of 0.1 amu. Three ions for each analyte and two for each internal standard were monitored. A list of retention times, monitored ions and dwell times is presented in Table 1. Daily maintenance of the gas chromatograph/mass spectrometer included clipping the GC column and replacing the injector septum, liner and gold seal.
Table 1.
Analytes, internal standards, retention times, dwell times and quantification and qualifier ions of methadone, cocaine, opiates and metabolites as well as heroin in human sweat
| Retention time (min) | Dwell time (ms) | Target ion (m/z) | Qualifier ions (m/z) |
||
|---|---|---|---|---|---|
| 1 | 2 | ||||
| a. Analysis of methadone, cocaine, opiates and metabolites in human sweat | |||||
| AEME-d3a | 4.24 | 20 | 155 | 184 | – |
| AEME | 4.25 | 20 | 152 | 181 | 120 |
| EME | 5.12 | 20 | 82 | 271 | 182 |
| Methadone | 7.95 | 20 | 294 | 165 | 178 |
| Cocaine-d3b | 8.32 | 20 | 185 | 306 | – |
| Cocaine | 8.33 | 20 | 182 | 303 | 198 |
| Benzoylecgonine | 8.79 | 20 | 240 | 361 | 346 |
| Codeine | 10.37 | 40 | 371 | 234 | 178 |
| Morphine | 10.92 | 40 | 429 | 414 | 401 |
| 6-Acetylcodeine-d3c | 11.07 | 40 | 344 | 285 | – |
| 6-Acetylcodeine | 11.10 | 40 | 341 | 282 | 229 |
| 6-Acetylmorphine-d6d | 11.59 | 40 | 405 | – | – |
| 6-Acetylmorphine | 11.62 | 40 | 399 | 324 | 204 |
| Heroin-d9 | 12.20 | 40 | 378 | 334 | – |
| b. Analysis of heroin in human sweat | |||||
| Heroin-d9e | 5.79 | 20 | 378 | 334 | – |
| Heroin | 5.82 | 20 | 369 | 327 | 310 |
AEME-d3 utilized as internal standard for AEME and EME
Cocaine-d3 utilized as internal standard for methadone, cocaine and benzoylecgonine
6-Acetylcodeine-d3 utilized as internal standard for codeine, morphine, 6-acetylcodeine and 6-acetylmorphine
6-Acetylmorphine-d6 ion used to monitor heroin-d9 hydrolysis
Heroin-d9 utilized as internal standard for heroin
Data analysis
Analytes were identified by comparing retention times (±0.15 minutes) and qualifier ion ratios (±20%) to corresponding average values of calibrators assayed in the same batch. Peak abundance ratios of analytes to corresponding internal standards were calculated for each concentration. Daily calibration was performed with Agilent MSD Chemstation software (v. D.00.00). Data were fit to a linear least-squares regression curve with a 1/x weighting factor. In addition, calibrator concentrations calculated against the full calibration curve were required to be within 20% of target. Two calibration curves were established for several analytes to encompass the concentrations of drugs expected in sweat patches. A daily calibration curve also was constructed in each batch for heroin (from 5 to 1000 ng/patch) with calibrators injected in pulsed splitless mode (3 μL).
Method validation and acceptance criteria
The method was validated by determining specificity, sensitivity, linearity, carryover, accuracy, imprecision (intra-and inter-assay), extraction efficiency, stability and potential conversion of analytes during specimen processing.
Specificity
Specificity was defined as the ability to identify and quantify an analyte with and without endogenous or exogenous potential interferences. Blank sweat patches (N=6) were worn by six drug-free volunteers to verify the absence of potential endogenous interferents or adverse matrix effects. In addition, this method was challenged with 47 potentially interfering substances including structurally similar or commonly co-administered compounds, metabolites and over-the-counter medications. Extraction buffer (9 mL) containing 15 ng of the different analytes of interest were spiked to contain 1000 ng/9 mL acetaminophen, acetylsalicylic acid, phencyclidine, Δ9-tetrahydrocannabinol, 11-hydroxy-Δ9-tetrahydrocannabinol, 11-nor-9-carboxy-Δ9-tetrahydrocannabinol, pseudoephedrine, hydromorphone, oxymorphone, hydrocodone, oxycodone, phenylpropanolamine, phentermine, diphenhydramine, brompheniramine, fenfluramine, chlorpheniramine, normorphine, norcodeine, norcocaine, m-hydroxycocaine, p-hydroxycocaine, norbenzoylecgonine, m-hydroxybenzoylecgonine, p-hydroxybenzoylecgonine, ecgonine ethyl ester, cocaethylene, norcocaethylene, EDDP, EMDP, methadol, caffeine, nicotine, pentazocine, clonidine, ibuprofen, ketamine, dextromethorphan, gamma hydroxyl butyrate, amphetamine, methamphetamine, p-methoxyamphetamine, p-methoxymethamphetamine, 3,4-methylene-dioxyamphetamine, 3,4-methylenedioxymethamphetamine, 3,4-methylenedioxyethylamphetamine, 3-hydroxy-4-methoxymethamphetamine, and 3-hydroxy-4-methoxyamphetamine. After extraction of the spiked buffer, each analyte of interest was required to be adequately resolved from other analytes and interferents, to have acceptable chromatographic parameters and to have a quantitative analyte concentration that was within 20% of the expected concentration.
Sensitivity and linearity
Assay sensitivity was evaluated in triplicate by determining the limits of detection (LOD) and quantification (LOQ) for each analyte. LOD was defined as the lowest concentration with acceptable peak shape, chromatographic resolution, retention time (±0.15 min from target), qualifier ion ratios (within ±20% of average calibrator ion ratios), and a signal-to-noise (determined by peak height) of at least 3:1. LOQ was defined as the lowest calibrator that meets the LOD criteria and has analyte concentrations that are within ±20% of the target concentration.
Daily calibration curves were prepared by analyzing unworn sweat patches premoistened with artificial sweat and spiked to contain 5, 10, 25, 50, 100, 250, 500, 1000, 2500, 5000, 7500 and 10,000 ng/patch for the analytes of interest. Linearity was determined by the method of least squares with a 1/x weighting factor and expressed as the determination coefficient (R2). Each point on the calibration curve was required to have acceptable chromatography, ion ratios had to be within ±20% of the average of all calibrators, and the quantification to be within 20% of the target when calculated against the full calibration curve.
Carryover
Potential carryover in the chromatographic system was evaluated in each batch by analyzing a negative sample (blank sweat patch with internal standard) after the highest calibrator containing all analytes (1000 ng/patch). In addition, the highest calibrator containing methadone, cocaine, BE and 6AM (10,000 ng/patch) was injected in splitless mode (N=3) immediately preceding a negative sample. Potential carryover was assessed by quantifying analytes in the negative sample.
Accuracy and imprecision
Accuracy and imprecision were evaluated over the linear range using three QC samples at target concentrations of 15, 150, 750 ng for all analytes, and three QC samples at 1500, 3000, and 8000 ng/patch in the high curve for methadone, cocaine, BE and 6AM. Intra-assay data were collected from five replicates at each concentration within one analytical run. Inter-assay data were evaluated for five replicates at each concentration over four days (Ntotal=20). Data were evaluated using one-way analysis of variance with day as the grouping variable. Accuracy, expressed as a percentage, was determined by comparing mean calculated and target concentrations and multiplying by 100.
Extraction efficiency
Extraction efficiency was determined at low QC concentrations (15, 150, 750 ng/patch) for all analytes and at high QC concentrations (1500, 3000, 8000 ng/patch) for methadone, cocaine, BE and 6AM. Extraction efficiency was assessed by fortifying blank patches (N=4) with control solution before elution and solid-phase extraction, and fortifying eluent buffer solutions (N=4) after extraction but prior to evaporation and derivatization. Relative recovery was calculated by comparing the mean peak analyte areas in the first and second sets multiplied by 100.
Stability
Analyte stability may be influenced by storage and handling conditions. The stabilities of the stored samples were investigated by fortifying blank patches (N=5) at two QC concentrations (150 and 3000 ng/patch) and storing them at 4 °C for 48 h, room temperature for 16 h, and at −20 °C followed by thawing at room temperature for three freeze–thaw cycles. On completion of these storage conditions, internal standard was added and the patches were extracted and analyzed as described above. In addition, the stability of heroin in buffered extract was determined after storage at 4 °C for 1, 3 and 18 days (N=5). Concentrations of control stability samples were compared to freshly prepared controls and calibration curves. The stability of derivatized extracts was also evaluated. Auto-sampler vials were stored at room temperature and re-injected 72 h after initial analysis. Stability criteria included acceptable ion ratios (within 20% of the average calibrator ion ratios) and quantification of QC samples within ±20% of expected concentrations.
Conversion of analytes during method processing
Potential conversion of the analyte to another compound (metabolite, hydrolysis or pyrolysis product) during method processing was evaluated. Single patches containing 1000 ng of one analyte and working internal standard solution were extracted and processed for each compound of interest. Concentrations were required to be within 20% of the target concentration, and all other target compounds were also quantified.
Clinical study
To provide proof of concept for this analytical method, drug concentrations in sweat from a single opiate-dependent pregnant woman are presented in Fig. 2. This woman provided informed consent to participate in a Johns Hopkins Bayview Medical Center and National Institute on Drug Abuse (NIDA) Intramural Research Program Institutional Review Boards-approved study of outpatient methadone-maintenance drug abuse treatment. Sweat patches were applied for approximately seven days during daily dosing of 30–120 mg oral methadone. After collection, sweat patches were stored in Ziploc bags at −20 °C until analysis by the described method.
Fig. 2.
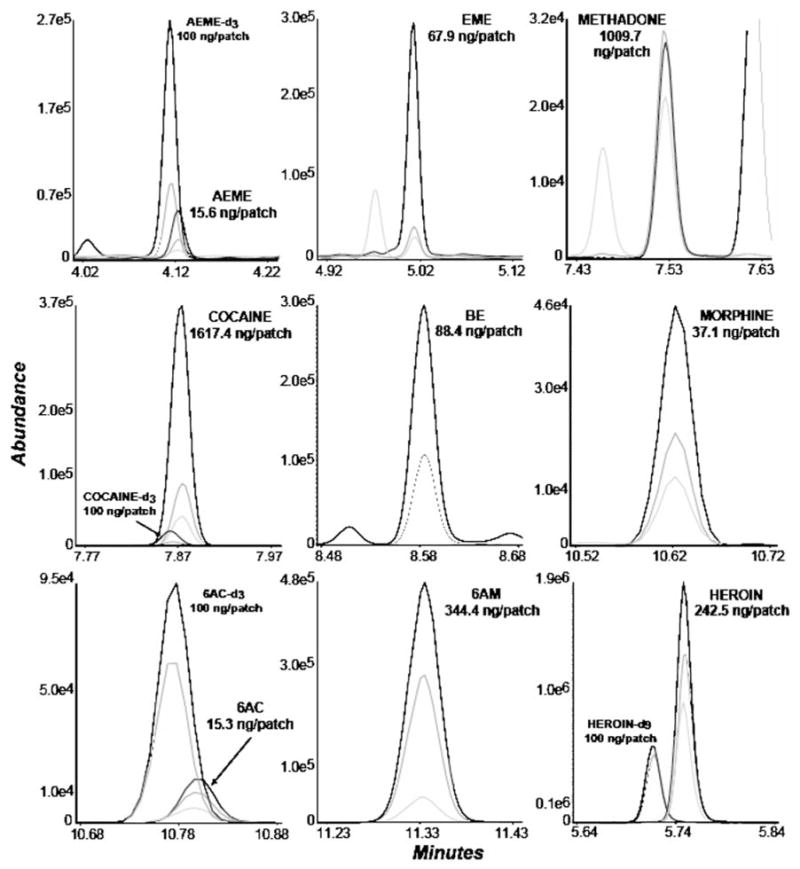
Merged extracted ion chromatograms from a sweat patch worn for five days by a heroin user under 120 mg daily methadone maintenance treatment. Analyte concentrations are presented as ng/patch: anhydroecgonine methyl ester (AEME), ecgonine methyl ester (EME), methadone, cocaine, benzoylecgonine (BE), morphine, 6-acetylcodeine (6AC), 6-monoacetylmorphine (6AM), heroin. The patch contained no codeine. Methadone and cocaine were quantified from a split injection on the higher calibration curve
Results
Method development
Our analytical goal was the development of a robust, selective and sensitive method for the simultaneous quantification of methadone, heroin, cocaine and metabolites in sweat. As an alternative matrix, sweat provides an analytical challenge due to the wide range of concentrations that can be encountered (tens of thousands ng/patch for cocaine [26], thousands for methadone [9], and a few ng/patch for 6AM or heroin [10]. Furthermore, only one extraction is possible per patch, unless you add external standards to a fraction of the extracted buffer, or take only one-half of the patch, as described in previous studies [26, 27]. Both of these options introduce a level of uncertainty (potential loss of analytes during an extraction without internal standards, or possible differences in concentrations in different parts of the patch) and increase the LOQ. We opted to extract the entire patch fortified with all required internal standards in order to achieve reasonable LOQ and to extend the concentration range by modifying GC injection parameters. One of the greatest challenges was the inclusion of heroin in the assay, due to the instability of this analyte in many elution solvents and derivatizing agents. It was challenging to create a single assay for all of the analytes of interest. For these reasons, we chose to retain a portion of the buffered extract, and to analyze heroin independently in clinical specimens containing 6AM ≥LOD (2.5 ng/patch). All buffered extracts were refrigerated at 4 °C until analysis for heroin, if required.
Hydrolysis of heroin was also considered when selecting the extraction buffer (0.5 M sodium acetate, pH 4.0). Traditionally, less hydrolysis has been observed when specimens are buffered at pH<5 [28]. SPE with Clean Screen® ZSDAU020 columns was shown to be suitable for the analysis of opiates, cocaine and metabolites extracted from sweat patches [6]. In the current SPE assay, replacing methanol with acetonitrile in conditioning and washing steps considerably reduced the hydrolysis of heroin, 6AM and 6AC. Different elution solvents were also evaluated, with methylene chloride:2-propanol:ammonium hydroxide (78/20/2, v/v/v) exhibiting the greatest overall efficiency in terms of recovery and extract cleanliness. Unfortunately, the high pH of this elution solvent prevented its use for the extraction of heroin, another factor in our decision to utilize a separate extraction for heroin.
BSTFA/TMCS is the most commonly employed derivatizing agent for the analysis of opiates and cocaine, due to its ease of use and because additional solvent or clean-up steps are not required. However, the use of BSTFA/TMCS as derivatizing agent prevented the analysis of EDDP, due to unsuitable chromatographic peaks. This was most likely due to the slightly acidic pH and the promotion of the ionized form of EDDP. A similar finding was reported for the analysis of EDDP with MTBSTFA [29]. Several derivatizing agents were evaluated with the goal of incorporating EDDP into the method. MSTFA did not improve EDDP chromatography, TFAA and PFPA/PFPOH produced satisfactory results for EDDP but erratic derivatization of 6AM and MOR (i.e., two peaks for morphine with mono- and bisfluoroacetylated derivatives). This problem was also reported previously [30]. Given the low metabolite-to-parent ratios for EDDP and methadone in sweat of < 0.1 [9] and 0.07–0.25 [27], and the minimal number of cases where EDDP alone has identified methadone exposure, we determined that it would be more informative to include heroin and eliminate EDDP from this multi-analyte assay. One further problem was the high concentration of methadone in sweat during daily maintenance therapy, requiring a linear range that could accommodate the expected concentrations of clinical specimens.
The difficulties associated with the electron impact mass spectra of methadone are well understood. The prominent base peak of m/z 72 and a lack of additional fragments yields qualifier ion ratios of <3% for the quantification ion, making it difficult to achieve satisfactory ion ratios at the method’s LOQ. However, with m/z 72 used as the target ion, saturation of the mass detector occurred at elevated methadone concentrations, reducing the upper limit of linearity (ULOL). For these reasons, we chose not to monitor m/z 72 but selected ions with lower abundance instead (m/z 294, 115, 165). This compromise produced a higher but acceptable methadone LOQ of 10 ng/patch and an improved linear range of up to 1000 ng/patch on the low calibration curve and 10,000 ng/patch on the high curve injected in split mode.
During method development, the decision to include fewer deuterated internal standards was both a financial and analytical consideration. The wide linear range observed for some analytes (up to 10,000 ng/patch) required that the internal standard concentration be carefully selected. The internal standard peak must be able to achieve correct ion ratios at the LOQ for the splitless method with minimal contribution to native analytes, and still be prominent in the split method (1 μL injected, split ratio 1:10). For example, the deuterated internal standards methadone-d9 and 6AM-d6 at 100 ng/patch produced acceptable chromatography and quantification for the split curve but unacceptably elevated LOQ for methadone (25 ng/patch) and 6AM (10 ng/patch). Unsuitable ion ratios were observed for the native compounds at lower concentrations due to contribution from the deuterated standards. This phenomenon was not observed with cocaine-d3 and heroin-d9 (100 ng/patch). Contributions to native analytes from 100 ng/patch AEME-d3 and 6AC-d3 were insignificant and acceptable ion ratios could still be achieved at the LOQ of 5 ng/patch. These results led us to select four deuterated internal standards (each at a concentration of 100 ng/patch), AEME-d3 as internal standard for the early eluting compounds AEME and EME, cocaine-d3 for compounds eluting in the middle of the run, methadone, cocaine and BE, and 6AC-d3 for the later eluting compounds codeine, morphine, 6AC and 6AM. Heroin-d9 was used for the quantification of heroin. Calibration curves for all analytes were included in each analytical batch and equivalent results were observed in terms of limits of linearity when only four internal standards were selected for quantification instead of each compound utilizing its respective deuterated analog.
Few procedures are available in the literature for the analysis of heroin by GC/MS. Heroin hydrolysis was reduced during specimen processing to an acceptable level. Initially, 30–40% hydrolysis was observed when heroin was analyzed concomitantly with the other compounds. This conversion was reduced to 20–25% when methanol was replaced with acetonitrile during SPE conditioning and washing steps. A separate extraction for heroin further improved results. Goldberger et al. reported a method for heroin analysis using SPE extraction with ethyl acetate: diethylamine (98/2, v/v) as elution solvent [31]. The elution solvent of our first assay was replaced with ethyl acetate: triethylamine (98/2, v/v) and derivatization of heroin was not required, although peak shape and abundance were greatly improved, when the eluate was reconstituted in BSTFA/TMCS compared to ethyl acetate or acetonitrile. These modifications (ethyl acetate:triethylamine (98/2, v/v) and BSTFA/TMCS) reduced the hydrolysis of heroin to 9–12%. BSTFA/TMCS possibly promotes hydrolysis more than ethyl acetate or acetonitrile, but the fivefold increase in abundance observed with BSTFA/TMCS achieved a lower LOQ.
Method validation
Specificity
Endogenous compounds in sweat (matrix effects) collected from six different drug-free volunteers did not interfere with the quantification of analytes at the method’s LOQ. In addition, in each analytical batch, blank (patch spiked with artificial sweat) and negative (patch spiked with artificial sweat and internal standards) patches failed to show any interferences. Also, 47 potential interfering compounds, including over-the-counter medications, coadministered drugs, and metabolites fortified into extraction buffer (1000 ng/9 mL) containing analytes of interest at low QC concentrations (15 ng/9 mL) were evaluated. Forty-three compounds did not interfere with analyte quantification at this high interference concentration. Lower concentrations of cocaine minor metabolites (m-hydroxycocaine, p-hydroxycocaine and p-hydroxybenzoylecgonine) were evaluated, as the conversion of these three analytes to EME and AEME during analysis led to a quantification that was >120% of target. Target concentrations of AEME and EME were acceptable when patches were individually spiked at 100 ng/patch. m-Hydroxycocaine, p-hydroxycocaine and p-hydroxybenzoylecgonine are minor metabolites with relatively high polarities and are unlikely to be encountered at concentrations of over 100 ng in sweat patches. Although methadone quantified within 20% of the target in the presence of 1000 ng of dextromethorphan, there was obvious interference (distorted peak shape) for both qualifier ions, yielding a false negative, not a false positive, result. Methadone quantifications were within 20% of target at lower dextromethorphan concentrations, but qualifier ion ratios were still unacceptable. It is not expected that high concentrations of dextromethorphan will be encountered in sweat, but should such an interference with methadone be noted during routine analyses, alternative chromatography would be necessary.
Two calibration curves were constructed for each analytical run. Low curves ranged from 5 to 1000 ng/patch for each analyte except methadone (10–1000 ng/patch). Additional high calibration curves were constructed for methadone, cocaine, BE and 6AM (from 1000 to 10,000 ng/patch). Coefficients of determination (R2) for all curves (N=5) were typically > 0.996 (Table 2). A summary of the calibration data over the dynamic range of the assay, including LODs and LOQs, is presented in Table 2. Representative chromatography illustrating the extracted ion chromatograms of sweat patches fortified with each drug at the LOQ are presented in Fig. 1.
Table 2.
Limits of detection, linear ranges and calibration curves (N=5) for methadone, cocaine, heroin and metabolites in human sweat
| Compound | LODa (ng/patch) | Linear range (ng/patch) | Regression equation y = mx + b | Coefficients of determination (R2) |
|---|---|---|---|---|
| Methadone | 5 | 10–1000 | y=0.0011 (0.0001) x+0.0028 (0.0029) | 0.9992–0.9999 |
| 1000–10,000 | y=0.0009 (0) x+0.1737 (0.0293) | 0.9997–0.9999 | ||
| Cocaine | 2.5 | 5–1000 | y=0.0096 (0.0003) x+0.0082 (0.0034) | 0.9997–1.0000 |
| 1000–10,000 | y=0.0089 (0.0002) x+1.2685 (0.1926) | 0.9993–0.9997 | ||
| Benzoylecgonine | 2.5 | 5–1000 | y=0.0076 (0.0005) x−0.0001 (0.0076) | 0.9997–0.9999 |
| 1000–10,000 | y=0.0073 (0.0001) x+0.2032 (0.3535) | 0.9996–0.9999 | ||
| Ecgonine methyl ester | 2.5 | 5–1000 | y=0.0136 (0.0033) x−0.0025 (0.0104) | 0.9971–1.0000 |
| Anhydroecgonine methyl ester | 2.5 | 5–1000 | y=0.0104 (0.0003) x+0.0299 (0.0057) | 0.9981–0.9998 |
| Codeine | 1.25 | 5–1000 | y=0.0175 (0.0026) x−0.0177 (0.0061) | 0.9992–0.9998 |
| Morphine | 1.25 | 5–1000 | y=0.0149 (0.0015) x−0.0231 (0.0069) | 0.9987–0.9996 |
| 6-Acetylcodeine | 5 | 5–1000 | y=0.0120 (0.0003) x+0.0043 (0.0012) | 0.9997–0.9999 |
| 6-Acetylmorphine | 2.5 | 5–1000 | y=0.0144 (0.0004) x−0.0066 (0.0093) | 0.9998–0.9999 |
| 1000–10,000 | y=0.0250 (0.0073) x−7.1310 (1.9679) | 0.9985–0.9999 | ||
| Heroin | 2.5 | 5–1000 | y=0.0099 (0.0002) x−0.0111 (0.0046) | 0.9968–0.9982 |
Limit of detection
Fig. 1.
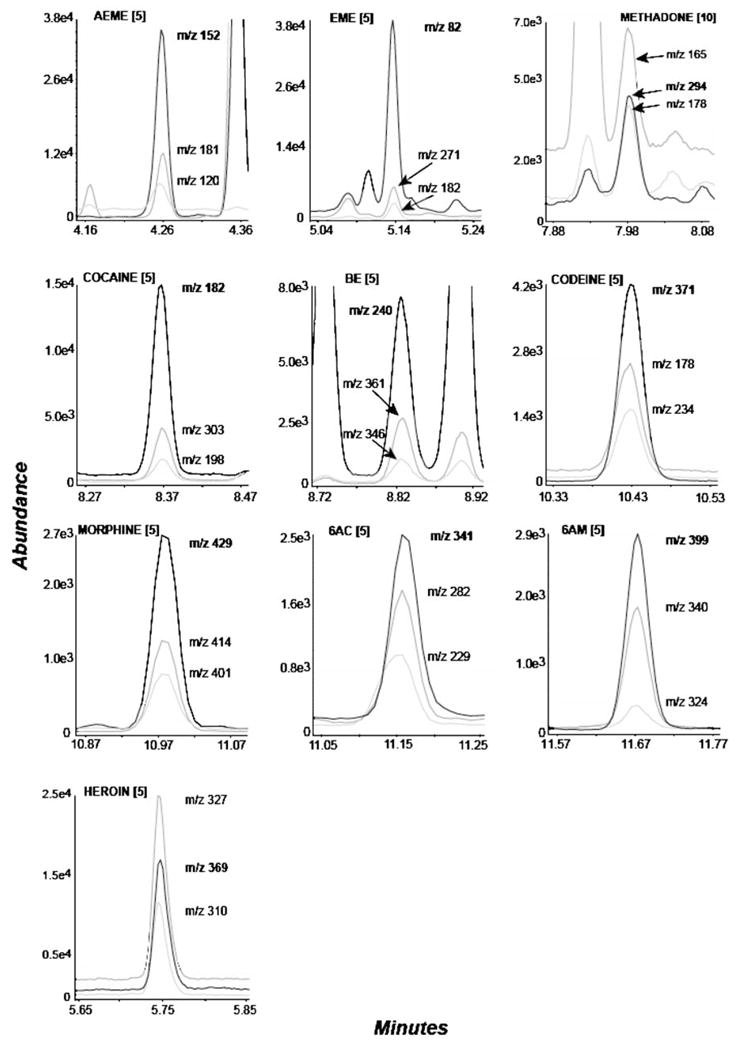
Merged extracted ion chromatograms from a sweat patch spiked at the limit of quantification (LOQ in bracket, ng/patch) for all analytes: anhydroecgonine methyl ester (AEME), ecgonine methyl ester (EME), methadone, cocaine, benzoylecgonine (BE), codeine, morphine, 6-acetylcodeine (6AC), 6-acetylmorphine (6AM), heroin. The quantifying ion is denoted in bold
In each analytical run, the highest calibrator containing all analytes (1000 ng/patch) was injected immediately before a negative sample, allowing the quantification of potential carryover. There was no evidence of carryover at the method’s LOD. In addition, no detectable carryover was observed following the splitless injection of samples (N=4) spiked at 10,000 ng/patch for methadone, cocaine, BE and 6AM.
Accuracy and imprecision of the method were evaluated at three concentrations over the linear dynamic range of each curve. Within-run (5 replicates, 1 run, N=5), and between-run (5 replicates, 4 runs, N=20) imprecisions are presented in Table 3, along with accuracy data. Inter-assay imprecision (%RSD) ranged from 0.8% to 6.5%, while intra-assay imprecision was less than 5.0% on four different days. Inter-assay accuracy (N=5, assays=4), calculated as the percent difference between the mean and target concentrations, was between 89.8% and 111.0%. Control concentrations for each analyte were evaluated using a single-factor analysis of variance with day as the grouping variable. The data showed statistically significant differences between days for all analytes (p=0.05); however, differences in daily mean analyte concentrations did not exceed 17.2% of target and were considered clinically insignificant.
Table 3.
Accuracy and imprecision data for the quantification of methadone, cocaine, heroin and metabolites in human sweat
| Analyte | Target (ng/patch) | Intra-assay imprecision (% RSD, N=5) | Inter-assay imprecision (% RSD, N=20) | Accuracy (% target, N=20) |
|---|---|---|---|---|
| Methadone | 15 | 5.0 | 4.2 | 106.1 |
| 150 | 1.7 | 2.4 | 102.8 | |
| 750 | 1.0 | 2.8 | 105.1 | |
| 1500 | 1.7 | 3.6 | 109.4 | |
| 3000 | 1.0 | 2.5 | 105.4 | |
| 8000 | 0.6 | 1.4 | 103.5 | |
| Cocaine | 15 | 0.4 | 3.0 | 102.3 |
| 150 | 1.1 | 1.2 | 99.3 | |
| 750 | 1.1 | 1.1 | 98.3 | |
| 1500 | 1.2 | 2.0 | 105.9 | |
| 3000 | 0.7 | 2.4 | 101.0 | |
| 8000 | 1.0 | 1.7 | 100.0 | |
| BEa | 15 | 1.3 | 6.5 | 97.5 |
| 150 | 1.2 | 2.2 | 98.6 | |
| 750 | 1.3 | 2.8 | 99.9 | |
| 1500 | 2.3 | 4.8 | 111.0 | |
| 3000 | 0.7 | 2.5 | 108.7 | |
| 8000 | 1.3 | 1.7 | 106.9 | |
| EMEb | 15 | 1.8 | 4.2 | 103.7 |
| 150 | 1.9 | 3.4 | 106.5 | |
| 750 | 1.6 | 2.2 | 105.5 | |
| AEMEc | 15 | 0.5 | 3.3 | 102.7 |
| 150 | 1.3 | 1.7 | 105.3 | |
| 750 | 1.4 | 1.2 | 102.2 | |
| Codeine | 15 | 1.3 | 6.1 | 98.7 |
| 150 | 2.8 | 5.9 | 102.3 | |
| 750 | 2.4 | 2.3 | 110.9 | |
| Morphine | 15 | 1.3 | 4.4 | 91.6 |
| 150 | 2.8 | 3.0 | 94.9 | |
| 750 | 2.3 | 3.8 | 108.9 | |
| 6ACd | 15 | 1.1 | 3.0 | 99.8 |
| 150 | 1.2 | 2.4 | 103.4 | |
| 750 | 1.3 | 1.1 | 102.3 | |
| 6AMe | 15 | 1.5 | 5.4 | 89.8 |
| 150 | 1.5 | 3.4 | 92.3 | |
| 750 | 1.0 | 1.6 | 92.5 | |
| 1500 | 0.7 | 3.8 | 107.0 | |
| 3000 | 1.3 | 4.1 | 97.8 | |
| 8000 | 1.2 | 2.5 | 97.3 | |
| Heroin | 15 | 1.8 | 3.2 | 101.6 |
| 150 | 0.9 | 0.8 | 95.6 | |
| 750 | 0.6 | 1.6 | 101.2 |
Benzoylecgonine
Ecgonine methyl ester
Anhydroecgonine methyl ester
6-Acetylcodeine
6-Acetylmorphine
Extraction efficiencies were calculated by comparing the mean peak area (N=4) of each analyte in a set of patches fortified with QC working solutions prior to sample processing (15, 150, 750, 1500, 3000 and 8000 ng/patch) to the mean peak area (N=4) of analytes fortified into elution solvent after SPE. Mean percent extraction efficiencies of 69.2–78.4% for heroin and 89.8–112.2% for the other analytes were obtained (Table 4).
Table 4.
Mean extraction efficiencies (%) of methadone, and cocaine, heroin and metabolites from sweat patches (N=4)
| Low calibration curve concentrations (ng/patch) | 15 | 150 | 750 |
|---|---|---|---|
| Methadone | 92.4 | 95.5 | 105.9 |
| Cocaine | 102.7 | 100.6 | 108.1 |
| Benzoylecgonine | 90.9 | 92.9 | 99.2 |
| Ecgonine methyl ester | 94.8 | 92.3 | 103.1 |
| Anhydroecgonine methyl ester | 99.2 | 100.6 | 106.7 |
| Codeine | 112.2 | 107.9 | 109.8 |
| Morphine | 107.1 | 102.0 | 105.0 |
| 6-Acetylcodeine | 105.8 | 103.7 | 107.9 |
| 6-Acetylmorphine | 101.1 | 97.1 | 100.8 |
| Heroin | 78.4 | 69.2 | 73.3 |
| High calibration curve concentrations (ng/patch) | 1500 | 3000 | 8000 |
| Methadone | 101.9 | 100.1 | 101.2 |
| Cocaine | 97.5 | 102.2 | 104.3 |
| Benzoylecgonine | 94.9 | 94.1 | 93.8 |
| 6-Acetylmorphine | 89.8 | 90.8 | 93.7 |
Stability studies were conducted to ensure that the analytes were stable during the preparation, processing and analysis of the sweat patches. Patches (N=5) were spiked at two concentrations (150 and 3000 ng/patch) and subjected to three freeze–thaw cycles prior to extraction. Each freeze–thaw cycle consisted of freezing at −20 °C for at least 6 h and thawing at room temperature before refreezing. The mean analyte concentrations of these stability samples were compared to measured concentrations of freshly prepared QC samples, and the results are presented in Table 5. Mean percent differences after three freeze–thaw cycles ranged from −5.9 to 11.9%. Analyte concentrations (N=5) for room temperature (16 h) and refrigerated (48 h) stability samples were within ±10.7% of target for all analytes. The stabilities of the derivatized extracts in sealed GC autosampler vials stored at room temperature were assessed 72 h after the first injection. Derivatized control samples (N=5) at 150 ng/patch for all analytes and also at 3000 ng/patch for methadone, cocaine, BE and 6AM were stable, and acceptable chromatography parameters and quantifications to within 6.0% of target were observed for all compounds of interest.
Table 5.
Analyte stability after the addition of quality control solution to blank sweat patches spiked with artificial sweat (N=5)
| Target concentration (ng/patch) | Mean % difference after storage |
|||
|---|---|---|---|---|
| 16 h at room temperature | 48 h at 4 °C | Three freeze–thaw cycles | ||
| Methadone | 150 | −0.61 | 0.81 | 2.93 |
| 3000 | −5.75 | −5.05 | −4.56 | |
| Cocaine | 150 | −1.56 | −1.95 | −1.38 |
| 3000 | −3.18 | −3.38 | −2.26 | |
| BEa | 150 | −2.02 | −4.80 | −5.62 |
| 3000 | −6.16 | −3.34 | −2.27 | |
| EMEb | 150 | −4.42 | −1.56 | −1.56 |
| AEMEc | 150 | −0.84 | −2.69 | −1.80 |
| Codeine | 150 | 1.27 | 12.51 | 11.88 |
| Morphine | 150 | −0.11 | 10.74 | 10.04 |
| 6ACd | 150 | −1.26 | −1.92 | −1.22 |
| 6AMe | 150 | −2.11 | −4.48 | −4.80 |
| 3000 | −6.45 | −6.04 | −5.82 | |
| Heroin | 150 | −2.94 | −1.75 | −2.10 |
Benzoylecgonine
Ecgonine methyl ester
Anhydroecgonine methyl ester
6-Acetylcodeine
6-Acetylmorphine
Additional stability experiments were conducted to ensure that heroin was stable for extended periods in the buffered extract (0.5 M sodium acetate buffer, pH 4.0) at 4 °C; this was analyzed only if the sample was positive for 6AM at the method LOD (2.5 ng/patch). Patches (N=5) were spiked with heroin at 150 ng/patch and processed accordingly. Buffered extracts were stored at 4 °C for up to 18 days. After storage, patches underwent SPE and the results compared to freshly extracted QC samples (N=5). Heroin was found to be stable in the buffered extract with quantification at +0.7, +1.61, and −7.85% of the mean target concentrations, respectively, after 1, 3 and 18 days of storage at 4 °C.
Heroin, 6AM and 6AC contain labile acetyl moieties that are easily hydrolyzed during specimen processing. Heroin hydrolysis was evaluated in each run by monitoring the conversion of heroin-d9 to 6AM-d6. Heroin hydrolysis was typically 20–25%, and during the optimized heroin extraction procedure, hydrolysis was limited to 9–12%. Cocaine can also be easily hydrolyzed to BE, or pyrolyzed to AEME in the GC inlet. To assess other possible conversions, each compound was tested individually. Extracted buffer aliquots (9 mL) containing 1000 ng of a single analyte and 100 ng of internal standard were processed. The presence of any compound other than the fortified analyte was quantified. The 1000-ng 6AM sample produced 5.2 ng of morphine, and codeine was detected in the 1000-ng 6AC sample, but at less than the LOQ of the method (5 ng). No other analyte conversion was detected. A 0.5% conversion of 6AM to morphine was considered acceptable for the quantification of both analytes.
Discussion
We present a validated analytical procedure for the simultaneous quantification of methadone, cocaine, BE, EME, AEME, codeine, morphine, 6AC, 6AM and heroin in sweat. This is a rugged and sensitive method that includes the extraction of sweat patches with sodium acetate buffer, extraction with Clean Screen® ZSDAU020 SPE columns, and derivatization with BSTFA/TMCS.
One of the main advantages of sweat is that parent drugs are generally excreted at higher concentrations than metabolites, allowing the detection of heroin and 6AM, which have short half-lives in blood and are poorly detected in urine. This enables the clear identification of heroin abuse with sweat testing, in contrast to the unclear situation that arises when morphine is identified in urine. Morphine can be derived from morphine or codeine medication or abuse, morphine-containing foodstuffs, or heroin abuse. Concentrations of heroin in sweat that are equal to or greater than those of 6AM have been reported [8, 10]. Thus, there is value in including heroin in sweat analysis, despite the analytical difficulties and relative instability. In this method, a third of the buffered patch extract was dedicated to the analysis of heroin by a separate extraction method to prevent excessive hydrolysis.
This method is well-suited to the monitoring of cocaine and opiate abuse as well as opioid maintenance treatment with methadone, including the quantification of elevated parent compounds and low concentrations of unique minor metabolites in sweat. The originality of this method derives from the inclusion of AEME, a marker of smoked cocaine, and the first reported presence of 6AC in sweat. All analytes were extracted efficiently with recoveries of over 69% for heroin and 89% for all other compounds. The method achieved acceptable precision and accuracy with a total imprecision ranging from 0.8 to 6.5% and an accuracy that was within ± 11% at six control concentrations across the two calibration curves. This sensitive and specific method allows the quantification of 5 ng/patch for all analytes except methadone (10 ng/patch). The upper limit of linearity is 10,000 ng/patch for methadone, cocaine, BE and 6AM, and up to 1000 ng/patch for all other analytes. These extended dynamic ranges were achieved by simply modifying the injection technique, permitting quantifications from a single extract and multiple injections. Extended ranges were necessary to encompass the high concentrations found in sweat patches worn weekly during methadone maintenance treatment [9, 20]. SAMHSA guidelines for federally mandated sweat testing require confirmation cutoffs of 25 ng/patch for cocaine, BE, codeine, morphine or 6AM, which are easily achieved with this method.
The method was applied to the measurement of drug concentrations in sweat from a participant with a history of heroin and cocaine abuse enrolled in an outpatient methadone maintenance drug abuse treatment program. The sweat patch was worn for five days during 120 mg daily methadone dosing. Analyte concentrations (ng/patch) were: methadone 1009.7, heroin 242.5, 6AM 344.4, morphine 37.1, and 6AC 15.3, documenting a relapse to heroin use during methadone treatment. Codeine was not identified in the patch at the method’s LOQ. Crack cocaine abuse also was shown with sweat patch concentrations of: cocaine 1617.4, BE 88.4, EME 67.9 and AEME 15.6 ng/patch. Figure 2 shows merged extracted ion chromatograms for each analyte quantified in this sweat patch.
This rugged and sensitive method permits the simultaneous quantification of methadone, and heroin, cocaine and metabolites in human sweat and should be useful for workplace drug testing, criminal justice and methadone maintenance drug testing. We also report—for the first time to the best of our knowledge—the presence of 6AC in the sweat of a heroin user. Maintenance treatment with pharmaceutical-grade heroin is available in Switzerland [32]. 6AC in sweat may offer a unique biomarker of illicit heroin use in patients under treatment with pharmaceutical heroin.
References
- 1.Cone EJ. Legal, workplace, and treatment drug testing with alternate biological matrices on a global scale. Forensic Sci Int. 2001;121:7–15. doi: 10.1016/s0379-0738(01)00446-7. [DOI] [PubMed] [Google Scholar]
- 2.Dolan K, Rouen D, Kimber J. An overview of the use of urine, hair, sweat and saliva to detect drug use. Drug Alcohol Rev. 2004;23:213–217. doi: 10.1080/09595230410001704208. [DOI] [PubMed] [Google Scholar]
- 3.Kintz P. Drug testing in addicts: a comparison between urine, sweat, and hair. Ther Drug Monit. 1996;18:450–455. doi: 10.1097/00007691-199608000-00024. [DOI] [PubMed] [Google Scholar]
- 4.Samyn N, De Boeck G, Verstraete AG. The use of oral fluid and sweat wipes for the detection of drugs of abuse in drivers. J Forensic Sci. 2002;47:1380–1387. [PubMed] [Google Scholar]
- 5.DHHS. Proposed revisions to mandatory guidelines for federal workplace drug testing programs. Federal Register. 2004;69:19673–19732. [Google Scholar]
- 6.Huestis MA, Oyler JM, Cone EJ, Wstadik AT, Schoendorfer D, Joseph RE., Jr Sweat testing for cocaine, codeine and metabolites by gas chromatography-mass spectrometry. J Chromatogr B. 1999;733:247–264. doi: 10.1016/s0378-4347(99)00246-7. [DOI] [PubMed] [Google Scholar]
- 7.Skopp G, Potsch L. Perspiration versus saliva–basic aspects concerning their use in roadside drug testing. Int J Legal Med. 1999;112:213–221. doi: 10.1007/s004140050239. [DOI] [PubMed] [Google Scholar]
- 8.Cone EJ, Hillsgrove MJ, Jenkins AJ, Keenan RM, Darwin WD. Sweat testing for heroin, cocaine, and metabolites. J Anal Toxicol. 1994;18:298–305. doi: 10.1093/jat/18.6.298. [DOI] [PubMed] [Google Scholar]
- 9.Skopp G, Potsch L, Eser HP, Moller MR. Preliminary practical findings on drug monitoring by a transcutaneous collection device. J Forensic Sci. 1996;41:933–937. [PubMed] [Google Scholar]
- 10.Kintz P, Brenneisen R, Bundeli P, Mangin P. Sweat testing for heroin and metabolites in a heroin maintenance program. Clin Chem. 1997;43:736–739. [PubMed] [Google Scholar]
- 11.Schwilke EW, Barnes AJ, Kacinko SL, Cone EJ, Moolchan ET, Huestis MA. Opioid disposition in human sweat after controlled oral codeine administration. Clin Chem. 2006;52:1539–1545. doi: 10.1373/clinchem.2006.067983. [DOI] [PubMed] [Google Scholar]
- 12.Follador MJ, Yonamine M, de Moraes Moreau RL, Silva OA. Detection of cocaine and cocaethylene in sweat by solid-phase microextraction and gas chromatography/mass spectrometry. J Chromatogr B. 2004;811:37–40. doi: 10.1016/j.jchromb.2004.03.071. [DOI] [PubMed] [Google Scholar]
- 13.Kacinko SL, Barnes AJ, Schwilke EW, Cone EJ, Moolchan ET, Huestis MA. Disposition of cocaine and its metabolites in human sweat after controlled cocaine administration. Clin Chem. 2005;51:2085–2094. doi: 10.1373/clinchem.2005.054338. [DOI] [PubMed] [Google Scholar]
- 14.Pichini S, Navarro M, Pacifici R, Zuccaro P, Ortuno J, Farre M, et al. Usefulness of sweat testing for the detection of MDMA after a single-dose administration. J Anal Toxicol. 2003;27:294–303. doi: 10.1093/jat/27.5.294. [DOI] [PubMed] [Google Scholar]
- 15.Barnes AJ, Smith ML, Kacinko SL, Schwilke EW, Cone EJ, Moolchan ET, Huestis MA. Excretion of methamphetamine and amphetamine in human sweat following controlled oral methamphetamine administration. Clin Chem. 2008;54:172–180. doi: 10.1373/clinchem.2007.092304. [DOI] [PMC free article] [PubMed] [Google Scholar]
- 16.Kintz P, Cirimele V, Ludes B. Detection of cannabis in oral fluid (saliva) and forehead wipes (sweat) from impaired drivers. J Anal Toxicol. 2000;24:557–561. doi: 10.1093/jat/24.7.557. [DOI] [PubMed] [Google Scholar]
- 17.Huestis MA, Scheidweiler KB, Saito T, Fortner N, Abraham T, Gustafson RA, Smith ML. Excretion of delta9-tetrahydrocannabinol in sweat. Forensic Sci Int. 2008;174:173–177. doi: 10.1016/j.forsciint.2007.04.002. [DOI] [PMC free article] [PubMed] [Google Scholar]
- 18.Kintz P, Tracqui A, Mangin P, Edel Y. Sweat testing in opioid users with a sweat patch. J Anal Toxicol. 1996;20:393–397. doi: 10.1093/jat/20.6.393. [DOI] [PubMed] [Google Scholar]
- 19.Henderson GL, Wilson BK. Excretion of methadone and metabolites in human sweat. Res Commun Chem Pathol Pharmacol. 1973;5:1–8. [PubMed] [Google Scholar]
- 20.Kintz P, Tracqui A, Marzullo C, Darreye A, Tremeau F, Greth P, Ludes B. Enantioselective analysis of methadone in sweat as monitored by liquid chromatography/ion spray–mass spectrometry. Ther Drug Monit. 1998;20:35–40. doi: 10.1097/00007691-199802000-00007. [DOI] [PubMed] [Google Scholar]
- 21.De Martinis BS, Barnes AJ, Scheidweiler KB, Huestis MA. Development and validation of a disk solid phase extraction and gas chromatography-mass spectrometry method for MDMA, MDA, HMMA, HMA, MDEA, methamphetamine and amphetamine in sweat. J Chromatogr B. 2007;852:450–458. doi: 10.1016/j.jchromb.2007.02.017. [DOI] [PMC free article] [PubMed] [Google Scholar]
- 22.Saito T, Wtsadik A, Scheidweiler KB, Fortner N, Takeichi S, Huestis MA. Validated gas chromatographic–negative ion chemical ionization mass spectrometric method for delta(9)-tetrahydrocannabinol in sweat patches. Clin Chem. 2004;50:2083–2090. doi: 10.1373/clinchem.2004.034868. [DOI] [PubMed] [Google Scholar]
- 23.Brenneisen R, Hasler F, Wursch D. Acetylcodeine as a urinary marker to differentiate the use of street heroin and pharmaceutical heroin. J Anal Toxicol. 2002;26:561–566. doi: 10.1093/jat/26.8.561. [DOI] [PubMed] [Google Scholar]
- 24.Phillips SG, Allen KR. Acetylcodeine as a marker of illicit heroin abuse in oral fluid samples. J Anal Toxicol. 2006;30:370–374. doi: 10.1093/jat/30.6.370. [DOI] [PubMed] [Google Scholar]
- 25.Liberty HJ, Johnson BD, Fortner N, Randolph D. Detecting crack and other cocaine use with fastpatches. Addict Biol. 2003;8:191–200. doi: 10.1080/1355621031000117428. [DOI] [PMC free article] [PubMed] [Google Scholar]
- 26.Moody DE, Spanbauer AC, Taccogno JL, Smith EK. Comparative analysis of sweat patches for cocaine (and metabolites) by radioimmunoassay and gas chromatography–positive ion chemical ionization–mass spectrometry. J Anal Toxicol. 2004;28:86–93. doi: 10.1093/jat/28.2.86. [DOI] [PubMed] [Google Scholar]
- 27.Fucci N, De Giovanni N, Scarlata S. Sweat testing in addicts under methadone treatment: an Italian experience. Forensic Sci Int. 2008;174:107–110. doi: 10.1016/j.forsciint.2007.03.010. [DOI] [PubMed] [Google Scholar]
- 28.Barrett DA, Dyssegaard AL, Shaw PN. The effect of temperature and pH on the deacetylation of diamorphine in aqueous solution and in human plasma. J Pharm Pharmacol. 1992;44:606–608. doi: 10.1111/j.2042-7158.1992.tb05474.x. [DOI] [PubMed] [Google Scholar]
- 29.Alburges ME, Huang W, Foltz RL, Moody DE. Determination of methadone and its N-demethylation metabolites in biological specimens by GC-PICI-MS. J Anal Toxicol. 1996;20:362–368. doi: 10.1093/jat/20.6.362. [DOI] [PubMed] [Google Scholar]
- 30.Weinmann W, Renz M, Vogt S, Pollak S. Automated solid-phase extraction and two-step derivatisation for simultaneous analysis of basic illicit drugs in serum by GC/MS. Int J Legal Med. 2000;113:229–235. doi: 10.1007/s004149900098. [DOI] [PubMed] [Google Scholar]
- 31.Goldberger BA, Darwin WD, Grant TM, Allen AC, Caplan YH, Cone EJ. Measurement of heroin and its metabolites by isotope-dilution electron-impact mass spectrometry. Clin Chem. 1993;39:670–675. [PubMed] [Google Scholar]
- 32.Gschwend P, Rehm J, Blattler R, Steffen T, Seidenberg A, Christen S, et al. Dosage regimes in the prescription of heroin and other narcotics to chronic opioid addicts in Switzerland–Swiss national cohort study. Eur Addict Res. 2004;10:41–48. doi: 10.1159/000073725. [DOI] [PubMed] [Google Scholar]