Abstract
Purpose
The question of whether magnetic resonance spectroscopic imaging (MRSI) can be used to predict the Gleason score has been recently examined at our institution (1) and higher Gleason grade was associated with higher R=(choline+creatine)/citrate values. We wish to quantify this correlation by calculating as a function of R the probability that a particular voxel has a pathologic Gleason score ≥4+3, with sextant biopsy BxG and lesion volume V as cofactors.
Methods and Materials
The data consist of MRSI ratios R stratified by patient, lesion (contiguous abnormal voxels), voxels, biopsy and pathologic Gleason, and lesion volume. The data were analyzed using a logistic model.
Results
For both low- and high-Gleason biopsy lesions, the probability of pathologic Gleason score ≥4+3 increases with lesion volume. At low values of R a lesion volume of at least 15–20 voxels is needed to reach a probability of success of 80%; the biopsy result helps reduce the prediction uncertainty. At larger MRS ratios (R>6) the biopsy result becomes essentially uninformative, once the lesion volume is >12 voxels. With the exception of low values of R, for lesions with low-Gleason score at biopsy, the MRS ratios serve primarily as a selection tool for assessing lesion volumes.
Conclusions
In patients with biopsy Gleason score ≥4+3, high MRSI tumor volume and (Cho+Cr)/Cit may justify the initiation of voxel-specific dose escalation. This is an example of biologically-motivated focal treatment for which IMRT and especially brachytherapy are ideally suited.
Keywords: prostate cancer, focal treatment, magnetic resonance spectroscopic imaging, Gleason grade
INTRODUCTION
In this article we defend the claim that MR spectroscopy (MRS) is informative with respect to the Gleason grade of prostate cancer. To do this we make use of a unique set of measurements of these two quantities (MRS metabolic data and Gleason grade) concurrently available on a spatial grid of prostate sub-volumes (1). An initial investigation of theses results has already noted that patients with higher grade Gleason often have a higher ratio of (creatine + choline)/citrate (1) and here we further advance this analysis with the goal of quantifying, as a function of average MRS score and tumor volume, the probability that a cancer-suspected lesion does indeed have an elevated Gleason grade.
Routine treatment options for the patient with localized prostate cancer (surgery, radiation) share similar outcomes in terms of their capability to suppress PSA-producing tissue (the so-called “biochemical” response) or, more importantly, prevent distant failure and/or cause-specific death. Faced with uncertainty on whether the treatment of local disease will have a benefit in terms of life expectancy, an informed patient will likely select a treatment modality based on its reported ability to minimize ensuing morbidity. This is particularly relevant in the era of serum PSA screening where the typical patient is increasingly younger and some 10 years away from the manifestation of any clinical symptoms, yet under the threat of significant treatment-related sequelae (impotence, urethral incontinence and bowel injury).
The advent of intensity-modulated radiation therapy (IMRT) and intra-operative planning in brachytherapy (BRT) has contributed significantly to reducing some side effects (2–5) (urethral and rectal toxicity) but progress along this direction is likely reaching its limits. The next challenge to overcome in this respect is treating only those lesions in the prostate gland that contain clinically significant (as opposed to indolent) cancer, essentially cells that have the ability to invade and metastasize. The sine qua non of this line of attack – known as focal treatment – is the ability to find and localize the corresponding biomarkers (6).
Gleason score is generally acknowledged as predictive of distant failure and its consequences (7) (8). The question of whether magnetic resonance spectroscopic imaging (MRSI) – a non-invasive in vivo technique that maps the metabolic profile of prostate tissue – can be used to predict this quantity has been recently examined at our institution (1). Higher Gleason grade tumors were associated with higher values of the ratio R = (choline + creatine)/citrate. In this follow-up analysis we wish to quantify this correlation by calculating, as a function of R, the probability that a particular lesion, defined as a contiguous assembly of voxels considered suspicious for cancer by MRS analysis, has a certain pathologic Gleason score (G). We include as cofactors in our model the results of sextant biopsy Gleason grading (BxG) and the lesion volume, V. By the conclusion of this analysis we shall have developed a convenient functional probability model for Gleason grade forecasting.
We shall argue that for patients with biopsy Gleason score BxG ≥4+3 (representing poorly differentiated tumors) the lesion volume V alone, estimated from the MRSI data, is predictive of similar pathologic score. On the other hand, for patients with BxG<4+3 both the lesion volume V and the MRSI ratio R determine the probability that G≥4+3. Furthermore, if high Gleason sums are correlated with cell proliferation - as some reports suggest (9) - this would appear to justify the initiation of lesion-specific dose escalation. This in effect will be the overall conclusion of our paper.
METHODS AND MATERIALS
Patient Data
The structure of the data set, described in more detail in Zakian et al (1), is explained schematically in Table 1. It consists of a total 142 lesions (a set of voxels that satisfy the constraints set below) comprising a total of 885 voxels. The following information was available for each voxel:
Table 1.
Schematic representation of the structure of the data set used in this analysis. The total number of patients was 88. (y=0 if G<4+3; y=1 if G≥4+3)
| Patient # | Biopsy Gleason (0/1) | Lesion # | Pathologic Gleason, y (0/1) | Voxel # | R | R̄ | V |
|---|---|---|---|---|---|---|---|
| 1 | 0 | 1 | 0 | 1 | 0.7 | 0.93 | 3 |
| 2 | 0.9 | ||||||
| 3 | 1.2 | ||||||
| 2 | 1 | 1 | 2.3 | 1.55 | 2 | ||
| 2 | 0.8 | ||||||
| 3 | 0 | 1 | 6.7 | 2.70 | 4 | ||
| 2 | 1.1 | ||||||
| 3 | 2.1 | ||||||
| 4 | 0.9 |
The MRSI ratio, R (when larger than 0.5)
The volume (number of voxels) of the lesion to which the voxel belongs, V
A categorical variable, y, indicating whether at pathologic analysis the Gleason score of the lesion containing this voxel was smaller or larger/equal than 4+3 (y=0 if G<4+3; y=1 if G≥4+3)
A categorical variable, Z, specifying – for that particular patient – the result of the sextant biopsy (Z=0 if BxG<4+3; Z=1 if BxG≥4+3)
Only voxels that belonged to true positive (TP) or false negative (FN) lesions confirmed to have cancer (true/false refers to lesions with pathological confirmed/refuted cancer) are included in the analysis. As well, the data are restricted to voxels in the peripheral zone of the prostate. 106 voxels were categorized as false negatives (FN) and consequently the MRSI score (less than 0.5) was not recorded. Among these, the proportion of voxels with G≥4+3 was less than 5%, and they were not included in the analysis. The distribution of lesions by pathologic Gleason score (y=0,1) and biopsy Gleason score (Z=0,1) is shown in Table 2. We characterize each lesion by the average value, R̄, of its voxels’ MRS scores, a procedure consistent with the MRS ratio expected should the lesion had been measured as a single unit. Table 3 shows, as a function of Z and Y, lesion-averaged ratios, R̄, and volumes (denoted < R̄ > and <V>, respectively).
Table 2.
Distribution of lesions by biopsy and pathology Gleason. (Z=0 if BxG<4+3; Z=1 if BxG≥4+3)
| Z (BxG) | Number of Lesions | Pathology Gleason | |
|---|---|---|---|
| y=1 | y=0 | ||
| 0 | 161 | 13 | 148 |
| 1 | 33 | 15 | 18 |
Table 3.
Lesion-averaged MRS ratios and volumes
| Z (BxG) | y=0 | y=1 |
|---|---|---|
| 0 | <R̄>=1.1 <V>=2.9 |
<R̄>=3.7 <V>=17.7 |
| 1 | <R̄>=3.8 <V>=3.8 |
<R̄>=3.4 <V>=10.6 |
Data Analysis
Let y be a discrete random variable over the set (0,1) that indicates whether a given lesion has pathologic Gleason score, G≥4+3 (y = 1) or G<4+3 (y = 0). We shall consider y a Bernoulli variable subject to the binomial distribution:
| (1) |
where the probability of success (i.e. a high grade lesion), π, is taken to depend on a group of three explanatory variables: R (the MRS ratio, R≥0.5), Z (biopsy Gleason score dichotomized in the same manner as y) and V (the volume of the lesion containing the voxel of interest). A commonly utilized analytic expression to describe the relationship between π and R, Z and V is the logistic model. Thus:
| (2) |
where x=log(R). Equivalently:
| (2′) |
(x, y, V, Z, αZ, βZ, γZ) is a random vector and we are concerned with estimating the marginal probability distribution function of the vector ϕ̄ = (αZ, βZ, γZ) from a sample of observed values D=(xi, yi, Vi, Zi), i=1,… n.
The procedure we propose is the following. Using Bayes theorem (10):
| (3) |
| (4) |
Non-informative (i.e., approximately “flat”) priors were assumed for the elements of p(ϕ→). With this, the probability of success (y=1) for a voxel with explanatory variables (Rf, Vf, Zf ) is given by the expectation value (E) of πϕ̄ (Rf, Vf, Zf ) over ϕ̄:
| (5) |
| (5′) |
In the next section we apply this formalism to the data on hand.
RESULTS
In what follows we estimate the probability distribution function p(ϕ̄|D) and then calculate the expected probability of success for different combinations of MRSI ratio, biopsy results (referred to as low-Gleason biopsy, when Z=0 and high-Gleason biopsy when Z=1) and lesion volumes – all observable quantities. Mathematica 6.0 (11) was used for all calculations. The logistic parameters, Eqs(2,2′), are given in Table 4.
Table 4.
Logistic parameters (± 1 SD) for low-Gleason (subscript 0) and high-Gleason (subscript 1) dichotomized biopsy Gleason score (Z in the text)
| α0 | β0 | γ0 | α1 | β1 | γ1 |
|---|---|---|---|---|---|
| −5.4 ± 0.96 | 1.33 ± 0.55 | 0.36 ± 0.10 | −1.53 ± 0.61 | 0.33 ± 0.24 | 0.19 ± 0.08 |
In examining the results one should keep in mind that what we consider here is ultimately a clinical decision problem, namely whether for a particular lesion in the gland, the probability that G≥4+3 is large enough, say at least 80%, to justify a way of clinical action – for instance further dose escalation on top of the standard treatment.
Figs.1 and 3 show, respectively, Pr(y=1|Z=0) and Pr(y=1|Z=1) as a function of R and V, revealing the significance of the MRS ratio for the Z=0 cohort, and the dominant influence of volume for both cohorts. Representative 95% probability intervals for, respectively, Pr(y=1|Z=0) and Pr(y=1|Z=1) are shown in Figs.2 and 4. The ability to quantify the uncertainty associated with an estimate of Pr(y=1) is a key element of the current method’s support for the aforementioned clinical decision problem. Figs.5–9 explore the relationship between Z, V, R and Pr(y=1) by comparing point estimates of Pr(y=1), and the associated 95% probability bands, for the same MRS ratios and volumes across the Z=0 and Z=1 cohorts. With the exception of “low” R and V values in figure 5, sextant biopsy has little effect on either the point estimates or uncertainty.
Fig. 1.
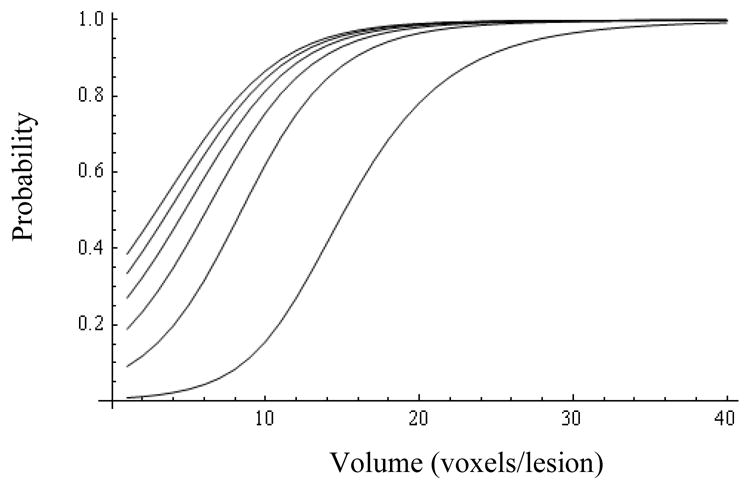
Probability of success (y=1) for patients with negative biopsy (Z=0) as a function of volume (abscissa) and MRS ratio (from bottom up: R=1, 6, 11, 16, 21, and 26).
Fig. 3.
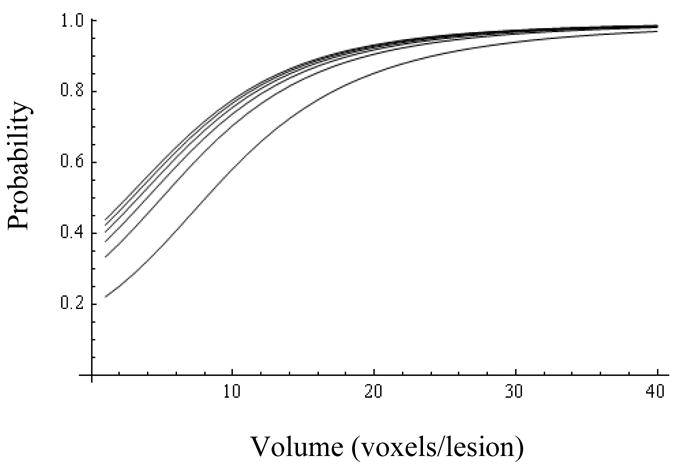
Probability of success for patients with high biopsy Gleason (Z=1) as a function of volume (abscissa) and MRS ratio (from bottom up: 1, 6, 11, 16, 21, and 26).
Fig. 2.
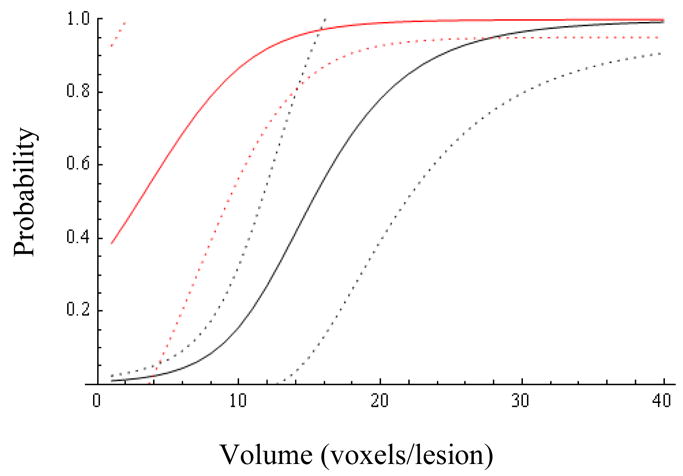
Probability of success and 95% confidence bands for patients with negative biopsy as a function of volume (abscissa) and MRS ratio (1=black, 26=red).
Fig. 4.
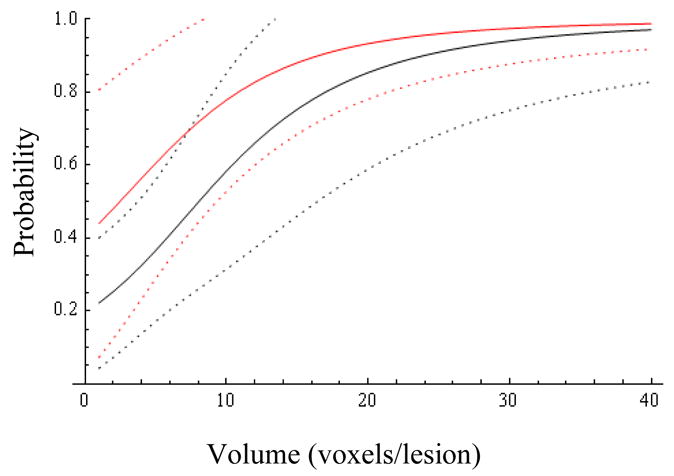
Probability of success and 95% confidence bands for patients with high biopsy Gleason (Z=1) as a function of volume (abscissa) and MRS ratio (1=black, 26=red).
Fig. 5.

The effect of the biopsy result (Z=0 blue, Z=1 black) on the expected probability of success and its 95% confidence bands for patients with MRS ratio 1.
Fig. 9.
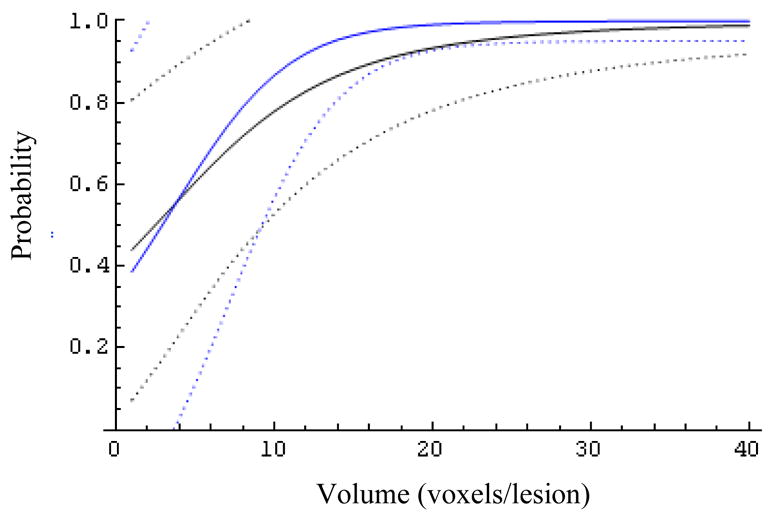
The effect of the biopsy result (Z=0 blue, Z=1 black) on the expected probability of success and its 95% confidence bands for patients with MRS ratio 26.
The results of this analysis, tempered by the informational content of the data, are consistent with the view that:
For lesions with both low- (Z=0, Fig. 1) and high-Gleason biopsy score (Z=1, Fig. 3), Pr(y=1) increases notably with lesion volume,
At low values of R a lesion volume of at least 15–20 voxels is needed to reach a probability of success of 80% (Fig. 5); the biopsy result (Z) helps reduce the uncertainty of the predicted probability of success.
At larger MRS ratios (R>6, Figs.6–9) the biopsy result becomes essentially uninformative, once the lesion volume is larger than about 12 voxels
With the exception of low values of R at Z=0, the MRS metabolite ratios serve primarily as a selection tool for assessing lesion volumes.
Fig. 6.
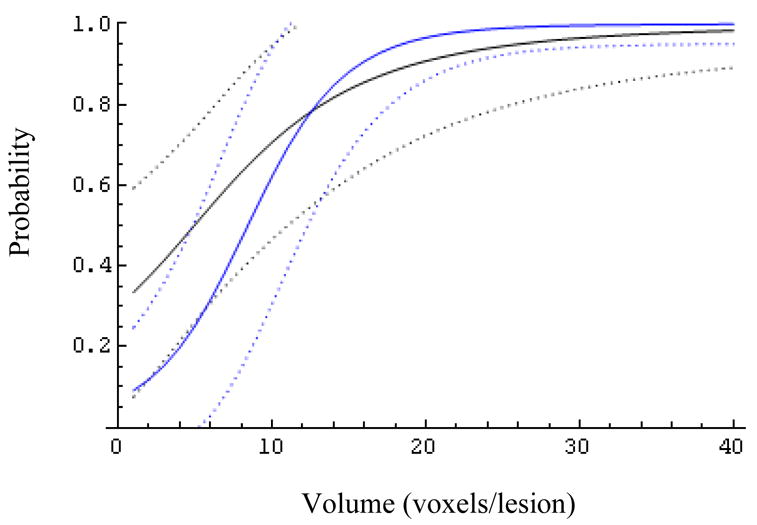
The effect of the biopsy result (Z=0 blue, Z=1 black) on the expected probability of success and its 95% confidence bands for patients with MRS ratio 6.
CONCLUSIONS
The probability distributions asserted here display the information we hold on this matter. We have identified three factors, all potentially available at the time of treatment planning, which can be used to evaluate the probability that a lesion has (pathologic) Gleason grade ≥4+3: biopsy Gleason grade, lesion volume and the average lesion MRS ratio. The presentation here has been oriented to highlight an understanding of this probability with the goal of deciding whether a particular lesion should be treated differently, e.g. with a larger than the customary dose.
In outline, the data and probabilistic model are supportive of the notion that large lesion volumes (e.g. >25) will contain, with high probability, high Gleason voxels irrespective of the biopsy result and/or MRSI ratio. The biopsy result appears mildly relevant at intermediate lesion volumes, and so is the MRSI ratio, R, for lesions with low biopsy Gleason.
The two main limitations of the data available for this study have to do with inadequate spatial resolution: a) the unavailability of pathologic Gleason grade at voxel (rather than lesion) level, and b) the lack of Gleason information for each biopsy core. The latter can be readily dealt with. To identify the MRS prostate voxel in a pathology specimen is a difficult problem; but the necessary methodology – essentially, the mechanics of deformable bodies – exists and has been in fact used already for prostate volumes (12).
The practical import of these findings derives from the possibility of conducting focal treatments and thus avoiding, or at least lessening, patient injury. One must recognize, however, that at this time we remain ignorant of whether there are radiosensitivity and/or proliferative differences between indolent (low Gleason) and aggressive (high Gleason) lesions (i.e. do we need dose escalation?), and – at a more basic level – whether inactivating such lesions prevents distant failure (i.e. why bother?). Answers to these questions are, however, beyond the scope of this analysis.
Fig. 7.
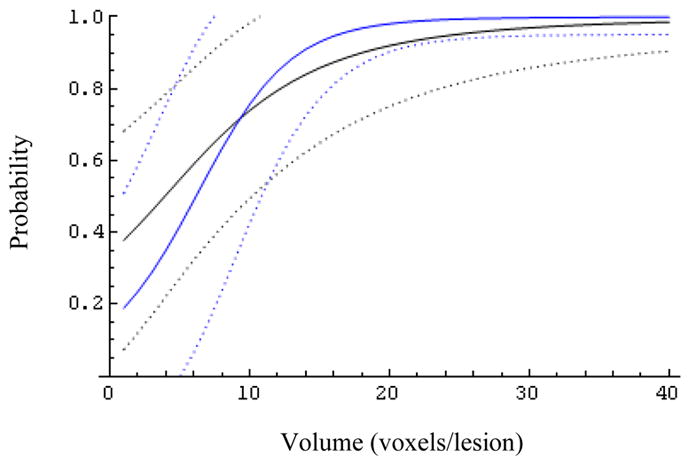
The effect of the biopsy result (Z=0 blue, Z=1 black) on the expected probability of success and its 95% confidence bands for patients with MRS ratio 11.
Fig. 8.
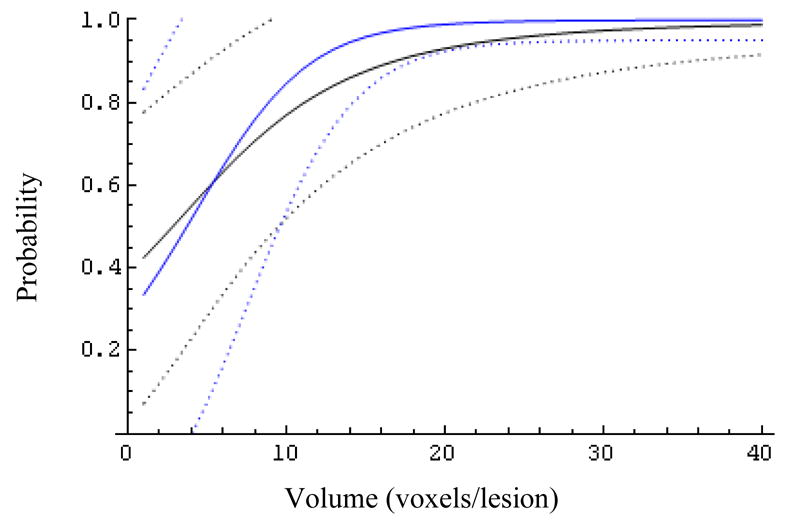
The effect of the biopsy result (Z=0 blue, Z=1 black) on the expected probability of success and its 95% confidence bands for patients with MRS ratio 21.
Footnotes
Conflict of Interest: none
Publisher's Disclaimer: This is a PDF file of an unedited manuscript that has been accepted for publication. As a service to our customers we are providing this early version of the manuscript. The manuscript will undergo copyediting, typesetting, and review of the resulting proof before it is published in its final citable form. Please note that during the production process errors may be discovered which could affect the content, and all legal disclaimers that apply to the journal pertain.
References
- 1.Zakian KL, Sircar K, Hricak H, et al. Correlation of proton MR spectroscopic imaging with Gleason score based on step-section pathologic analysis after radical prostatectomy. Radiology. 2005;234:804–14. doi: 10.1148/radiol.2343040363. [DOI] [PubMed] [Google Scholar]
- 2.Kuban DA, Thames HD, Levy LB, et al. Long-term multi-institutional analysis of stage T1–T2 prostate cancer treated with radiotherapy in the PSA era. Int J Radiat Oncol Biol Phys. 2003;57:915–28. doi: 10.1016/s0360-3016(03)00632-1. [DOI] [PubMed] [Google Scholar]
- 3.Zietman AL, Chung CS, Coen JJ, Shipley WU. 10-year outcome for men with localized prostate cancer treated with external radiation therapy: results of a cohort study. J Urol. 2004;171:210–4. doi: 10.1097/01.ju.0000100980.13364.a6. [DOI] [PubMed] [Google Scholar]
- 4.Zelefsky MJ, Yamada Y, Marion C, et al. Improved conformality and decreased toxicity with intraoperative computer-optimized transperineal ultrasound-guided prostate brachytherapy. Int J Radiat Oncol Biol Phys. 2003;55:956–63. doi: 10.1016/s0360-3016(02)04142-1. [DOI] [PubMed] [Google Scholar]
- 5.Zelefsky MJ, Cohen G, Zakian KL, et al. Intraoperative conformal optimization for transperineal prostate implantation using magnetic resonance spectroscopic imaging. Cancer Journal. 2000;6:249–55. [PubMed] [Google Scholar]
- 6.Barqawi A, Crawford ED. Focal therapy in prostate cancer: future trends. BJU Int. 2005;95:273–4. doi: 10.1111/j.1464-410X.2005.05278.x. [DOI] [PubMed] [Google Scholar]
- 7.Gleason DF. Histologic grading of prostate cancer: a perspective. Hum Pathol. 1992;23:273–9. doi: 10.1016/0046-8177(92)90108-f. [DOI] [PubMed] [Google Scholar]
- 8.Kattan MW, Zelefsky MJ, Kupelian PA, et al. Pretreatment nomogram that predicts 5-year probability of metastasis following three-dimensional conformal radiation therapy for localized prostate cancer. J Clin Oncol. 2003;21:4568–71. doi: 10.1200/JCO.2003.05.046. [DOI] [PubMed] [Google Scholar]
- 9.Takahashi S, Suzuki S, Takahashi S, Inaguma S, Asamoto M, Shirai T. Differences between latent and clinical prostate carcinomas: lower cell proliferation activity in latent cases. Prostate. 2006;66:211–7. doi: 10.1002/pros.20336. [DOI] [PubMed] [Google Scholar]
- 10.Gregory PC. Bayesian logical data analysis for the physical sciences a comparative approach with Mathematica support. Cambridge, UK: Cambridge University Press; 2005. [Google Scholar]
- 11.Wolfram Stephen. Standard Macintosh version 1.1. Champaign, IL: Wolfram Research; 1988. Mathematica. Ref Type: Computer Program. [Google Scholar]
- 12.Crouch JR, Pizer SM, Chaney EL, Zaider M. Medially based meshing with finite element analysis of prostate deformation. Medical Image Computing and Computer-Assisted Intervention - Miccai 2003. 2003;2878(Pt 1):108–15. [Google Scholar]


