Abstract
Among trypsin family proteases, bovine and porcine trypsins are currently the enzymes of choice for proteomics applications. However, there are trypsins from other sources that have higher catalytic activities than mammalian trypsins. Of these, Streptomyces erythraeus trypsin (SET) is particularly attractive, because SET has more than one order of magnitude greater amidase activity than mammalian trypsin and is resistant to autolytic degradation. These properties are advantageous for many proteomics applications. In order to evaluate this protease for proteomic applications, we expressed SET in E. coli, purified it to homogeneity, and then examined its enzymatic properties. As expected, recombinant SET (rSET) had greater than an order of magnitude higher amide bond hydrolysis activity (Km/kcat) for both Nα-benzoyl-L-arginine-p-nitroanilide and Nα-benzoyl-L-lysine-p-nitroanilide than modified porcine trypsin and did not show any sign of autolytic degradation after 96 hours of incubation at 37 °C. The performance of rSET for proteomic applications was evaluated by applying the protease for in-solution and in-gel digestion of bovine serum albumin, and for 18O labeling of peptides. These results confirmed that rSET has a potential to be an useful protease in such proteomic experiments. We also report various properties of rSET that are fundamental to the use of this protease for proteomics applications.
Keywords: Trypsin, Streptomyces erythraeus, SET, rSET, proteomics, 18O labeling, mass spectrometry
Introduction
Trypsin is by far the most widely used protease in proteomic analysis, primarily because it produces relatively short peptides with a basic amino acid residue (arginine or lysine) at the C-termini, making the peptides well-suited for collision-induced dissociation (CID) tandem mass spectrometric analysis.1 Currently, bovine and porcine trypsins are almost exclusively the trypsins of choice for proteomics application, presumably because these enzymes are readily available in abundant amounts and in highly pure form.
It is well known that mammalian trypsins undergo rapid autolytic degradation at neutral pH, resulting in a 95% reduction in the catalytic activity after 20 hours at 37 °C.2 It has been found that a moderate amount of calcium ion (20 mM) increases the stability of the mammalian trypsins.3 However, the stabilization effect is small. To reduce the autolytic activity dramatically, mammalian trypsin is often modified by reductive methylation of lysine residues, which has no detectable effect on the catalytic activity of the enzyme but reduces its susceptibility to autolysis. Methylation results in a reduction of the rate of autolysis to about 70% of the original catalytic activity after 20 hours at 37 °C.2 Similar results have been obtained with a commercial sequencing grade modified porcine trypsin4 which has also been reductively methylated. Clearly, there is a growing demand for autolysis-resistant trypsin in the proteomics field. Recently, Štosová and coworkers assessed the utility of Streptomyces griseus trypsin for proteomics applications.5 Unfortunately, chemical modification of arginine and lysine residues was required to suppress autolysis of this trypsin and that, in turn, reduced the catalytic activity of the trypsin by more than 60%.
We decided to test Streptomyces erythraeus trypsin (SET) for use in proteomics applications because this bacterial trypsin has been reported to possess more than an order of magnitude higher amidase activity than bovine trypsin6 and is resistant to autolysis due to the absence of an arginine or lysine residue in the so-called “autolysis loop”.7, 8 These remarkable features of SET are, therefore, expected to be advantageous to many proteomics applications. However, the protease has not been evaluated for use in proteomics applications.
SET is a member of a family of serine proteases that specifically hydrolyze both lysyl and arginyl peptide bonds using a catalytic mechanism that is essentially the same as that of trypsins from mammalian sources.9, 10 The mature SET consists of 227 amino acid residues with three disulfide bonds, shares 33% sequence identity with bovine trypsin, and folds to form a tertiary structure almost identical to bovine trypsin.9
In order to obtain adequate amount of SET to evaluate its potential use in proteomics applications, we established a system for the expression of SET in E. coli. that allowed us to purify the recombinant enzyme to homogeneity. We confirmed that recombinant SET (rSET) was resistant to autolysis, as predicted from the amino acid sequence of native SET, and has greater than 10-fold higher catalytic activity than mammalian trypsin. The purified rSET was tested for use for in-solution and in-gel protein digestion, and for 18O labeling of peptides.
Materials and Methods
Materials
Nα-benzoyl-L-arginine-p-nitroanilide (Bz-Arg-pNA) was purchased from Bachem Americas (Torrance, CA). Nα-benzoyl-L-lysine-p-nitroanilide (Bz-Lys-pNA) was from Wako Chemicals USA (Richmond, VA). Modified porcine trypsin was purchased from Promega (Madison, WI). Oxygen-18 enriched water (>95 atom % 18O) and bovine serum albumin (BSA) were from Sigma-Aldrich (St. Louis, MO). E. coli growth media, and protein molecular weight markers and buffers for electrophoresis were from USB (Cleveland, OH). All restriction endonucleases were purchased from New England BioLabs (Ipswich, MA).
Subcloning and expression of rSET
The nucleotide sequence of SET (NCBI accession number: D30760) was codon optimized for expression in E. coli and synthesized by Geneart (Toronto, ON, Canada) as shown in Figure S-1. The synthesized gene (Histag-proSET), which consisted of a His6-tag, a 12 amino acid residue pro-peptide sequence, and a mature SET sequence lacked the N-terminal 30 amino acid residue signal peptide sequence. The Histag-proSET sequence was PCR amplified using the primers: 5’-CATATGCATCATCATCATCACCATACCCC-3’ and 5’-TTAGGATCCTTAACGCGCGCTCACCGCAC-3'. After PCR amplification the product was cloned into pCR2.1-TOPO vector (Invitrogen, Carlsbad, CA), amplified and digested with BamHI and NdeI. The resulting Histag-proSET fragment was sub-cloned into pET19b vector (Novagen, Madison, WI). After the correct SET trypsin coding sequence was verified (Biotic Solutions, New York, NY), the pET19b-SET plasmid was transformed into BL21-AI™ E. coli (Invitrogen). One liter of terrific broth (TB) media was inoculated with 10 mL of an overnight culture and grown at 37 °C until an OD590 of 0.8 – 1.0 was achieved. The temperature was then decreased to 30 °C and protein expression was induced by the addition of arabinose to 0.2% and isopropyl β-D-thiogalactoside (IPTG) to a final concentration of 1 mM. After 5 h of induction, the cells were harvested and the cell pellet was stored at −80 °C until used for protein purification. The Histag-proSET does not have catalytic activity; therefore, it was expected to be less toxic to the bacterial host cells. Cleavage between the Histag-pro sequence and the SET sequence (Figure S-1) by chymotrypsin is required to produce the catalytically active mature SET.
Purification of rSET
The harvested cell pellet was lysed in a buffer consisting of 1 mg/mL lysozyme in buffer A (10 mM Tris-HCl pH 8.0, 300 mM NaCl, 10% glycerol, and 0.05% Tween 20). This and all subsequent steps of the purification were performed at 4 °C. After a 1 h incubation in buffer A, the viscous lysate was sonicated, centrifuged at 20,000g for 45 min, and the resulting supernatant was collected. The Histag-proSET protein was selectively enriched from the supernatant using a PrepEase® Histidine-tagged Protein Purification Maxi Kit - High Specificity (USB Corporation). Columns with Histag-proSET protein were washed two times with Buffer A and Histag-proSET was eluted with Buffer B (Buffer A containing 250 mM imidazole) in 0.5 ml fractions. Fractions containing Histag-proSET were identified by SDS-PAGE and pooled and dialyzed overnight against Buffer C (10mM Tris-HCl, pH 8.0, 150mM NaCl and 10mM CaCl2). The dialyzed protein was collected and digested with 0.6 µM chymotrypsin for 1 h at 37°C to remove the Histag-propeptide sequence from the proprotein.9 Following chymotrypsin treatment the solution was incubated with 1 mM Nα-p-tosyl-L-phenylalanine chloromethyl ketone (TPCK) for 1 h at 30 °C to irreversibly inactivate chymotrypsin. The mature rSET was then affinity purified using a soybean trypsin inhibitor (Pierce, Rockford, IL) affinity column (typically 5 mm id. × 5 mm) equilibrated with 100 mM Tris-HCl pH 8.0 containing 500 mM NaCl and 10% acetonitrile. rSET was loaded, the column was washed twice with equilibration buffer, and the bound rSET was eluted with Buffer D (50mM Glycine-HCl pH 2.5). The 250 µL eluate fractions were collected into tubes containing 50 µL of 1 M Tris-HCl, pH 8.0, to neutralize the solution. Fractions containing pure rSET were dialyzed against 50 mM ammonium bicarbonate and stored at −80 °C until use. Purification using immobilized soybean trypsin inhibitor resin ensures that only chymotrypsin-activated mature rSET is purified, because Histag-proSET cannot bind to the trypsin inhibitor resin. The yield of the recombinant SET was 4.3 mg/L of broth media or 0.5 mg/g of bacterial pellet.
Covalent structural characterization of rSET
The molecular weight of rSET was determined by electrospray mass spectrometry. Briefly, the purified rSET solution (1 pmol/µL) in 0.1% formic acid/50% acetonitrile was introduced into a QStar quadrupole/time-of-flight mass spectrometer (Applied Biosystems-MDS Sciex, Foster City, CA) equipped with a nanoelectrospray ion source using a syringe pump (Harvard Apparatus, Holliston, MA) to deliver solvent at a flow rate of 5 µL/min. The rSET (100 pmol) was also S-carbamidomethylated and digested with Lys-C alone and with a combination of Lys-C and Asp-N. The resulting digests were analyzed by LC-MS/MS using a QStar quadrupole/time-of-flight mass spectrometer and a LTQ-FT mass spectrometer (Thermo-Finnigan, Breman, Germany) as described previously.11 The tandem mass spectra of the peptides were interpreted manually.
Autolysis assay of rSET
To measure the autolysis rate, 2.0 µM rSET and modified porcine trypsin were each incubated in 50 mM ammonium bicarbonate at 37 °C. Aliquots were withdrawn at 0, 6, 12, 24, 48, and 96 h and stored at −80 °C until analyzed. Portions of each aliquot were analyzed by SDS-polyacrylamide gel electrophoresis and for amidase activity as described below. The gel was stained with SyproRuby (Bio-Rad, Hercules, CA) as per the manufacturer’s instructions
Amidase activity assay
The amidase activities of rSET and modified porcine trypsin were measured using Bz-Arg-pNA or Bz-Lys-pNA as substrates. The reaction was carried out in 100 mM Tris-HCl, pH 8.0 at 25 °C in a cuvette placed in an Agilent UV/Vis spectrophotometer (Santa Clara, CA). The amount of 4-nitroaniline produced during the reaction was determined using the molar absorption coefficient for 4-nitroaniline (ε= 4,600 M−1•cm−1) in 100 mM Tris-HCl, pH 8.0, at 405 nm. The concentrations of rSET, modified porcine trypsin, and substrates were determined by amino acid analysis performed at the Protein Chemistry Laboratory at Texas A&M University (College Station, TX). All reactions were carried out in triplicate. Data were analyzed using SigmaPlot 10.0 (Systat Software, Richmond, CA) and are presented as the average of triplicate measurements. Km and Vmax were determined by fitting the data to the Michaelis-Menten equation. The turnover number kcat was obtained by dividing the Vmax by the total amount of enzyme added to the reaction.
Measurement of in-solution and in-gel protein digestion activity
S-carbamidomethylated BSA was digested by rSET or modified porcine trypsin at an enzyme : substrate ratio of 1:100 (w/w) in 100 mM ammonium bicarbonate, and containing 2 M urea at 25 °C for 10 min, 1 h, or 5 h The reaction was stopped by addition of formic acid to a final concentration of 1% and the digest was desalted using a C18 ZipTip (Millipore, Bedford, MA) according to the manufacturer’s instructions. The resulting digests were analyzed by LC-MS/MS using a LTQ-Orbitrap mass spectrometer (Thermo-Finnigan) as follows. The digests were chromatographed on a reversed-phase C18 Acclaim PepMap 100 column (0.075 × 150 mm, Dionex, San Francisco, CA) using a linear gradient of acetonitrile from 2% to 60% in aqueous 0.1% formic acid over a period of 40 min at a flow rate of 250 nL/min, and the effluent was directly introduced to the mass spectrometer. The mass spectrometer was operated in a data-dependent MS to MS/MS switching mode, with the five most intense ions in each MS scan subjected to MS/MS analysis. The performance of rSET in the in-gel digestion was tested as described previously12 except gel band containing 2 µg BSA and 100 ng of rSET or modified porcine trypsin were used. The resulting digests were analyzed by LC-MS/MS as described above.
LC-MS/MS data were subjected to Mascot search against a database containing solely BSA amino acid sequence. Mascot database search software version 2.1.04 (Matrix Science, London, UK) was used. Mass tolerances for protein identification for precursor ion was set to 20 ppm and for product ion set to 1 Da. Strict trypsin specificity was applied, allowing for one missed cleavage. Only peptides with a minimum score of 20 were considered as significant.
Measurement of 18O labeling activity
The tryptic peptide mixture derived from 3.2 µg BSA (Michrom BioResources, Auburn, CA) was incubated with 0.16 µg of SET or modified porcine trypsin at 25 °C in 45 µL of 100 mM citrate buffer, pH 6.0, prepared with 95% H2 18O The final 18O content in the reaction mixture was 90%. Aliquots (7 µL) were withdrawn at 0, 30, and 60 min and the reaction was stopped by the addition of formic acid to a final concentration of 1%. The resulting peptides were analyzed by LC-MS/MS using a LTQ-Orbitrap mass spectrometer as described above.
Results and Discussion
Covalent structural characterization
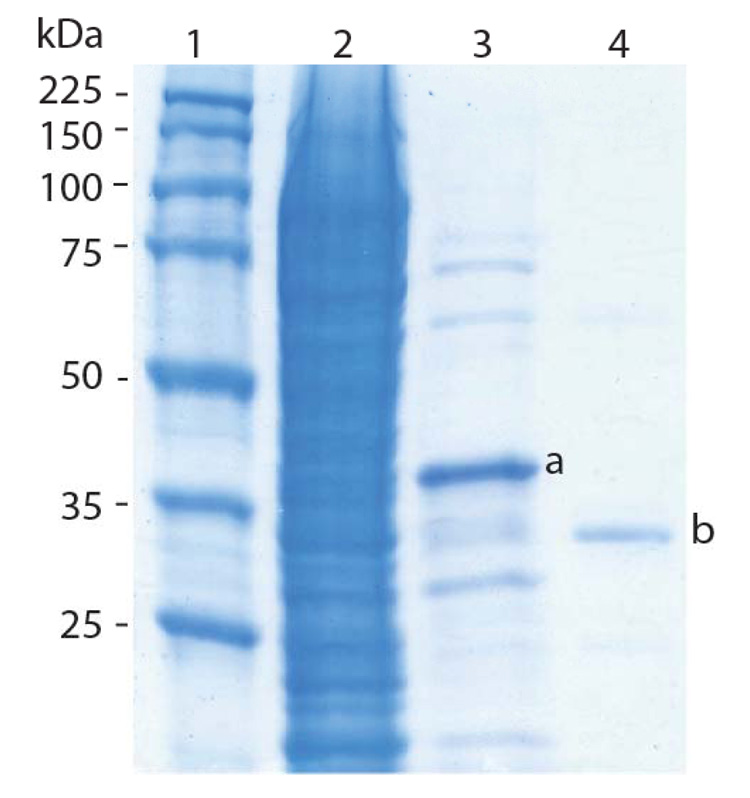
rSET was purified using sequential Ni2+ and soybean trypsin inhibitor affinity chromatography as described in Materials and Methods. Figure 1 shows SDS-PAGE analysis of the protein obtained after the two affinity purification steps. Nickel purified Histag-proSET and trypsin inhibitor purified mature rSET ran at an apparent MW of 40 kDa (Fig. 1, lane 3) and 35 kDa (Fig. 1, lane 4), respectively, despite the fact that the calculated MW for the Histag-proSET and the mature protein is correspondingly 28,616 and 23,633 Da. Note that the mature rSET was present as a single band (Fig. 1, lane 4). In both cases there was a 12 kDa offset between the calculated and apparent MW as determined by SDS-PAGE. The reason for this is not clear, however native SET has also been reported to exhibit an apparent MW of 35 kDa by SDS-PAGE.9
Figure 1.
SDS-PAGE analysis of rSET purification. Lane 1: Molecular weight markers; lane 2: E. coli cell lysate; lane 3: after Ni2+-TED-resin affinity chromatography and lane 4: after soybean trypsin inhibitor affinity chromatography. The protein bands labeled are Histag-proSET (a) and mature rSET (b).
To confirm the amino acid sequence of mature rSET, its molecular weight was measured by electrospray mass spectrometry. The calculated molecular weight from the observed spectrum was 23,630 Da (Figure S-2), which matched well to the molecular weight calculated from the expected amino acid sequence of rSET (23,633 Da). Mature rSET was also subjected to Lys-C alone and a combination of Lys-C and Asp-N digestion followed by LC-MS/MS to further analyze its amino acid sequence. The peptides sequenced by tandem mass spectrometry are shown in Figure S-3 and observed molecular masses of these peptides are listed in Table S-1. More than 95% of the rSET amino acid sequence was confirmed by the analyses, including N-and C-terminal peptides. Thus, these results support that rSET expressed in E.coli. has an amino acid sequence identical to the native SET with the exception of its C-terminal three-amino-acid residue extension (Ser-Ala-Arg) which native SET lacks.9
Stability against autolysis
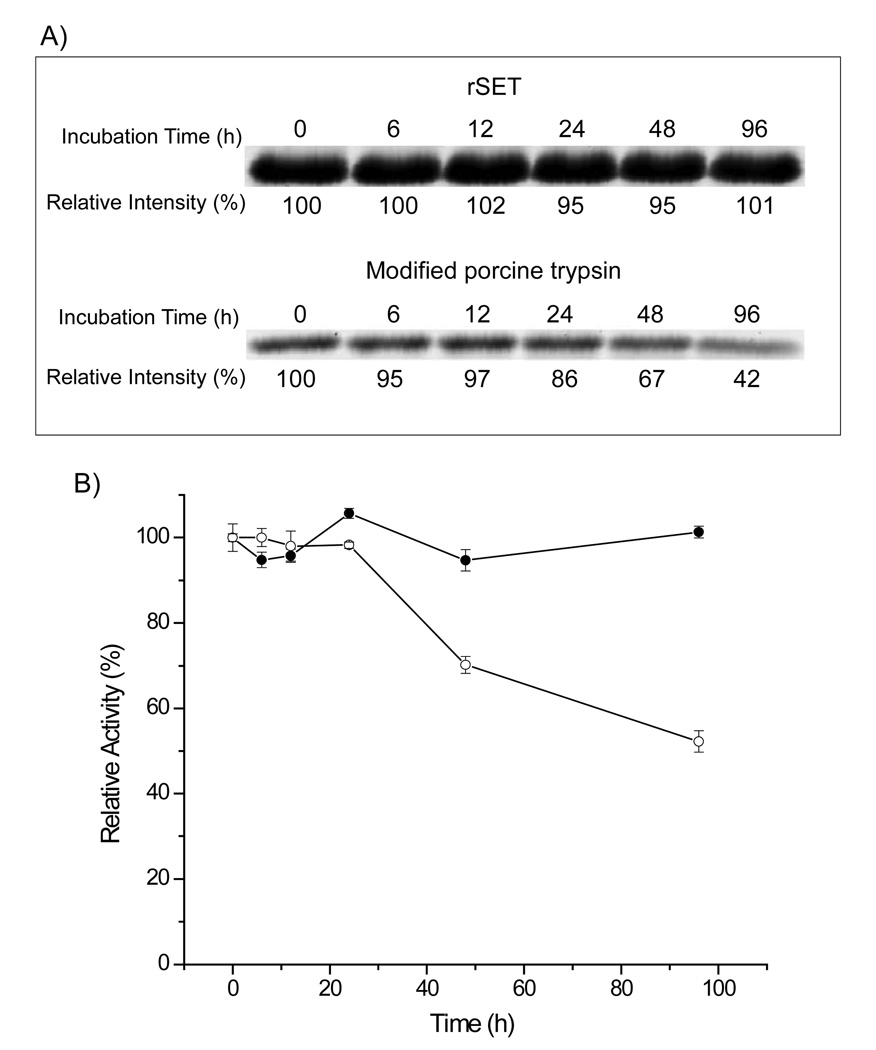
To test whether rSET is resistant to autolysis, rSET (2 µM) was incubated at 37 °C in 50 mM ammonium bicarbonate for various periods up to 96 h, analyzed by SDS-PAGE, and assayed for amidase activity. No reduction in rSET protein band intensity was observed by SDS-PAGE at any time point (Figure 2A), indicating that no autolysis occurred during the 96 h incubation. This was further supported by the amidase activity assay as shown in Figure 2B, in which rSET retained full activity even after 96 h of incubation. On the other hand, the band intensity of modified porcine trypsin decreased to 42% (Figure 2A) and the amidase activity to 52% after 96 h of incubation (Figure 2B). Taken together these results demonstrate that rSET is extremely stable against autolytic degradation. This remarkable stability of rSET can most likely be attributed to rSET’s lack of either a lysine or an arginine residue in the so-called autolysis loop (…NTSEGGQQAD…).7–9 In contrast, mammalian trypsin contains a lysine residue (e.g., the autolysis loop of bovine trypsin: …NTKSSGTSY…), allowing for trypsin cleavage.
Figure 2.
Stability of rSET and modified porcine trypsin against autolysis. rSET and modified porcine trypsin were incubated in 50 mM ammonium bicarbonate at 37 °C for different duration (0, 6, 12, 24, 48, and 96 h) and subjected to SDS-PAGE analysis (A) and amidase activity assay, -●-: rSET, -○-: modified porcine trypsin (B). Protein bands were quantified by densitometry using DeCyder software (GE Health Care) and normalized to 0 time. The result of activity assay are means ± standard deviation from triplicate reactions.
Enzymatic properties
Steady-state kinetic parameters
The steady-state kinetic parameters for the amide bond hydrolysis activity of rSET were obtained using Bz-Arg-pNA or Bz-Lys-pNA as a substrate. The substrate was incubated at a concentration of 0.01 – 10 mM with 170 nM rSET or modified porcine trypsin in 100 mM Tris-HCl, pH 8.0. Substrate concentration curves for rSET and modified porcine trypsin with Bz-Arg-pNA and Bz-Lys-pNA are shown in Figure S-4. Table 1 summarizes the kinetic parameters calculated by fitting the data to the Michaelis-Menten equation. For Bz-Arg-pNA the Km of rSET was approximately 13-fold smaller, kcat was 1.3-fold higher and kcat/Km was 16-fold higher than the Km, kcat and kcat/Km of modified porcine trypsin. For Bz-Lys-pNA the Km of rSET was approximately 7-fold smaller, kcat was 2-fold higher and kcat/Km was 15-fold higher than the Km, kcat and kcat/Km of modified porcine trypsin. Thus the results demonstrate that rSET has more than an order of magnitude higher amide bond hydrolysis activity (kcat/Km) than mammalian trypsin. The higher activity of rSET towards Bz-Arg-pNA and Bz-Lys-pNA is primarily due to the decrease in Km.
Table 1.
Steady-state kinetic parameters of rSET and modified porcine trypsin for amide bond hydrolysis using Bz-Arg-p NA and Bz-Lys-p NA as substrates.
| Kinetic parameters | rSET |
modified porcine trypsin |
||
|---|---|---|---|---|
| Bz-Arg-p NA | Bz-Lys-p NA | Bz-Arg-p NA | Bz-Lys-p NA | |
| K m | 0.55 (± 0.05) | 0.68 (± 0.05) | 7.06 (± 0.65) | 5.70 (± 0.45) |
| k cat (s−1) | 3.15 (± 0.07) | 1.04 (± 0.02) | 2.46 (± 0.12) | 0.56 (± 0.02) |
| k cat/K m (mM−1·s−1) | 5.73 (± 0.52) | 1.53 (± 0.12) | 0.35 (± 0.04) | 0.10 (± 0.01) |
Values represent the mean ± standard deviation.
The kcat/Km of rSET for Bz-Arg-pNA and Bz-Lys-pNA were 5.73 and 1.53 mM−1·s−1, respectively, indicative of 3.7-fold preference toward arginine substrates over lysine substrate. The kcat/Km of modified porcine trypsin for Bz-Arg-pNA and Bz-Lys-pNA were 0.35 and 0.10 mM−1·s−1, respectively, indicating 3.5-fold preference toward arginine substrates. Consequently, the degree of preference of both the proteases for arginine over lysine substrate in terms of kcat/Km value appeared to be similar. We expected to observe greater preference of modified porcine trypsin toward arginine substrate, because it has been reported that the preference of rat trypsin for D-Val-Leu-Arg-aminofluorocoumarin over D-Val-Leu-Lys-aminofluorocoumarin is 11.4-fold greater.13 The discrepancy could be due to the difference in substrates or sources of the trypsin between the present and the earlier study,13 or a use of reductively methylated trypsin in the present study.
Optimum pH
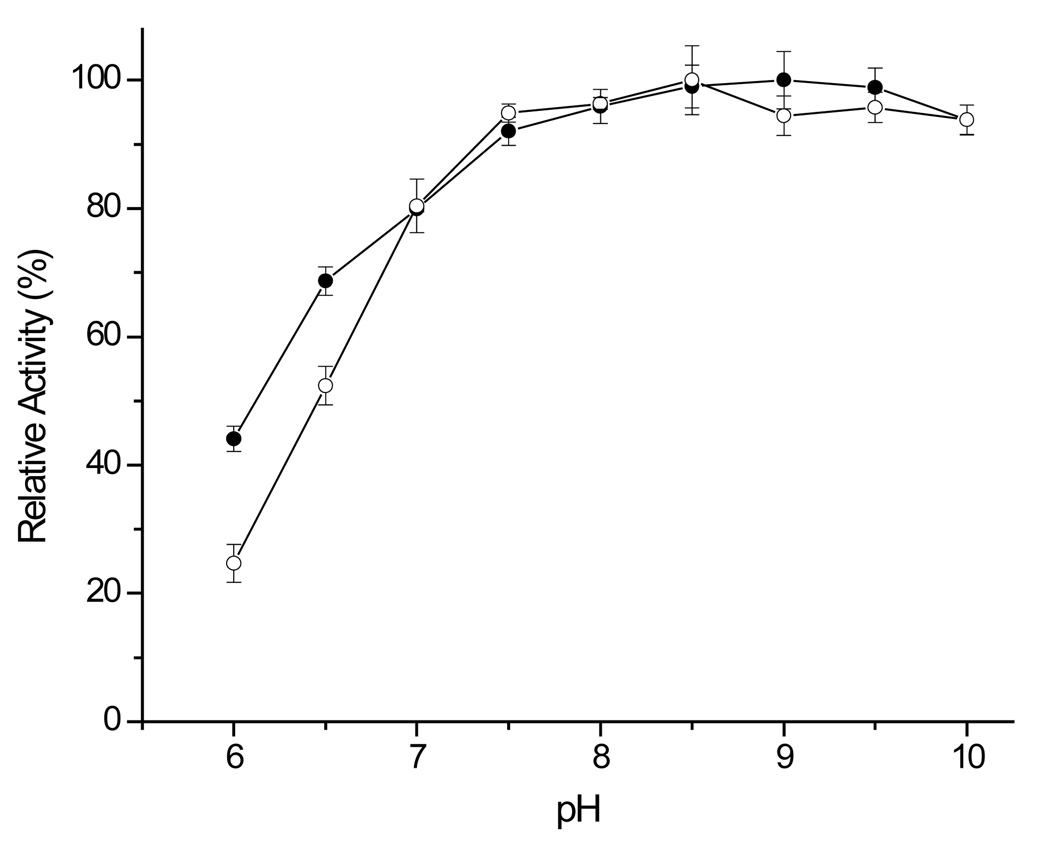
The optimum pHs of rSET and modified porcine trypsin were found to be broad, ranging from pH 7.5 to 9.5 using the amide substrate (Fig. 3). One notable difference on the pH profiles of rSET and modified porcine trypsin was the higher activity of rSET at acidic pH. rSET retained 44% of its maximum activity at pH 6.0, while modified porcine trypsin displayed only 25% of maximum activity at pH 6.0. The result for modified porcine trypsin was consistent with our previous report.11 Thus, rSET can be used across a wider range of pH values (pH 6–10). The relatively high activity of rSET at acidic pH values would be useful for protein digestion when acidic pH is required, for example, when determining disulfide linkages in a protein.
Figure 3.
pH profiles of rSET and modified porcine trypsin catalyzed hydrolysis of Bz-Arg-pNA. The reaction was carried out at 25 °C with 170 nM rSET or porcine trypsin and 10 mM Bz-ArgpNA. 100 mM Bis-Tris-propane buffers containing 50 mM NaCl having different pH values were used. -●-: rSET, -○-: modified porcine trypsin. The result of activity assay are means ± standard deviation from triplicate reactions.
Effect of urea and Gdn-HCl
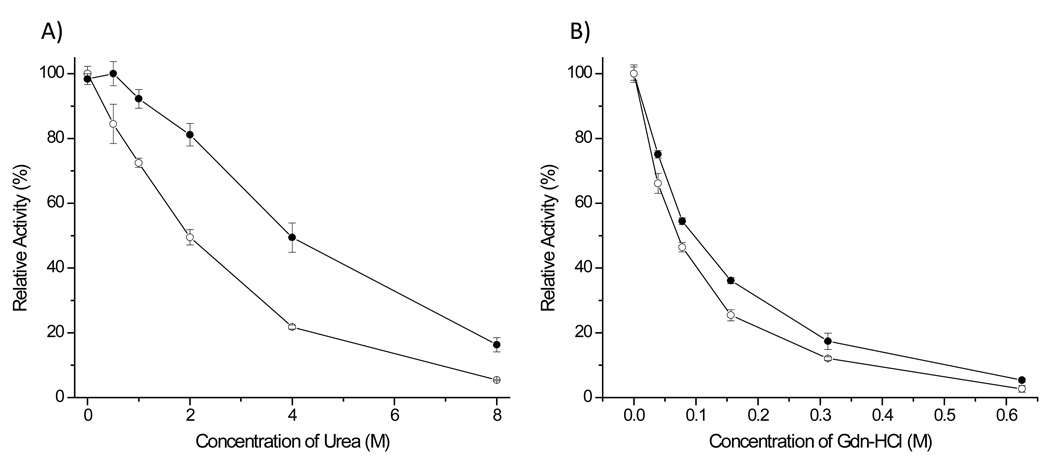
It is important to know the effect of urea and guanidine-hydrochloride (Gdn-HCl) on the amide bond hydrolysis activity of rSET for the practical use of this protease because these chaotropic agents are often used to denature and solubilize substrate proteins. As a comparison we examined the effect of these agents on both rSET and modified porcine trypsin. rSET retained approximately 80% and 50% of its activity in 2 M and 4 M urea, respectively, while modified porcine trypsin retained only 50% and 20% of its activity in 2M and M urea (Figure 4A), suggesting that rSET is significantly more resistant to urea than modified porcine trypsin. On the other hand rSET and modified porcine trypsin showed similar residual activity curve against different concentrations of Gdn-HCl in which both the proteases retained about 40% and 20% activity in 0.1 M and 0.3 M Gdn-HCl (Figure 4B).
Figure 4.
Effect of urea (A) and Gdn-HCl (B) on the amidase activity of rSET and modified porcine trypsin. rSET or modified porcine trypsin (170 nM) was incubated with 10 mM Bz-ArgpNA in 100 mM Tris-HCl pH 8.0 buffer in the presence of various amount of urea or Gdn-HCl at 25°C. -●-: rSET, -○-: modified porcine trypsin. The result of activity assay are means ± standard deviation from triplicate reactions.
Activities for in-solution and in-gel protein digestion
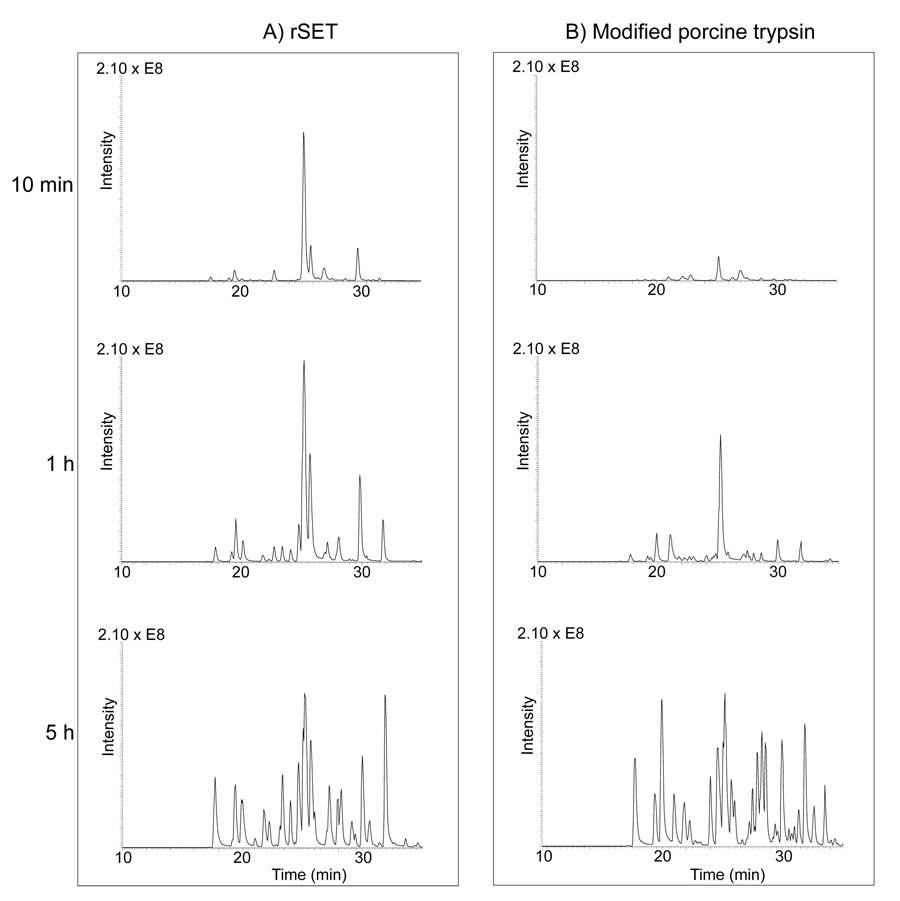
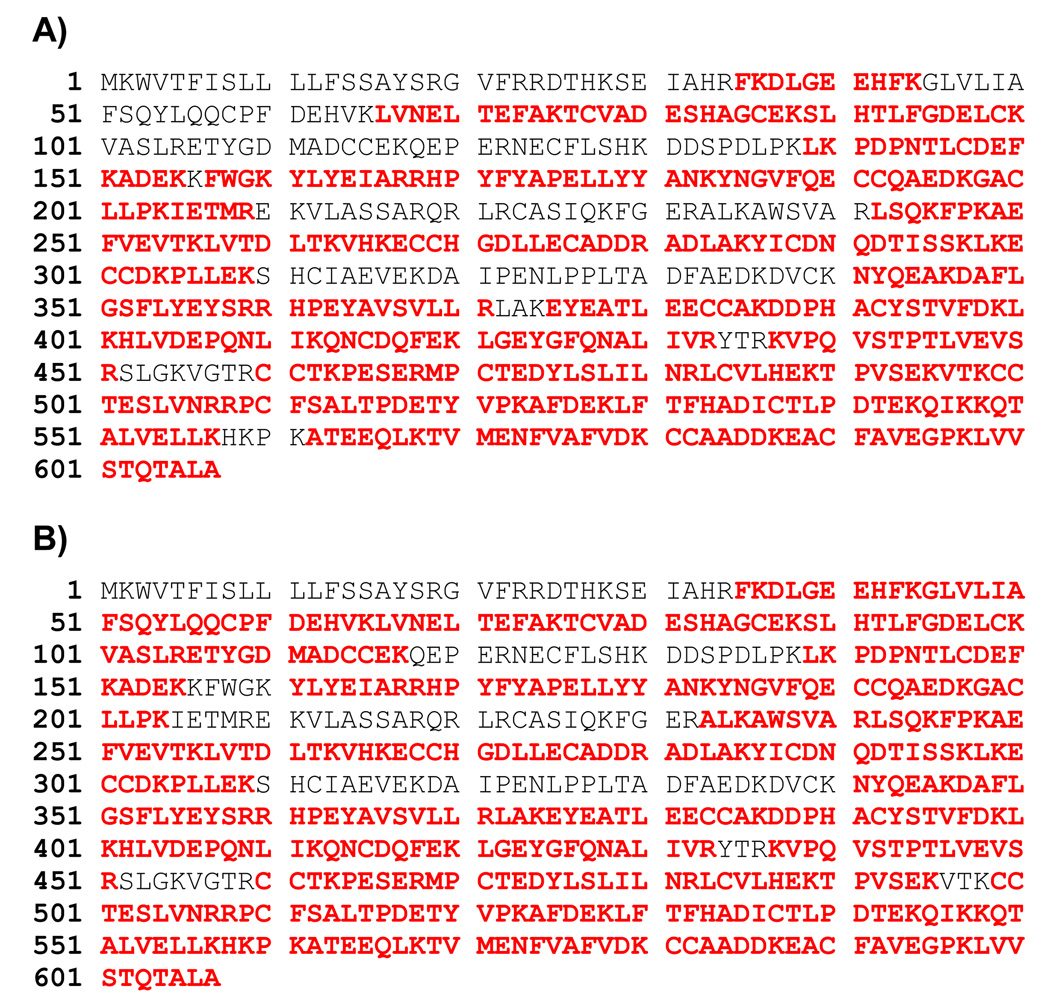
rSET exhibited a more than 10-fold higher amidase activity, measured as the initial rate for hydrolysis of small synthetic substrates, than did modified porcine trypsin. We therefore performed in-solution and in-gel protein digestions to test whether rSET maintained this higher amidase activity when proteins were used as substrates. For in-solution digestion, equal amounts rSET or modified porcine trypsin were incubated with S-carbamidomethylated BSA in 100 mM ammonium bicarbonate containing 2 M urea. The progress of digestion was monitored by LC-MS/MS (Figure 5), and the data were subjected to Mascot search to identify peptides. The progress of in-solution digestion by rSET was clearly faster than that by modified porcine trypsin reflected by the chromatographic peptide peak intensities in the total ion current chromatograms of the 10 min and 1 h digests. There was no difference in the chromatographic peak intensities of the 5 h rSET and modified porcine trypsin digests, suggesting that after 5 h digestions by these proteases were nearly complete. The profiles of chromatographic peaks between 5 h rSET and modified porcine trypsin digests were somewhat different, suggesting that rSET and porcine trypsin have slightly different substrate preferences. The amino acid sequence coverage of BSA by the 5 h rSET and modified porcine trypsin digestions were 71% and 78%, respectively, as shown in Figure 6. The identified peptides are also listed in Table S-2 with the observed molecular masses and the chromatographic retention times. We did not find any evidence for the hydrolysis of four –Lys-Pro– and one –Arg-Pro– bonds in BSA, suggesting that rSET cannot cleave before a proline residue. Further investigation is required in order to obtain a clear picture regarding rSET’s sequence preferences.
Figure 5.
Total ion current chromatograms of in-solution digested BSA by rSET (A) and modified porcine trypsin (B). S-carbamidomethylated BSA was digested by rSET or modified porcine trypsin at an enzyme to substrate ratio of 1:100 (w/w) in 100 mM ammonium bicarbonate containing 2 M urea at 25 °C for different time (10 min, 1 h and 5 h). The resulting digests were analyzed by LC-MS/MS.
Figure 6.
Amino acid sequence coverage of BSA by in-solution digestion of BSA by rSET (A) and modified porcine trypsin (B). LC-MS/MS data of 5 h BSA digests shown in Figure 5 were subjected to Mascot search against a database containing solely BSA amino acid sequence. Mascot database search software version 2.1.04 (Matrix Science, London, UK) was used. Mass tolerances for protein identification for precursor ion was set to 20 ppm and for product ion set to 1 Da. Strict trypsin specificity was applied, allowing for one missed cleavage. Only peptides with a minimum score of 20 were considered as significant. Identified peptides were shown in bold red.
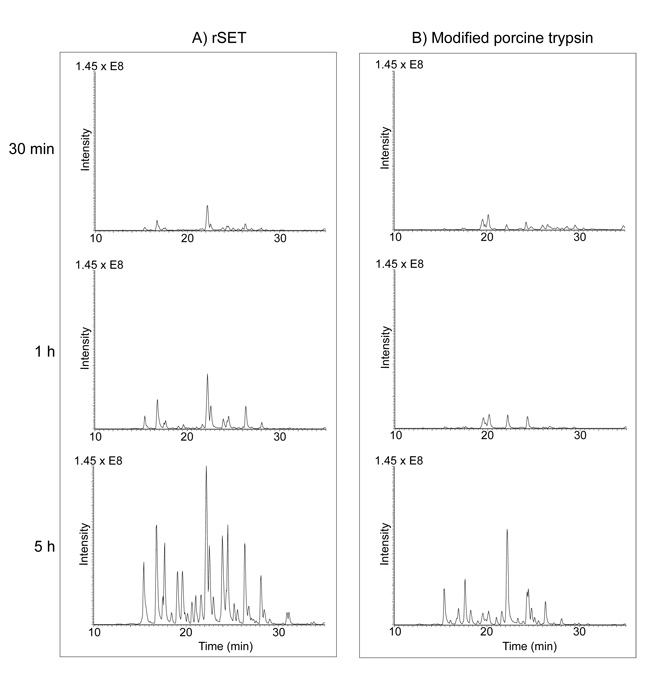
In-gel digestion by rSET and modified porcine trypsin were performed on S-carbamidomethylated BSA, and the progress of digestion was followed by LC-MS/MS (Figure 7). Similar to the in-solution digestion study the progress of the in-gel digestion by rSET was clearly faster than that by modified porcine trypsin as reflected by the chromatographic peptide peak intensities in the total ion current chromatograms. The amino acid sequence coverage of BSA by 5 h rSET and modified porcine trypsin digestions were 88% and 78%, respectively. The identified peptides are listed in Table S-3. Thus, our data demonstrates that the rate of digestion on protein substrates by rSET is higher than that by porcine trypsin as expected from the studies on small peptide substrates.
Figure 7.
Total ion current chromatograms of in-gel digested BSA by rSET (A) and modified porcine trypsin (B). A gel band containing 2 µg of BSA was digested by 100 ng of rSET or modified porcine trypsin in 100 mM ammonium bicarbonate at 25 °C for 0.5, 1 or 5 h. The resulting peptides were extracted from the gel and analyzed by LC-MS/MS.
18O labeling activity
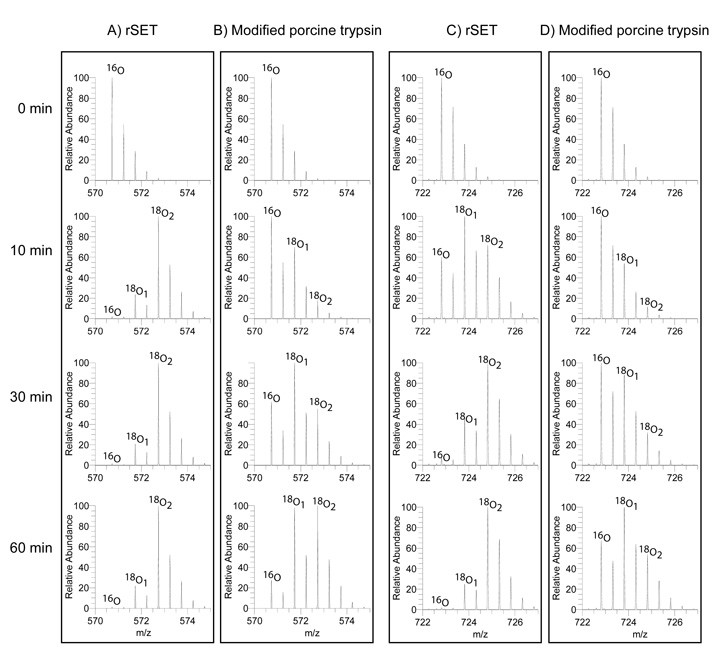
One of the major problems inherent in the technique of proteolytic 18O-labeling using trypsin is the variable incorporation of one or two 18O atoms (18O1/18O2) into each peptide species.14 Use of trypsin with higher catalytic activity is preferred in order to achieve complete incorporation of two 18O atoms. As the kinetic study described above shows, rSET has more than 10-fold higher amidase activity than modified porcine trypsin, so rSET would also expected to be highly efficient in the 18O-labeling (carboxyl oxygen exchange) reaction.11 To test this hypothesis, tryptic peptides derived from S-carboxymethylated BSA were incubated with rSET or modified porcine trypsin for different lengths of time and the resulting peptides were analyzed by LC-MS/MS. Figure 8 shows the mass spectra of representative peptides, CCTESLVNR (M + 2H: m/z 570.74) and RPCFSALTPDETYVPK (M + 2H: m/z 722.82), 18O-labeled by rSET (Figure 8A and C) and by modified porcine trypsin (Figure 8B and D). The results clearly show that there was complete incorporation of two 18O atoms by rSET for both peptides within 60 minutes of incubation (Figure 8A and C). In contrast, modified porcine trypsin had catalyzed the incorporation of only one 18O atom at 30 minutes, and complete incorporation of two 18O atoms was not achieved even after 60 minutes of incubation (Figure 8C and D). We observed the same trend for another 39 peptides. Thus, rSET is a better catalyst for 18O-labeling of peptides than porcine trypsin.
Figure 8.
Mass spectra of representative 18O labeled peptide catalyzed by rSET and modified porcine trypsin. Tryptic peptide mixture derived from BSA (3.2 µg) was dissolved in 100 mM citrate buffer (pH 6.0) made with H18O and incubated with 0.16 µg of rSET or modified porcine trypsin at 25 °C. The final 18O content in the solvent water was 90%. Aliquots were withdrawn at different intervals (0, 10, 30 and 60 min) and the resulting peptides were analyzed by LC-MS/ MS. (A) and (B): (M + 2H)+ ion of peptide CCTESLVNR labeled with 18O by rSET and modified porcine trypsin, respectively, for different reaction times. (C) and (D): ): (M + 2H)+ ion of peptide YICDNQDTISSK labeled with 18O by rSET and modified porcine trypsin, respectively, for different reaction times. Cysteine residues were carboxylmethylate.
Concluding Remarks
In summary, we have established an expression system and purification method for rSET. This protease was found to have significantly higher (> 10-fold) amide bond hydrolysis activity than modified porcine trypsin and to be extremely resistant to autolysis. rSET also showed relatively higher amide bond hydrolysis activity at acidic pH, was more resistant to urea, displayed higher in-solution and in-gel protein digestion rates, and had a significantly higher 18O-labeling (carboxyl oxygen exchange) activity than modified porcine trypsin. Thus, rSET has a potential to be an alternative to traditional trypsins for various proteomic applications involving protein digestion and 18O labeling.
Supplementary Material
Acknowledgements
We are grateful to Drs. K. C. Sekhar Rao and Alex Moise for their contribution to design the expression system of SET, to Drs. John W. Chase and Chao Yuan for helpful discussion, to Dr. Giri Gokulrangan for his assistance in LC-MS/MS analysis. This study was supported by NIH grant P30EY-11373 (Visual Sciences Research Center of Case Western Reserve University) and funds from the Case Western Reserve University and Cleveland Foundation.
References
- 1.Paizs B, Suhai S. Mass Spectrom Rev. 2005;24:508–548. doi: 10.1002/mas.20024. [DOI] [PubMed] [Google Scholar]
- 2.Rice RH, Means GE, Brown WD. Biochim Biophys Acta. 1977;492:316–321. doi: 10.1016/0005-2795(77)90082-4. [DOI] [PubMed] [Google Scholar]
- 3.Sipos T, Merkel JR. Biochemistry. 1970;9:2766–2775. doi: 10.1021/bi00816a003. [DOI] [PubMed] [Google Scholar]
- 4.Finehout EJ, Cantor JR, Lee KH. Proteomics. 2005;5:2319–2321. doi: 10.1002/pmic.200401268. [DOI] [PubMed] [Google Scholar]
- 5.Stosova T, Sebela M, Rehulka P, Sedo O, Havlis J, Zdrahal Z. Anal Biochem. 2008;376:94–102. doi: 10.1016/j.ab.2008.01.016. [DOI] [PubMed] [Google Scholar]
- 6.Yoshida N, Sasaki A, Inoue H. FEBS Lett. 1971;15:129–132. doi: 10.1016/0014-5793(71)80039-x. [DOI] [PubMed] [Google Scholar]
- 7.Yamane T, Iwasaki A, Suzuki A, Ashida T, Kawata Y. J Biochem. 1995;118:882–894. doi: 10.1093/jb/118.5.882. [DOI] [PubMed] [Google Scholar]
- 8.Yamane T, Kobuke M, Tsutsui H, Toida T, Suzuki A, Ashida T, Kawata Y, Sakiyama F. J Biochem. 1991;110:945–950. doi: 10.1093/oxfordjournals.jbchem.a123694. [DOI] [PubMed] [Google Scholar]
- 9.Nagamine-Natsuka Y, Norioka S, Sakiyama F. J Biochem. 1995;118:338–346. doi: 10.1093/oxfordjournals.jbchem.a124912. [DOI] [PubMed] [Google Scholar]
- 10.Sakiyama F, Kawata Y. J Biochem. 1983;94:1661–1669. [PubMed] [Google Scholar]
- 11.Hajkova D, Rao KC, Miyagi M. J Proteome Res. 2006;5:1667–1673. doi: 10.1021/pr060033z. [DOI] [PMC free article] [PubMed] [Google Scholar]
- 12.Palamalai V, Darrow RM, Organisciak DT, Miyagi M. Mol Vis. 2006;12:1543–1551. [PubMed] [Google Scholar]
- 13.Craik CS, Largman C, Fletcher T, Roczniak S, Barr PJ, Fletterick R, Rutter WJ. Science. 1985;228:291–297. doi: 10.1126/science.3838593. [DOI] [PubMed] [Google Scholar]
- 14.Miyagi M, Rao KC. Mass Spectrom Rev. 2007;26:121–136. doi: 10.1002/mas.20116. [DOI] [PubMed] [Google Scholar]
Associated Data
This section collects any data citations, data availability statements, or supplementary materials included in this article.


