Abstract
Here we report that ferricytochrome c (cyt c3+) induces oxidation of hydroethidine (HE) and mitochondria-targeted hydroethidine (Mito-HE or MitoSOX ™ Red) forming highly characteristic homo- and heterodimeric products. Using a HPLC-electrochemical (EC) method, several products were detected from cyt c3+-catalyzed oxidation of HE and Mito-HE and characterized by mass spectrometry and NMR techniques as follows: homodimers (HE-HE, E+-E+; Mito-HE-Mito-HE, Mito-E+-Mito-E+) and heterodimers (HE-E+ and Mito-HE-Mito-E+), as well as the monomeric ethidium (E+) and mito-ethidium (Mito-E+). Similar products were detected when HE and Mito-HE were incubated with mitochondria. In contrast, mitochondria depleted of cyt c3+ were much less effective in oxidizing HE or Mito-HE to corresponding dimeric products. Unlike E+ or Mito-E+, the dimeric analogs (E+-E+ and Mito-E+-Mito-E+) were not fluorescent. Superoxide () or Fremy's salt react with Mito-HE to form a product, 2-hydroxy-mito-ethidium (2-OH-Mito-E+) that was detected by HPLC. We conclude that HPLC-EC but not the confocal and fluorescence microscopy is a viable technique for measuring superoxide and cyt c3+-dependent oxidation products of HE and Mito-HE in cells. Superoxide detection using HE and Mito-HE could be severely compromised due to their propensity to undergo oxidation.
Keywords: Hydroethidine, cytochrome c, mitochondria, HPLC, superoxide, dimerization
Introduction
Recent reports indicate that hydroethidine (HE) (Fig. 1) is a selective probe for detecting superoxide [1,2]. HE reacts fairly rapidly with (k = 2 × 10⁶ M−1s−1) forming a unique red fluorescent marker product, 2-hydroxyethidium cation (2-OH-E+) [3,4]. Results from these studies dispelled the long-held notion that superoxide reacts with HE to form ethidium (E+) as a product. Both 2-OH-E+ and E+ exhibit a “red fluorescence” that is enhanced by DNA [1,2]. Although subtle differences in the spectroscopic properties between E+ and 2-OH-E+ were used to selectively detect 2-OH-E+ and E+ in cells under well-defined conditions [4], the fluorescence techniques were largely deemed to be unsuitable for superoxide measurements in cells [2,5]. Using the HPLC-fluorescence method, it was previously shown that the increase in intracellular “red fluorescence” arising from HE could not be solely attributed to 2-OH-E+, as E+ was also formed intracellularly from HE during oxidation [2,5]. However, the mechanism of E+ formation in cells remained unclear, although E+ could be formed from photosensitized oxidation of HE in superoxide-dependent manner [6].
Figure 1.
Chemical structures of HE, E+ and 2-OH-E+ and their mitochondria-targeted analogs.
In order to detect mitochondria-generated superoxide, a new analog of HE bearing a positively-charged triphenylphosphonium moiety (Mito-HE or also MitoSOX ™ Red, Fig. 1) that accumulated in mitochondria was synthesized [4]. This mitochondria-targeted probe was shown to react with superoxide forming a hydroxylated mito-ethidium cation, similar to that formed from the HE/superoxide reaction [4]. Other pathways of hydroethidine oxidation also exist. Benov et al. suggested that HE can be oxidized by cyt c3+ via a free radical mechanism to form a dimeric product [7]. Moreover, recent research suggests that mitochondrial cytochromes could also oxidize HE to a dimeric product [8]. The probe (MitoSOX ™ Red) is being used in the detection and quantitation of mitochondria-generated superoxide [9-11]. As mitochondria are enriched with cyt c3+ (0.1 to 5 mM) [12,13] within the intermembrane compartment, we decided to investigate this reaction in detail. In this study, we report the detection and characterization of several homo- and heterodimeric products along with E+ and Mito-E+ that are formed from the reaction between cyt c3+ and HE or Mito-HE. These findings further render the use of confocal and fluorescence microscopy technique for intracellular superoxide measurements, ambiguous and misleading.
Materials and Methods
Materials
HE (hydroethidine or dihydroethidium), E+ (ethidium bromide) and Mito-HE (MitoSOX™ Red) were from Molecular Probes. Xanthine oxidase from cow milk, superoxide dismutase from bovine erythrocytes and protease inhibitor cocktail were purchased from Roche Diagnostics Corporation. Catalase (beef liver) was from Boehringer Mannheim GmbH. Other reagents were from Sigma-Aldrich and were of the highest purity available. 2-OH-E+ was prepared as reported previously [6,14].
Preparation of solutions
The solutions were prepared as described previously for HE [3,6,14]. Because of the low solubility of Mito-HE in 0.1 M HClO4 we used the stock solutions in DMSO. Note: most of these compounds avidly bind to the vial wall, especially with plastic tubes or silanized glass (data not shown). As that process could be inhibited by lowering the pH of the solution (that causes the protonation of the compounds) and by addition of organic solvents, we attribute it to hydrophobic interaction between the compounds and the vials' walls. This is further supported by observation that the extent of binding is higher for mitochondria-targeted compounds that are expected to have higher n-octanol/water partition coefficient (Table 1 S). To minimize the binding process we used glass vials in all experiments and minimized the contact of the solutions with plastic. Moreover after stopping the reaction the solution was always acidified and minimum 25% of organic solvent (MeOH or MeCN) was present.
HPLC with electrochemical detection (HPLC-EC)
The HPLC-EC system for analysis of HE and its oxidation products has been described previously [3,6]. For analysis of mito-HE, and its oxidation products we used the same system (equipped with Synergi Polar RP, Phenomenex column) but using a gradient elution with ratios of A:B mobile phases changing from 35:65 to pure B phase over a period of 30 min followed by 20 min elution using a pure mobile phase B. For the clarity of the figures the potentials applied to the electrode array have been shown only in Figure 2B and were the same in the case of all measurements.
Figure 2.
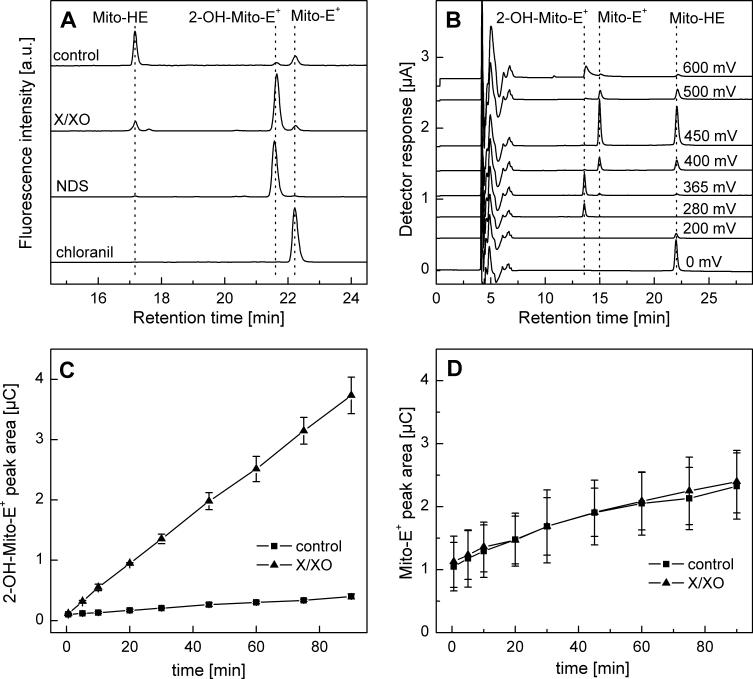
HPLC characterization of Mito-HE and its oxidation products. A) HPLC-fluorescence analysis of products formed from Mito-HE (50 μM) incubated without any additive (control) or with xanthine (1 mM)/xanthine oxidase (2 mU/ml) (X/XO) or nitrosodisulfonate (NDS, 100 μM) or chloranil (25 μM) for 1 h in phosphate buffer (50 mM, pH 7.4) containing DTPA (0.1 mM). Samples were analyzed following dilution (1:1) with ice-cold phosphate buffer (1 M, pH 2.6). B) HPLC-EC chromatogram of a mixture of Mito-HE, 2-OH-Mito-E+ and Mito-E+ (ca. 1 μM each) in a phosphate buffer pH 2.6 (saturated solution) containing 25% (by vol.) methanol. C) HPLC-EC peak areas of 2-OH-Mito-E+ formed from incubations containing Mito-HE (50 μM) , xanthine (0.1 mM) and xanthine oxidase (0.1 mU/ml) in phosphate buffer (pH 7.4, 50 mM) containing 0.1 mM DTPA. D) Same as (C), except that HPLC-EC peak area of Mito-E+ was measured.
HPLC with fluorescence and absorption detection
HPLC experiments were performed using an Agilent 1100 system. For detecting Mito-HE and its oxidation products, typically 50 μl of sample was injected into the HPLC system equipped with a C18 column (Alltech, Kromasil, 250 × 4.6 mm, 5 μm) that was equilibrated with 20% CH3CN (containing 0.1% (v/v) trifluoroacetic acid (TFA)) in 0.1% TFA aqueous solution. 10 min after injection, the CH3CN fraction was increased to 45% and the compounds were eluted during a linear increase in CH3CN fraction from 45% to 55% over the next 20 min (using a flow rate of 0.5 ml/min). All other settings were the same as described previously for HE analysis [14].
NMR and MS
1H NMR and 13C NMR spectra were recorded at 300.13 MHz and 75.54 MHz, respectively. 1H NMR and 13C NMR were obtained in DMSO-d6 or in CD3OD, values in hertz. Assignments of 1H and 13C NMR signals of the compounds were made with the help of the DEPT (Distortionless Enhancement by Polarisation Transfer), HMBC (Heteronuclear Multiple Bond Correlation) and HMQC (Heteronuclear Multiple Quantum Correlation) sequences. Elemental analysis was determined at the University of Aix-Marseille III. Mass spectra were obtained using the 7.0 Tesla Fourier Transform Ion Cyclotron Resonance (FTICR) Mass Spectrometer interfaced with an Agilent 1100 HPLC system.
UV-Vis absorption and fluorescence measurements
The UV-Vis absorption spectra were collected using an Agilent 8453 spectrophotometer. Fluorescence spectra were measured using the Perkin-Elmer LS 55 luminescence spectrometer.
Stopped-flow measurements
Stopped-flow kinetic experiments were performed on Applied Photophysics 18MX stopped flow spectrophotometer equipped with photodiode array (PDA) and photomultiplier (PM) for absorption and photomultiplier for fluorescence measurements. For spectral characterization of the products PDA detector was used while for kinetic analysis PM detectors were used. To monitor the decay of HE by fluorescence intensity measurements, the excitation wavelength was set to 356 nm and the 400 nm cut-off filter was used to select the range of wavelengths of emission light.
Preparation of mitochondria
Mitochondria were isolated from rat liver as described elsewhere [15]. Briefly, the tissue was homogenized in H-medium (220 mM mannitol, 70 mM sucrose, 10 mM HEPES, and 2 mM EDTA, pH 7.3) supplemented with protease and phosphatase inhibitors. The homogenate was centrifuged at 2000 × g for 10 min to remove the cellular debris and nuclear pellet. The post-nuclear supernatant was then centrifuged at 10,000 × g for 20 min to pellet out mitochondria. The pellet was washed twice with the H-medium and resuspended in the same buffer. The mitochondrial suspension was layered on 0.8 M sucrose and centrifuged at 10,000 × g for 20 min to remove any contaminating cytosol and microsomes. The final pellet was resuspended in the H-medium, and protein content estimated by Lowry's method.
Preparation of cytochrome c depleted mitochondria
Mitochondria were depleted of cyt c by two different methods. First method involved hypo-osmotic treatment of mitochondria to disrupt the outer mitochondrial membrane [16]. For this, purified mitochondria were first suspended in 150 mM KCl for 10 min and centrifuged at 10,000 × g for 10 min. The pellet was washed twice in 150 mM KCl and the cyt c content was determined by western blotting. In the second method mitoplasts were prepared by treating purified mitochondria (17 mg/ml) with digitonin (6 mg/ml) in H-medium on ice for 15 min [17]. At the end of incubation, the reaction mixture was diluted with cold H- medium and centrifuged at 10,000 × g for 15 min. Pelleted mitoplasts were resuspended in H-medium in the same volume as starting mitochondrial suspension and analysed for cyt c content as follows. Purified mitochondria and cyt c depleted mitochondria were solubilized in laemmli buffer and the proteins separated on 8−15% SDS PAGE. The separated proteins were transferred onto PVDF membrane and immunoblotted for cyt c using anti-cytochrome c monoclonal antibody (BD Biosciences). Subunit I of cytochrome oxidase was used as loading control and detected using mouse monoclonal antibodies (Mitosciences). To verify the integrity of the inner membrane, we assayed for complex II activity in intact and cyt c depleted mitochondria according to the established method [18]. In brief, 20 μg of freeze thawed mitochondria was incubated for 10 min in assay medium (25 mM potassium phosphate, pH 7.2, 5 mM MgCl2) containing 20 mM succinate and 50 μM DCIP. Reaction was started by adding 65 μM ubiquinone and the reduction of DCIP monitored by spectrophotometry at 600 nm. Specific activity was expressed as the nmoles of DCIP reduced per minute per mg mitochondrial protein.
Optimization of structure
The geometry of E+-E+ dication was optimized in vacuo using the AM1, PM3, and RM1 semi-empirical methods implemented in the Hyperchem 8.0 molecular modeling package.
Results
Superoxide-mediated oxidation of Mito-HE: product analyses by HPLC
To determine whether the reaction between superoxide and Mito-HE yields the same type of products as those formed during the HE/superoxide reaction, Mito-HE was incubated with xanthine/xanthine oxidase (X/XO) and the product(s) analyzed by HPLC. Figure 2A shows the product profile detected by HPLC-fluorescence. A major peak attributable to a hydroxylated product of Mito-HE was detected from incubations containing Mito-HE and X/XO. The same product was obtained from reacting Mito-HE with Fremy's salt (nitrosodisulfonate, NDS) (Fig. 2A). The stoichiometry of the reaction between Mito-HE and NDS was determined by varying the concentrations of NDS (0−120 μM) at a fixed concentration of Mito-HE (40 μM). Results indicate that two molecules of NDS were needed to convert one molecule of Mito-HE into 2-OH-Mito-E+. Formation of Mito-E+ was negligible under these conditions (not shown). By analogy with the HE/NDS reaction [14], the structure of the product was assigned to 2-hydroxy-mito-ethidium (2-OH-Mito-E+) (Fig. 1). This assignment was further confirmed by MS analysis which shows the m/z values of 323.66 (z = 2) and 646.31 (z = 1, deprotonated form) for the product formed from the Mito-HE/X/XO or Mito-HE/NDS reaction.
The NMR spectral analyses of the hydroxylated product formed from Mito-HE indicate that the hydroxyl group is attached at position 2 (Supplemental Figure 1S, Table 1). We then confirmed that no other products, including the two-electron oxidation product of Mito-HE (i.e., Mito-E+), were formed during the oxidation of Mito-HE by X/XO. An authentic standard of Mito-E+ (m/z value of 315.66 (z = 2)) was prepared by oxidizing Mito-HE with chloranil or tetrachlorobenzoquinone, which acts as a hydride (two electrons and a proton) acceptor.
Table 1.
Chemical shifts (ppm) and couplings (J, Hz) of selected HE- and Mito-HE-derived oxidation products.
| Product |
Chemical shifts (ppm) and coupling constants (Hz) |
|||||
|---|---|---|---|---|---|---|
| H1 | H2 | H4 | H7 | H9 | H10 | |
| E+a | 8.66 | 7.35 | 7.40 | 6.26 | 7.53 | 8.60 |
| (J = 9.25) | (J = 9.25, 1.70) | (J = 1.70) | (J = 2.45) | (J = 9.25, 2.45) | (J = 9.25) | |
| 2-OH-E+a | 7.21 | – | 7.11 | 6.08 | 7.23 | 8.24 |
| (J = 2.26) | (J = 9.25, 2.26) | (J = 9.25) | ||||
| E+-E+b | 8.77 | – | 7.72 | 6.54 | 7.57 | 8.63 |
| (J = 2.27) | (J = 9.07, 2.27) | (J = 9.07) | ||||
| 2-OH-Mito-E+b | 7.51 | – | 7.39 | 6.42 | 7.54 | 8.44 |
| (J = 2.13) | (J = 9.16, 2.13) | (J = 9.16) | ||||
in (CD3)2SO
in CD3OD
Previously we reported that HPLC-EC is nearly 10-fold more sensitive than HPLC-fluorescence for detecting HE, 2-OH-E+, and E+ [6]. Thus, we adapted the same technique for detection of Mito-HE-derived products. The chromatogram of a mixture of Mito-HE, 2-OH-Mito-E+ and Mito-E+ is shown in Figure 2B. The order of the potentials at which the products undergo oxidation is similar to HE (i.e., Mito-HE < 2-OH-Mito-E+ <Mito-E+). However, the elution profiles of these compounds differ from the corresponding products derived from HE.
To investigate whether 2-OH-Mito-E+ is the only product of the reaction between Mito-HE and superoxide, Mito-HE (50 μM) was incubated with xanthine (100 μM) and xanthine oxidase (0.1 U/ml) and the reaction products were monitored as a function of time (Fig. 2C and D). In the presence of XO we observed a linear increase in 2-OH-Mito-E+ concentrations. Under these conditions, there was no significant change in Mito-E+ formation as compared to the control incubation without XO. Also at different fluxes of superoxide (0 − 1.0 mU/ml XO), 2-OH-Mito-E+ was detected as the only major product formed from the reaction between Mito-HE and superoxide (data not shown). From these results, we conclude that Mito-E+ was not formed from the direct reaction between Mito-HE and superoxide.
Characterization of products formed from cytochrome c-induced oxidation of hydroethidine and mito-hydroethidine
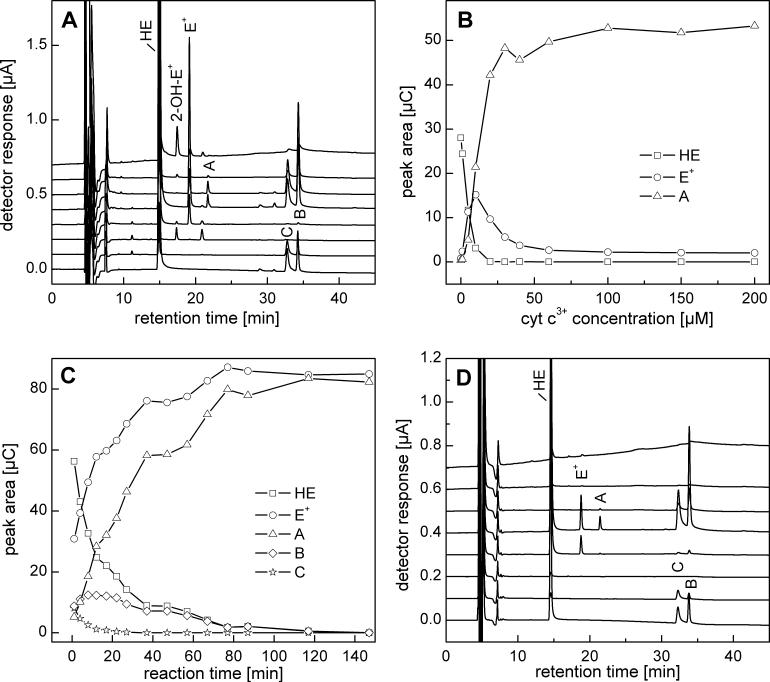
HPLC-EC analysis of incubations containing HE and cyt c3+ revealed the presence of several products including E+ and those corresponding to peaks A (21.5 min) , B (34.0 min), and C (32.5 min) (Fig. 3A). The distribution of products was dependent on the relative molar ratio of HE and cyt c3+. As shown in Figure 3B, the concentration of E+ was maximal at equimolar concentrations of cyt c3+ and HE, while at higher cyt c3+ concentrations compound “A” was the major product. To assess whether cyt c3+ can catalytically oxidize HE in the presence of H2O2, HE (50 μM) was incubated with cyt c3+ (5 μM) and H2O2 (50 μM) (Fig. 3C). Under these conditions HE was totally consumed within 1 h, despite the fact that the concentration of HE was 10 times higher than that of cyt c3+. This was attributed to the peroxidase-like activity of cyt c3+ [19]. Peaks corresponding to products B and C in Figure 3C are proposed as reaction intermediates and A and E+ are designated as final products. As products B and C (Fig. 3A) are oxidized at nearly the same electrode potential as that of HE, we inferred the presence of a reduced phenanthridinium ring structure. Moreover, the time course experiments (Fig. 3C) suggest that product C is a precursor of product B. However, both compounds B and C were very transient in the presence of cyt c3+ and H2O2 as they were quickly consumed to form the final product “A”. Next we investigated whether similar products can be synthesized independently via an alternate one-electron oxidation process. To this end, ferricyanide was used as a one-electron oxidant. Previously, it was suggested that HE could be oxidized by ferricyanide to a single product via one electron transfer mechanism, followed by radical dimerization [8]. Figure 3D shows the HPLC-EC analysis of incubations containing HE and ferricyanide. The same products were observed as those detected in the cyt c3+ /HE oxidation reaction.
Figure 3.
Oxidation of HE with cyt c3+ and ferricyanide. A) HPLC-EC chromatogram of a mixture of HE (50 μM) and cyt c3+ (5 μM) incubated for 40 min in phosphate buffer (50 mM, pH 7.4) containing DTPA (0.1 mM). The reaction was stopped and protein precipitated by mixing (1:1) with an ice-cold solution of 0.2 M HClO4 in MeOH. For HPLC analysis the supernatant was diluted (1:1) with phosphate buffer 1 M, pH 2.6. B) Effect of cyt c3+ concentration on HPLC-EC peak areas of selected analytes measured from reaction mixtures containing HE (10 μM) and cyt c3+ (0−0.2 mM) incubated for 15 min. Samples were processed as above. C) The dependence of the HPLC peak areas of HE and its oxidation products on the time of incubation with 5 μM cyt c3+ and H2O2 (50 μM). Other conditions and sample processing are as in A. D) HPLC-EC chromatogram of a reaction mixture consisting of HE (40 μM) and 20 μM K3Fe(CN)6 incubated for 10 min in phosphate buffer (50 mM, pH 7.4) containing DTPA (0.1 mM). Prior to analysis, the sample was diluted (1:9) with ice-cold phosphate buffer (1 M, pH 2.6).
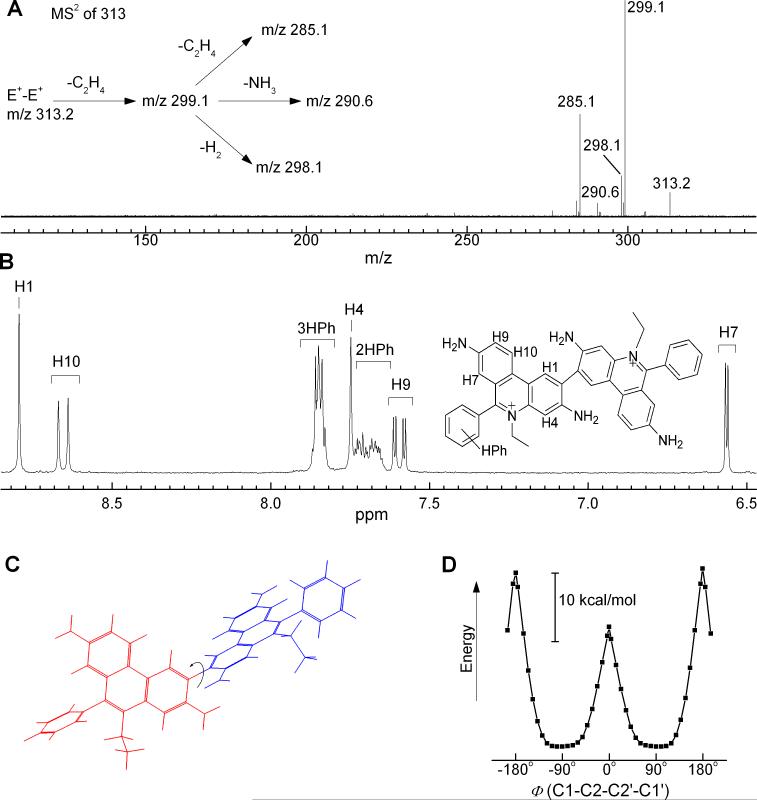
The ESI-MS analysis of product A indicates an m/z value of 313.15 (Fig. 4A). This coupled with the charge of the molecule (z = 2) determined from the distance between the isotopic peaks suggests a homodimeric structure, i.e., diethidium (E+-E+). The structure of the dimer has been determined by NMR-based techniques (Fig. 4B and 3S, see below). To obtain additional information on the relative orientation of the two ethidium moieties the semi-empirical calculations (AM1, PM3 and RM1) were performed. From the results we conclude that both phenanthridinium moieties are nearly orthogonal to each other (Fig. 4C). Moreover the calculated energy profile for rotation of both phenanthridinium moieties along C2-C2, bond clearly indicates that the orthogonal position of the two moieties is the most preferred configuration while the geometry with both moieties in one plane is energetically unfavorable (Fig. 4D). The MS analysis of HPLC fractions corresponding to B (m/z = 627.32 for parent compound and 314.15 for single protonation) and C (m/z = 629.34 for single protonation and 315.17 for double protonation) suggest a HE-E+ and HE-HE dimeric structure, respectively.
Figure 4.
Characterization of the structure of the final product of oxidation of HE by cyt c3+. The product “A” (Figure 3A) was analyzed by (A) MS-MS technique and (B) 1H NMR technique. C) Geometry of the molecule as calculated in vacuo by RM1 semiempirical method. For the picture clarity, the two ethidium moieties are shown in different colors. The arrow indicates the rotation along the C1-C2-C2'-C1' torsion bond. D) The changes in calculated enthalpy of formation (RM1 method) of E+-E+ as the function of the torsion bond value Φ(C1-C2-C2'-C1') between the two phenanthridinium rings.
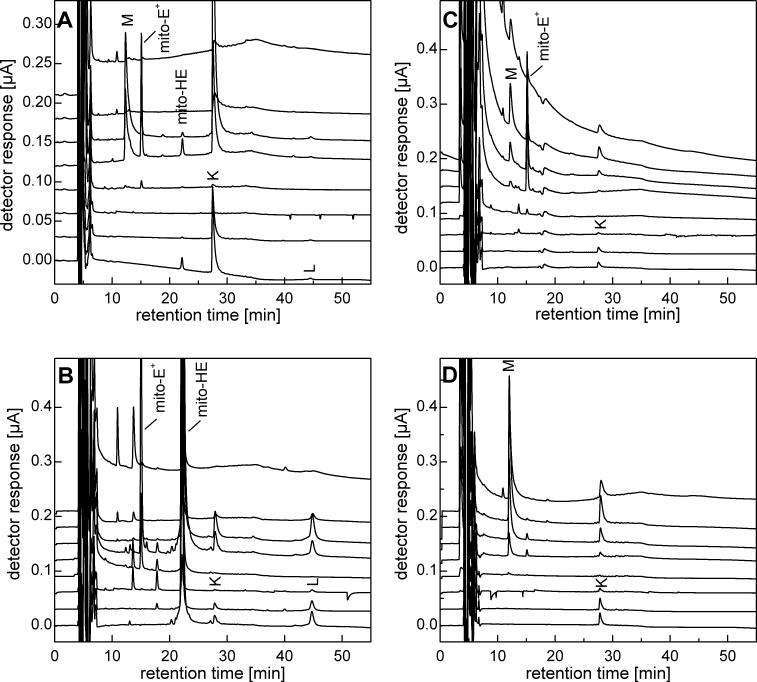
Analogous to the HE/ferricyanide reaction, Mito-HE oxidation by ferricyanide also leads to several products denoted by K (retention time, 28 min) , L (44 min), and M (12 min) (Figure 5). Compounds K and L were oxidized at potentials similar to Mito-HE that were detected in high yields when the ferricyanide/Mito-HE ratio was less than 2. The product M corresponding to the retention time ca. 12 min (at ferricyanide/Mito-HE ratio of 3) was oxidized at a potential similar to that of Mito-E+. By analogy with HE, we attribute the peak L to a homodimer of Mito-HE and the peal K to a heterodimer containing the Mito-HE and Mito-E+ moiety. Finally, the peak M was assigned to a homodimer of Mito-E+. The structural identity of the homodimer of Mito-E+ species was confirmed by MS analysis that shows the peaks at m/z of 315.17 and 418.89 corresponding to the charge (z = 4) and its deprotonated form (z = 3), respectively. The oxidation of Mito-HE by cyt c3+ results in the formation of dimeric products as well as the monomeric cation (Figure 5B). Although the overall profile of Mito-E+ formed from the reaction between Mito-HE and cyt c3+ is similar to that observed for the HE/cyt c3+ reaction (data not shown), there are some marked differences as well. Whereas the dimer (E+-E+) formation was elevated at higher concentrations of cyt c3+, a similar trend with regard to formation of the homodimer (Mito-E+-Mito-E+) was not noticeable. In fact, we detected Mito-E+ as the only major oxidation product over a range of cyt c3+ concentrations. This may be attributed to coprecipitation of the dimer, Mito-E+-Mito-E+, with cyt c, as we recovered relatively high amount of the dimer following extraction of cyt c pellet with pure acetonitrile (Figure 5C,D). The fluorescence spectra show increased binding of Mito-E+ and related products to mitochondrial proteins (not shown).
Figure 5.
Oxidation of Mito-HE by ferricyanide and cyt c3+. A). HPLC-EC chromatogram of a mixture of Mito-HE (50 μM) and potassium ferricyanide (100 μM) incubated for 15 min in phosphate buffer (50 mM, pH 7.4) containing DTPA (0.1 mM). Prior to analysis, the sample was diluted (1:9) with ice-cold phosphate buffer (1 M, pH 2.6). B) HPLC-EC chromatogram of a reaction mixture of Mito-HE (50 μM) and cyt c3+ (10 μM) incubated for 15 min in phosphate buffer (50 mM, pH 7.4) containing DTPA (0.1 mM). The reaction was stopped and protein precipitated by mixing with a 1:1 mixture of ice-cold 0.2 M HClO4 in MeOH. For HPLC analysis, the supernatant was diluted (1:1) with phosphate buffer (1 M, pH 2.6). C) Conditions were the same as in panel (B), except that the concentration of cyt c3+ was 200 μM. D) Conditions were the same as in panel (C) , except that the pellet obtained after treatment with 0.2 M HClO4 in MeOH was extracted with acetonitrile and the supernatant was diluted (1:3) with phosphate buffer (1 M, pH 2.6) prior to HPLC analysis.
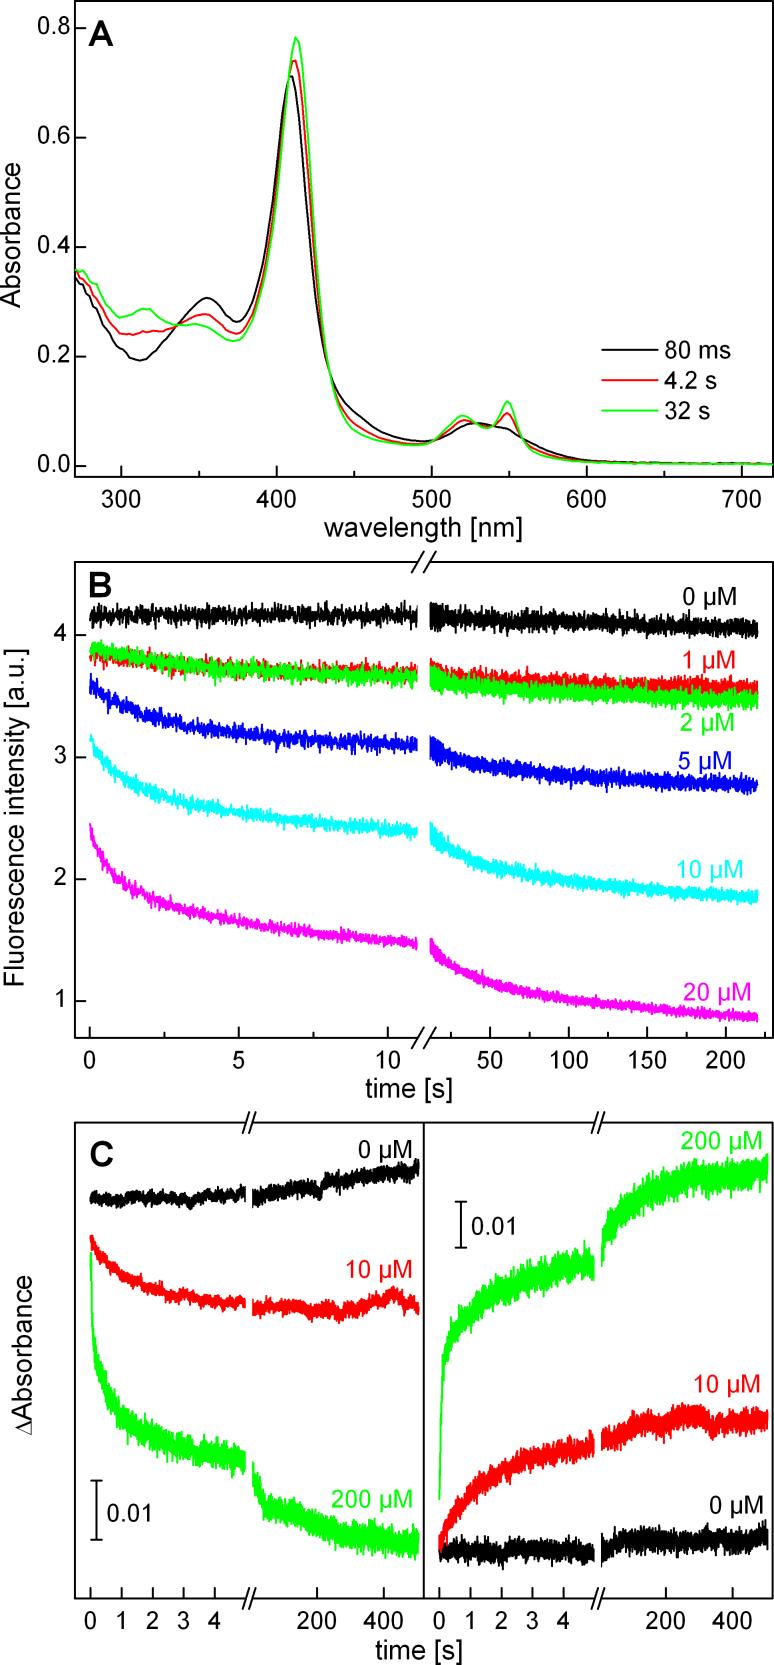
To assess if there is any difference in the rate of oxidation of HE or Mito-HE by cyt c3+, we used the stopped-flow as well as the HPLC techniques. The reaction between HE and cyt c3+ yielded reduced cyt c with characteristic absorption bands at 520 and 550 nm (Figure 6A). In the presence of cyt c3+, the decay of HE fluorescence as well as of absorbance at 363 nm and the build up of the absorbance at 550 nm were enhanced (Figure 6B,C). As we could not readily fit the data using a single exponential mechanism, we estimated the rate constant for this reaction as 104 - 105 M−1s−1. A similar kinetic profile was observed with Mito-HE and cyt c3+ reaction (Supplemental Figure 2S). As shown in the kinetic profiles, the reduction of cyt c3+ consists of both the “fast” and “slow” components, similarly to the published data [7]. We attribute the “slow” component to the redox reaction between cyt c3+ and the intermediate oxidation products of HE (or Mito-HE). From these results, we conclude that the reaction kinetics between cyt c3+ and HE or Mito-HE are similar.
Figure 6.
Stopped-flow analysis of the reaction between HE and cyt c3+. A). Time resolved UV-Vis absorption spectra (Applied Photophysics 18MX) collected during the oxidation of HE (10 μM) with cyt c3+ (10 μM) in phosphate buffer (50 mM, pH 7.4) containing DTPA (0.1 mM). Photodiode array detector employing an optical pathlength of 1.0 cm was used. B). The fluorescence traces showing the decay of HE as a function of cyt c3+ concentration. The same system was used except that the photomultiplier detector was equipped with a cut-off filter (> 400 nm), using the excitation light at 350 nm. C) Changes in the absorbances at 355 nm (left panel) and 550 nm (right panel) during the reaction with different concentrations of cyt c3+ (optical pathlength: 2 mm, photomultiplier detector).
Characterization of oxidation products of HE and Mito-HE in isolated mitochondria
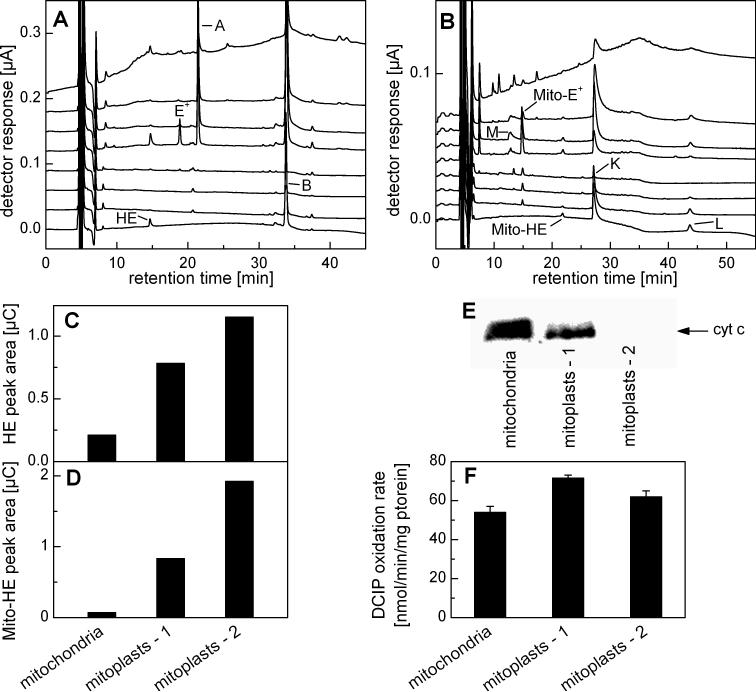
The oxidation products of HE and Mito-HE in isolated mitochondria were determined using the rat liver mitochondria. After incubating HE or Mito-HE with mitochondria, the organic (acetonitrile) extracts from the mitochondrial pellets were analyzed using the HPLC-EC technique. The HPLC-EC chromatograms of the extracts are shown in Figure 7A and B. There was a rapid consumption of the probes within less than 15 min of incubation with mitochondria, as evidenced by a small residual amount of HE and Mito-HE. The major peaks in the chromatogram were attributed to the monomeric cations (E+ or Mito-E+) and to the dimeric species (HE-HE, HE-E+, E+-E+ and Mito-HE-Mito-HE, Mito-HE-Mito-E+, Mito-E+-Mito-E+). As noted for the cyt c3+/Mito-HE reaction, the amount of detectable homo- and heterodimers was considerably decreased.
Figure 7.
HPLC analyses of products formed from oxidation of HE and Mito-HE in isolated mitochondria. A) HPLC-EC chromatogram of HE (10 μM) incubated for 15 min with rat liver mitochondria (0.5 mg/ml) in H-medium containing succinate (1 mM) at 37 °C. The mitochondrial pellet was extracted with cold MeCN and supernatant diluted 1:3 with ice-cold 0.2 M phosphate buffer pH 2.6 for HPLC analysis. B) The same as in A, but Mito-HE (10 μM) was used instead of HE. C) The HPLC-EC peak areas of HE as detected from the extracts of the pellet obtained from incubation of HE (10 μM) in H-medium containing mitochondria or mitoplasts (0.5 mg/ml). The conditions of incubation and sample processing are described in panel A. D) Same as in (C) but Mito-HE (10 μM) was used instead of HE. E) Western blot analysis of cyt c content in intact mitochondria and mitoplasts prepared by digitonin (mitoplasts – 1) and hypoosmotic (mitoplasts – 2) treatments. F) The complex II activity in mitochondria and mitoplasts as determined by measuring the rate of reduction of 2,6-dichloroindophenolate (DCIP).
To investigate whether cyt c3+ is responsible for oxidizing HE and Mito-HE, we prepared mitochondria depleted of cyt c (mitoplasts). As seen in Figure 7E, compared to digitonin treatment, hypoosmotic shock treatment reduced cyt c level by more than 90%. To check the integrity of the inner membrane in mitoplasts preparation, we measured the complex II activity (Fig. 7F) and the level of subunits I and II of cytochrome c oxidase (data not shown). These results indicate that mitoplasts were intact and that both treatments used in mitoplasts preparation did not cause any damage to the inner membrane. With decreasing cyt c, we noted an increasing intramitochondrial levels of HE (Fig. 7C). Under these conditions, a decrease in the E+-E+ concentration was noted (data not shown). Similarly, with decreasing cyt c, an increase in the intramitochondrial levels of Mito-HE was observed (Fig. 7D). From these results, we conclude that mitochondrial cyt c plays a significant role in the oxidation of HE and Mito-HE, although other oxidation pathways including the electron transfer chain could be also involved. In fact, we have observed catalytic oxidation of HE by cytochrome c oxidase isolated from rabbit heart mitochondria (data not shown).
Discussion
In this study we identified that the product of the reaction of Mito-HE with as 2-OH-Mito-E+, similar to the reaction product. While the possibility of formation of the hydroxylated cation during the reaction of Mito-HE with was suggested earlier [4], the authors could not distinguish between the two possible isomeric forms of the product (hydroxylation at the carbon atom C(2) or C(9)). The proposed structure of the product was 9-OH-Mito-E+. Our results, however, strongly support the formation of 2-OH-Mito-E+. Both HE and Mito-HE react with cyt c3+ to form several products, including E+, Mito-E+ and the respective homo and heterodimers. In the presence of H2O2 and cyt c3+, these probes were oxidized at a much faster rate due to the peroxidase activity of cyt c3+. The same products are also formed during the reaction of HE with horseradish peroxidase (data not shown). Based on these findings, we propose that the presence of homo- and heterodimers of HE and Mito-HE may be used as a quantitative indicator of the intracellular one-electron oxidation process. Superoxide detection using HE and Mito-HE may be severely compromised due to their propensity to undergo oxidation.
Similarities in redox chemistry between HE and Mito-HE
Results indicate that both HE and Mito-HE react with superoxide or NDS forming the corresponding hydroxylated products (2-OH-E+ and 2-OH-Mito-E+) and with chloranil forming the two-electron oxidation products E+ and Mito-E+, respectively. As with HE/superoxide reaction, 2-OH-Mito-E+ was formed as a unique marker product during the Mito-HE/superoxide reaction. This hydroxylated product was also generated from Mito-HE reaction with Fenton's reagent (not shown), however the formation of 2-OH-Mito-E+ was superoxide dismutase (SOD)-inhibitable. Addition of hydroxyl radical scavengers (ethanol or formate) to the Fenton's system containing Mito-HE increased the formation of 2-OH-Mito-E+ which was inhibited by the superoxide dismutase, consistent with the notion that hydroxyethyl and carbon dioxide anion radicals formed from ethanol and formate enhanced superoxide generation (not shown). These findings are very similar to those observed with HE [3]. Using large amounts of iron (0.5 mM) and hydrogen peroxide (0.5 mM), investigators claimed that hydroxyl radicals also could oxidize HE to form 2-OH-E+ [20]. The effect of SOD on 2-OH-E+ formed under these conditions was not, however, determined [20]. By reacting HE with Fenton's reagent, we detected only low levels of 2-OH-E+ (that was inhibited by SOD) formed from the reaction between HE and superoxide radicals [3].
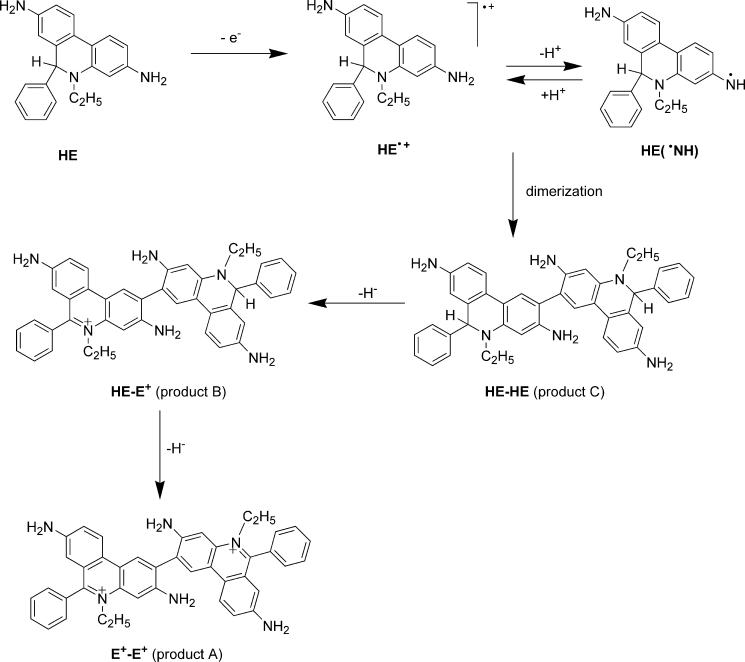
The present findings suggest that both cyt c3+ and ferricyanide initially oxidize HE via a one-electron transfer mechanism forming the HE radical cation or the neutral radical. This radical could disproportionate to form ethidium and/or undergo radical dimerization leading to HE-HE (Product C) homodimer (Fig. 8). This homodimer can undergo further oxidation to the HE-E+ heterodimer (Product B) which is subsequently oxidized to form the more stable E+-E+ homodimer (Product A).
Figure 8.
Proposed mechanism of transformation of HE to E+-E+ in the presence of one-electron oxidants.
The structure of E+-E+ homodimer (or diethidium) was determined by NMR analyses. The 1H-NMR spectrum of diethidium (E+-E+) isolated from the reaction between cyt c3+ and HE was obtained in CD3OD (Fig. 4B). The chemical shifts (in ppm) and the coupling constants (in Hz) of the reaction products are shown in Table 1. By comparison of the spectra of E+ with E+-E+ and 2-OH-E+ we can conclude that the last two compounds are lacking the proton H2 indicating the substitution at the carbon atom C2. Moreover, despite the higher molecular weight, as compared to E+, E+-E+ spectrum consists of the peaks of the protons from only one ethidium moiety suggesting the chemical equivalence of the protons form both parts of the dimer. Comparing the 1H-NMR spectrum of E+-E+ and 2-OH-E+ with that of E+ established that the protons of A ring, (a three-spin system consisting of H7, H9 and H10) with its proton H7 strongly shifted upfield by the aromatic ring π-orbital effect of the phenyl group, remain virtually unchanged. However, the B ring protons H1 and H4 present in the E+ spectrum as the doublets, lost their multiplicity in case of both E+-E+ and 2-OH-E+. Moreover, the proton H1 was shifted strongly upfield from 8.66 to 7.21 ppm in the case of 2-OH-E+ due to the presence of the hydroxyl group. All these effects are consistent with a hydroxyl group substitution at position 2. To further confirm that substitution of ethidium occurred at position 2, we performed a detailed NMR analysis including DEPT as well as HMBC and HMQC sequences for E+-E+, E+ and 2-OH-E+ and the results are presented in Supplemental Figures 3S – 5S.
Fluorescence measurements
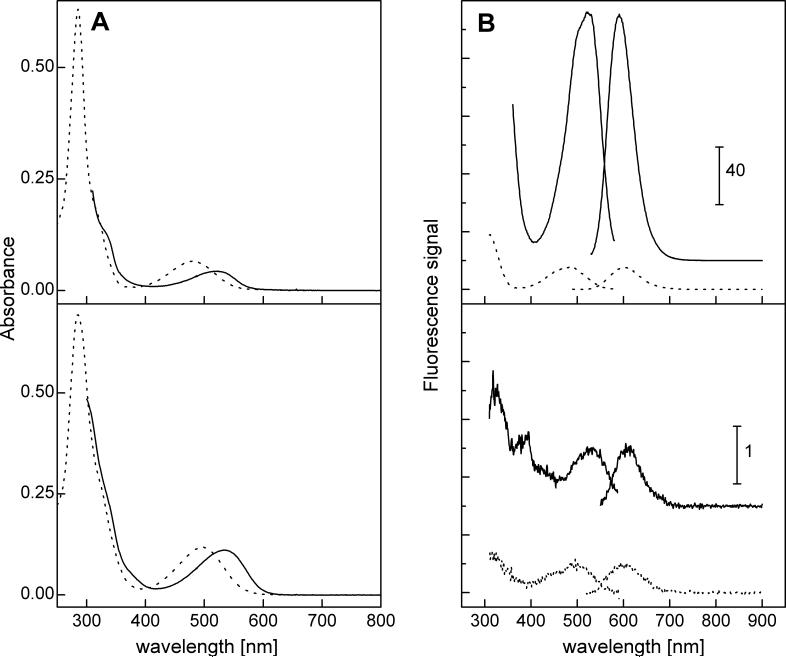
Previously it was suggested that the dimeric product obtained during oxidation of HE and cyt c3+ was fluorescent [8] and that the fluorescence intensity was enhanced by DNA. In contrast, we found that the ethidium dimer (E+-E+) was at least 40-times less fluorescent than that of E+ and that the E+-E+/DNA fluorescence was at least 200-times less than that of the E+/DNA complex (Fig. 9). Based on the present HPLC data, we attribute the increase in fluorescence reported during the HE/cyt c3+ reaction [8] to E+ and not to a dimer formation as previously suggested [8].
Figure 9.
Spectroscopic properties of ethidium (E+) and diethidium (E+-E+). (A) Absorption spectra of E+ (10 μM) (upper panel) and E+-E+ (10 μM) (lower panel) in the absence (dotted line) and presence of 1 mg/ml of DNA (from salmon testes) (solid line) in Tris-EDTA buffer (pH 7.4). (B) Fluorescence excitation (left) and emission (right) spectra of 10 μM of E+ (upper) and 10 μM E+-E+ (lower panel) in the absence (dotted line) and presence of DNA (solid line) in Tris-EDTA buffer (pH 7.4). Note the difference in the relative fluorescence scale between the upper and lower fluorescence spectra. The spectra have been corrected by subtracting the corresponding blank solution containing only the appropriate amount of DMSO.
It is well known that lipophilic cations (E+) are sequestered into mitochondria in a membrane potential dependent manner [21]. As the triphenylphosphonium moiety targets these compounds to mitochondria [22], it is likely that Mito-HE oxidation products should also be able to bind to mitochondria. The fluorescence intensity of Mito-E+, Mito-2-OH-E+, E+ and 2-OH-E+ increased in the presence of mitochondria, suggesting that these compounds are able to bind to mitochondria (not shown). The binding of Mito-E+ and Mito-2-OH-E+ was further confirmed by monitoring the loss of these compounds in solution by HPLC with and without mitochondria (1 mg/ml) and subsequent isolation of these compounds after extraction of the mitochondrial pellet with acetonitrile (not shown).
ROS detection by fluorescence microscopy and flow cytometry
Numerous investigators, including us, have previously used the fluorescence microscopy technique, using the HE probe, to detect intracellular superoxide generation. Except for a few studies [2,5] the formation of the characteristic marker product of superoxide/HE reaction, 2-OH-E+, was not investigated. As compared to 2-hydroxyethidium, ethidium was always detected in much higher amounts in these studies [2,5]. Thus, the “red fluorescence” generated from HE in cells is mostly due to ethidium in nearly all of these studies. Oxidant-induced iron signaling was shown to be responsible for oxidation of dichlorodihydrofluorescein (DCFH) to a green fluorescent dichlorofluorescein (DCF) product [23]. Mitochondrial cyt c release was reported to catalyze the oxidation of DCFH to DCF [19,23]. Recently, HE-derived red fluorescence was used to monitor the iron-dependent intracellular oxidative events in neuronal cells [24]. These examples, together with the present data, clearly indicate that these redox-active probes are highly susceptible to iron or hemeprotein-mediated oxidation, forming both fluorescent and non-fluorescent radical-mediated dimeric products. As demonstrated in this study, the redox chemistry of HE and Mito-HE is similar. Thus, the mitochondria-targeted probe, Mito-HE (or Mito-SOX Red ™) forms 2-OH-Mito-E+ in the presence of superoxide and Mito-E+ and corresponding dimeric products in the presence of iron or cyt c. Previous fluorescence confocal microscopy and flow cytometry results with Mito-SOX and HE should be reexamined in light of the present data. We propose that the HPLC-EC and not fluorescence microscopy or flow cytometry is a viable analytical methodology for detecting superoxide- and cyt c-derived hydroxylation and oxidation products of HE and Mito-HE. The present results suggest that the previous literature data on superoxide detection using fluorescence microscopy and flow cytometry should be reexamined and/or reinterpreted.
Summary
In this study we have shown that superoxide reacts with mitochondria-targeted HE to form a characteristic, hydroxylated fluorescent product similar to that formed from the HE/superoxide reaction. Also, mitochondrial cyt c3+ induces one electron oxidation of HE and mitochondria-targeted HE to form several dimeric products. Isolation, detection, and quantitation of characteristic radical-mediated dimer products of HE and Mito-HE clearly enhance our ability to monitor radical reactions in cells.
Acknowledgments
This work was supported by National Institutes of Health Grants 5P01HL68769-01, 5R01HL067244, and NS39958.
Footnotes
Publisher's Disclaimer: This is a PDF file of an unedited manuscript that has been accepted for publication. As a service to our customers we are providing this early version of the manuscript. The manuscript will undergo copyediting, typesetting, and review of the resulting proof before it is published in its final citable form. Please note that during the production process errors may be discovered which could affect the content, and all legal disclaimers that apply to the journal pertain.
Abbreviations: HE, hydroethidine (5-ethyl-5,6-dihydro-6-phenyl-3,8-diaminophenanthridine); E+, ethidium cation; 2-OH-E+, 2-hydroxyethidium cation; Mito-HE, 5-(triphenylphosphonium)hexyl-5,6-dihydro-6-phenyl-3,8-diaminophenanthridine cation; 2-OH-Mito-E+, 2-hydroxy-5-(triphenylphosphonium)hexyl-6-phenyl-3,8-diaminophenanthridinium dication; Mito-E+, 5-(triphenylphosphonium)hexyl-6-phenyl-3,8-diaminophenanthridinium dication; cyt c3+, ferricytochrome c;
Supplementary Material
References
- 1.Zhao H, Kalivendi S, Zhang H, Joseph J, Nithipatikom K, Vasquez-Vivar J, Kalyanaraman B. Superoxide reacts with hydroethidine but forms a fluorescent product that is distinctly different from ethidium: potential implications in intracellular fluorescence detection of superoxide. Free Radic. Biol. Med. 2003;34:1359–1368. doi: 10.1016/s0891-5849(03)00142-4. [DOI] [PubMed] [Google Scholar]
- 2.Zhao H, Joseph J, Fales HM, Sokoloski EA, Levine RL, Vasquez-Vivar J, Kalyanaraman B. Detection and characterization of the product of hydroethidine and intracellular superoxide by HPLC and limitations of fluorescence. Proc. Natl. Acad. Sci. USA. 2005;102:5727–5732. doi: 10.1073/pnas.0501719102. [DOI] [PMC free article] [PubMed] [Google Scholar]
- 3.Zielonka J, Sarna T, Roberts JE, Wishart JF, Kalyanaraman B. Pulse radiolysis and steady-state analyses of the reaction between hydroethidine and superoxide and other oxidants. Arch. Biochem. Biophys. 2006;456:39–47. doi: 10.1016/j.abb.2006.09.031. [DOI] [PMC free article] [PubMed] [Google Scholar]
- 4.Robinson KM, Janes MS, Pehar M, Monette JS, Ross MF, Hagen TM, Murphy MP, Beckman JS. Selective fluorescent imaging of superoxide in vivo using ethidium-based probes. Proc. Natl. Acad. Sci. USA. 2006;103:15038–15043. doi: 10.1073/pnas.0601945103. [DOI] [PMC free article] [PubMed] [Google Scholar]
- 5.Fink B, Laude K, McCann L, Doughan A, Harrison DG, Dikalov S. Detection of intracellular superoxide formation in endothelial cells and intact tissues using dihydroethidium and an HPLC-based assay. Am. J. Physiol. Cell Physiol. 2004;287:C895–C902. doi: 10.1152/ajpcell.00028.2004. [DOI] [PubMed] [Google Scholar]
- 6.Zielonka J, Vasquez-Vivar J, Kalyanaraman B. The confounding effects of light, sonication, and Mn(III)TBAP on quantitation of superoxide using hydroethidine. Free Radic. Biol. Med. 2006;41:1050–1057. doi: 10.1016/j.freeradbiomed.2006.04.017. [DOI] [PubMed] [Google Scholar]
- 7.Benov L, Sztejnberg L, Fridovich I. Critical evaluation of the use of hydroethidine as a measure of superoxide anion radical. Free Radic. Biol. Med. 1998;25:826–831. doi: 10.1016/s0891-5849(98)00163-4. [DOI] [PubMed] [Google Scholar]
- 8.Papapostolou I, Patsoukis N, Georgiou CD. The fluorescence detection of superoxide radical using hydroethidine could be complicated by the presence of heme proteins. Anal. Biochem. 2004;332:290–298. doi: 10.1016/j.ab.2004.06.022. [DOI] [PubMed] [Google Scholar]
- 9.Mukhopadhyay P, Rajesh M, Yoshihiro K, Hasko G, Pacher P. Simple quantitative detection of mitochondrial superoxide production in live cells. Biochem. Biophys. Res. Commun. 2007;358:203–208. doi: 10.1016/j.bbrc.2007.04.106. [DOI] [PMC free article] [PubMed] [Google Scholar]
- 10.Piacenza L, Irigoin F, Alvarez MN, Peluffo G, Taylor MC, Kelly JM, Wilkinson SR, Radi R. Mitochondrial superoxide radicals mediate programmed cell death in Trypanosoma cruzi: cytoprotective action of mitochondrial iron superoxide dismutase overexpression. Biochem. J. 2007;403:323–34. doi: 10.1042/BJ20061281. [DOI] [PMC free article] [PubMed] [Google Scholar]
- 11.Kulich SM, Horbinski C, Patel M, Chu CT. 6-Hydroxydopamine induces mitochondrial ERK activation. Free Radic. Biol. Med. 2007;43:372–83. doi: 10.1016/j.freeradbiomed.2007.04.028. [DOI] [PMC free article] [PubMed] [Google Scholar]
- 12.Forman HJ, Azzi A. On the virtual existence of superoxide anions in mitochondria: thoughts regarding its role in pathophysiology. FASEB J. 1997;11:374–375. doi: 10.1096/fasebj.11.5.9141504. [DOI] [PubMed] [Google Scholar]
- 13.Gupte SS, Hackenbrock CR. Multidimensional diffusion modes and collision frequencies of cytochrome c with its redox partners. J. Biol. Chem. 1988;263:5241–5247. [PubMed] [Google Scholar]
- 14.Zielonka J, Zhao H, Xu Y, Kalyanaraman B. Mechanistic similarities between oxidation of hydroethidine by Fremy's salt and superoxide: Stopped-flow optical and EPR studies. Free Radic. Biol. Med. 2005;39:853–863. doi: 10.1016/j.freeradbiomed.2005.05.001. [DOI] [PubMed] [Google Scholar]
- 15.Niranjan BG, Avadhani NG. Activation of aflatoxin B1 by a mono-oxygenase system localized in rat liver mitochondria. J. Biol. Chem. 1980;255:6575–6578. [PubMed] [Google Scholar]
- 16.Jacobs EE, Sanadi DR. The reversible removal of cytochrome c from mitochondria. J. Biol. Chem. 1960;235:531–534. [PubMed] [Google Scholar]
- 17.Han D, Antunes F, Daneri F, Cadenas E. Mitochondrial superoxide anion production and release into intermembrane space. Methods Enzymol. 2002;349:271–280. doi: 10.1016/s0076-6879(02)49341-x. [DOI] [PubMed] [Google Scholar]
- 18.Birch-Machin MA, Turnbull DM. Assaying mitochondrial respiratory complex activity in mitochondria isolated from human cells and tissues. Methods Cell. Biol. 2001;65:97–117. doi: 10.1016/s0091-679x(01)65006-4. [DOI] [PubMed] [Google Scholar]
- 19.Lawrence A, Jones CM, Wardman P, Burkitt MJ. Evidence for the role of a peroxidase compound I-type intermediate in the oxidation of glutathione, NADH, ascorbate, and dichlorofluorescin by cytochrome c/H2O2. Implications for oxidative stress during apoptosis. J. Biol. Chem. 2003;278:29410– 29419. doi: 10.1074/jbc.M300054200. [DOI] [PubMed] [Google Scholar]
- 20.Fernandes DC, Wosniak J, Pescatore LA, Bertoline MA, Liberman M, Laurindo FR, Santos CX. Analysis of DHE-derived oxidation products by HPLC in the assessment of superoxide production and NADPH oxidase activity in vascular systems. Am. J. Physiol. Cell. Physiol. 2007;292:C413–22. doi: 10.1152/ajpcell.00188.2006. [DOI] [PubMed] [Google Scholar]
- 21.Budd SL, Castilho RF, Nicholls DG. Mitochondrial membrane potential and hydroethidine-monitored superoxide generation in cultured cerebellar granule cells. FEBS Lett. 1997;415:21–24. doi: 10.1016/s0014-5793(97)01088-0. [DOI] [PubMed] [Google Scholar]
- 22.Murphy MP, Smith RAJ. Targeting antioxidants to mitochondria by conjugation to lipophilic cations. Annu. Rev. Pharmacol. Toxicol. 2007;47:629–656. doi: 10.1146/annurev.pharmtox.47.120505.105110. [DOI] [PubMed] [Google Scholar]
- 23.Tampo Y, Kotamraju S, Chitambar CR, Kalivendi SV, Keszler A, Joseph J, Kalyanaraman B. Oxidative stress-induced iron signaling is responsible for peroxide-dependent oxidation of dichlorodihydrofluorescein in endothelial cells: role of transferrin receptor-dependent iron uptake in apoptosis. Circ. Res. 2003;92:56–63. doi: 10.1161/01.res.0000048195.15637.ac. [DOI] [PubMed] [Google Scholar]
- 24.Firdaus WJJ, Wyttenbach A, Giuliano P, Kretz-Remy C, Currie RW, Arrigo A-P. Huntingtin inclusion bodies are iron-dependent centers of oxidative events. FEBS J. 2006;273:5428–5441. doi: 10.1111/j.1742-4658.2006.05537.x. [DOI] [PubMed] [Google Scholar]
Associated Data
This section collects any data citations, data availability statements, or supplementary materials included in this article.


