Introduction
Real-time cardiac ultrasound (US) allows monitoring the heart motion during intracardiac beating heart procedures. Amongst the congenital heart malformations, secundum-type atrial septal defects (ASD) have been reported to account for up to 15% of cases [1]. ASD represent openings in the septum between the atria, which decrease the efficiency of heart pumping. Although the surgical intervention for ASD closure is well established and has excellent prognosis, it is performed under cardiopulmonary bypass (CPB), which has widely acknowledged harmful effects. Minimally invasive image-guided beating-heart ASD closure will avoid using CPB and improve the patient rehabilitation.
There are two alternatives for minimally invasive ASD closure procedures: one using a catheter-based closure, usually under contrast-enhanced fluoroscopy [11,25]; and another using rigid instruments through the chest wall to place a patch over the ASD, demonstrated in animals [33]. Although clinically available, the catheter-based procedure has major disadvantages: it can be used only on a fraction of ASD [28], it excludes procedures on small children [27], and the delivered X-ray dose is usually high. Animal and pediatric studies showed the feasibility of ASD closures using rigid instruments and highlighted their limitations [9,33]. A major challenge to successful beating-heart surgical interventions remains the reliable visualization of structures within the heart [5,32]. Our application shows the position and morphology of ASD in real-time to support the development of US-guided intracardiac interventions using rigid instruments.
A 3D image of an ASD and its position in the heart is shown in Figure 1. The US probe is placed on the exterior wall of the right atrium. Our application is designed to support computer-based image-assisted interventions for pediatric ASD closures, by providing the accurate position and morphology of ASD in real-time. First, it provides enhanced visual information about the motion and position of ASD to the surgeon to support US-guided intracardiac beating-heart surgery. Second, the method will be embedded in a tissue-instrument tracking system to update a controller for robotics-assisted US-guided interventions.
Figure 1.
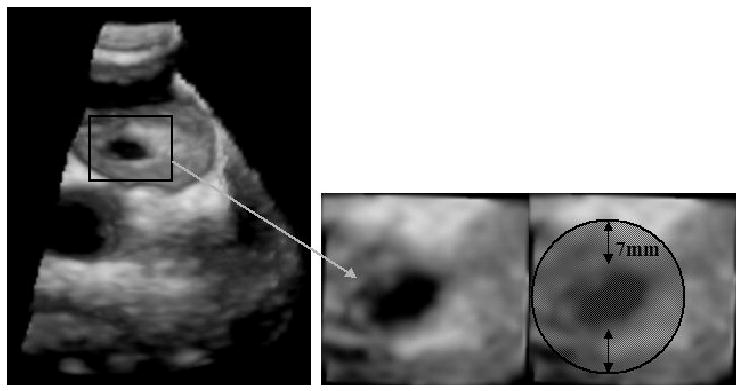
3D US image of an ASD. The US probe is placed on the exterior wall of the right atrium and pointed towards the left atrium. The image on the left shows the entire 3D US volume, while on the right we present a magnified view of the ASD. The round patch must cover the entire ASD surface.
The dynamic nature of ASD is primarily determined by the cardiac cycle and its area can considerably vary (range of change: 17% to 86%) between end-diastole and end-systole [14,18]. The change in size is highly variable and present measurements show subjectivity, as they do not account for the slanted position of ASD in relation to the US probe. There is little to no correlation between the dynamic changes of ASD and its size, heart rate or age of patient. Rigid motion (translation, especially in the vertical direction, or normal to the ASD) is an important component of ASD movement, but the change in shape and size was equally noticed, mainly dilation/contraction. A good knowledge of ASD morphology is essential for the correct design and placement of the ASD patch.
4D ultrasound (US) is simple, cheap and fast, and allows the surgeon to visualize cardiac structures and instruments through the blood pool. US also has some major disadvantages, being extremely noisy with poor shape definition, which makes it confusing and hard to interpret in the operation room. Tracking tissue in 3D US volumes is particularly difficult due to the low spatial resolution caused by interpolation and resampling in image reconstruction [12]. Therefore, the development of tracking methods for volumetric data in 4D applications is necessary to assist clinical procedures. In ASD closure procedures, ASD tracking in US images is desirable to guide either the rigid instruments or the catheter. The motion of the US transducer and the low image quality also contribute to the challenges of ASD tracking.
Processing speed for the robust tracking of cardiac tissues has been addressed in a number of papers. An optical flow approach was proposed in [10] to track endocardiac surfaces. The data points are initialized manually and a finite element surface is fitted to the points. The method extends to 3D the region-based optical flow from [30] using a simple correlation and runs at approximately 2 min/frame after initialization. Boukerroui et al. [4] use a better-adapted similarity measure introduced in [7] to compute region-based optical flow in US image sequences. Their results are faster but 2D. The initialization is not discussed and the authors propose a parameter optimization scheme [10]. A knowledge-based parametric approach using level sets is proposed in [26]. 2D segmentation and tracking are alternated using shape knowledge, visual information and internal smoothness constraints. An interesting 3D cross-correlation-based approach for speckle tracking on simulated data is proposed in [6]. However, 3D speckle tracking poses a series of difficulties, from optimization and computational costs to speckle decorrelation in time and space.
A different class of algorithms is that of sequential segmentation of echocardiographic images. A good example is presented in [19] combining 4D anisotropic filtering and a model-based segmentation using simplex meshes. The 3D volumes are recreated from 2D acquisitions, which gives better in-plane lateral resolution than 3D US, but relies on heavy interpolation between planes. As in the vast majority of cardiac applications, this method segments the left ventricle and creates a model suited for diagnosis but not for surgical interventions. The 3D motion and shape changes of the left ventricle are analyzed in US images with a dense Bayesian motion field [24]. A biomechanical model is used for strain information, but the finite element method (FEM) used to solve the equations makes the process very slow. Finally, the trade-off between accuracy and computational expense is addressed in [20] in a method combining correlation search and feature tracking. The speed is increased, compared to conventional correlation, but the feature detector slows down the algorithm for real-time applications (13.3 min/frame).
In this paper, we present a 3D block flow approach adapted to ASD tracking that estimates velocities for an entire block (a 3D volume centered on the ASD) using the concept of region-based optical flow. The method is fast and avoids the problems of traditional block matching, while exploiting the sensitivity of optical flow. The computation is done volumetrically and the displacement optimizes a similarity measure relative to both the previous and initial frames. The block flow technique is aimed to guide the correct placement of the patch over the ASD surface. We discuss the computational aspects of the presented implementation to optimize processing time and implement them for the real-time use of the application. The full 4D segmentation of ASD is also presented, along with tracking results on 4D clinical cardiac US images. The current streaming speed of commercial US machines is of 25 frames/s. Hence, our real-time US image-guided application should desirably achieve a processing speed of at least 25 Hz.
Method
The purpose of our algorithm is to offer compelling information about the position and shape of ASD to facilitate minimally invasive cardiac surgery. More precisely, we intend to guide the correct placement of the patch over the ASD surface. We approach this challenge in three stages, as described in the following sections: the robust tracking of ASD in 4D space; the optimization of the algorithm for real-time processing; and the 4D shape segmentation of ASD. Since our goal is to guide the correct placement of the patch over the ASD surface, we follow the motion of ASD across a full heart cycle. A distance of approximately 7mm between the ASD margin and the patch edges is usually ensured (Figure 1). At this stage of the algorithm implementation, the initialization of the process is done manually by allowing the user to select a block centered on the ASD in the first frame. This gives a first estimate of the ASD location and a template for the computation of similarity scores, as shown later in the paper.
Block Flow
A common technique used for motion analysis is block matching [23]. It assumes that there is a global intensity relationship between two images. Local translations of image regions are used to compute similarity measures over a search space and estimate a displacement field between the two images. This deformation field is then regularized to determine the spatial transformation. We are simply interested in matching two blocks, instead of two images, which simplifies the rationale of our algorithm. Given a reference block in the previous frame, this block is rotated and translated over a search space in the current frame to find the best fit according to a similarity criterion. An overview of intensity similarity measures can be found in [29]. Minimizing the square error between blocks becomes minimizing the probability distribution function of the additive noise between frames.
More efficiently, region-based optical flow techniques compute motion vectors from spatio-temporal changes in the intensity field of an image [4,30]. Velocity is computed as the physical shift corresponding to the best match between image regions through time, in terms of minimum energy. This energy is typically computed for every voxel in an image or a group of selected voxels (contours or edges). At a second step, the velocities of voxels of the same object are linked by imposing neighborhood constraints. A comparative review of optical flow methods can be found in [1].
Block matching is a fast technique, but it computes a single similarity measure between successive frames and it stores only the best match, ignoring the results in the rest of the search space. Optical flow is more robust, as velocities are computed using similarity measures from the entire search space, but the computational load makes it slow. While the robustness of tracking anatomical structures can be improved by adding movement constraints, smoothing factors and connectivity assumptions, the speed would decrease and become unsuitable for real-time applications.
Our block flow algorithm combines the robustness of velocity computation from optical flow and the speed of block matching, as the motion vector is estimated for an entire block. Moreover, template matching imposes a factor of tracking stability. An absolute reference block absref is defined in the first frame of the 4D US sequence, which contains the ASD. In subsequent frames, the updated reference block from the previous frame is ref and the target block tar. We normalize the voxel values as below, where newref imbeds both a measure of template/golden standard (absref) and updated reference (ref) and μ represents the mean block value.
The velocity or displacement of the block Vb is computed as a probability distribution function R, where n is the number of voxels in the 3D block, τ a normalizing weight, and md the maximum displacement or search space [4,30]. The similarity between frames and between current frame and template is computed from adapted maximum likelihood [4,7]. The energy function E accounts for both the Rayleigh distribution of the noise model and logarithmic compression in US images [34].
Minimizing the energy E is equivalent to minimizing the maximum error in similarity between the target block tar and newref, which embeds information from both ref and absref. E becomes a value of dual match and obstructs velocities u, v and w to grow in the directions of blocks that are not similar to both the previous frame and the absolute reference.
For a careful characterization of tracking accuracy, we defined two error components or measures of confidence: the absolute error abserr and the conservation error conserr. abserr gives the error of resemblance to absref, as a measure of global variance or cumulative deviation from the model, while conserr shows the energy conservation at every frame, a measure of local variance.
Both error measures should vary with the heart motion and the change in shape of ASD. For a correct tracking, the errors would become minimal at the same moment of the heart cycle. The errors are in percentage and normalized between 0 and 100, where an error of 0 corresponds to the perfect match.
Compared to block matching, block flow estimates the velocity of the block from a probability distribution function of energy terms over the search space. Unlike optical flow, block flow reduces the similarity computations from a set of voxels to one block with a unique motion vector. The other major difference between our method and previous approaches is the use of an additional energy term from a reference block, which can be a standard use of a reference for processing repetitive data.
Optimization
Real-time tracking of ASD requires both an optimization of the memory management and an efficient scheme to compute the energy function E. The computation of E is the most time consuming operation in this algorithm, due to both its numerical complexity and the large number of times it is called in the algorithm.
We took advantage of the large flexibility of the C/C++ language to limit memory allocations and benefit from the cache memory speed. Temporary objects have been reused as much as possible and frequent functions, such as the computation of the energy function, directly inlined in the code. Loops have been implemented using pointer arithmetic in order to suppress the cost of the multiplication required for random memory access.
Significant speed improvements have also been obtained by optimizing the computation of the energy function E, which can be rewritten as
with
The repetitive evaluations of the logarithmic and exponential functions represent the most time consuming operations. This process can be accelerated using the following scheme: f is an even function of x and is asymptotically equal to f(x)∼-|x| for large values of |x|; the relative error (f(x)+|x|)/|x| is lower than 1% for |x|>2. Therefore, we pre-computed and stored the values of f for x∈[0;2] and used the asymptotical expression for larger values, which ensures that arbitrarily large values of x would be accurately taken into account.
Segmentation
An additional feature of the algorithm is the 4D segmentation of ASD. An ample overview of segmentation techniques for medical ultrasonic images can be found in [21]. In clinical practice, the ASD is covered with a patch often twice as large in diameter as the ASD. Hence, the robust estimation of ASD position, size and orientation is essential in the guidance of minimally invasive beating-heart ASD closure.
We first use the tracking information to extract at each time from the volume a 3D block surrounding the ASD (Figure 2). The block data is smoothed with a Canny-Deriche filter [8] and thresholded to discriminate between heart tissue and blood. Starting from the estimated location of the ASD center (the center of the tracked block), the volume is sectioned using a set of vertical planes defined by the angle θ between the normal of the plane and an arbitrary horizontal axis, where θ=(0,π). Figure 2.c shows a typical representation of such a plane. For each angle θ, the boundary of ASD is extracted by scanning the block from the center to the left and right edges until tissue is reached. Then the coordinates of the edge voxels are recorded. This defines the contour of ASD as a function of θ using fifty points to sample the curve. To quantitatively measure the area of the ASD, the contour is first fitted with a plane (by minimizing the mean square distance between the trajectory and the plane). We then measure the area enclosed by the projection of the contour along that plane.
Figure 2.

ASD segmentation: (a) a 2D slice of the 3D image in (x,z) coordinates, normal to the ASD; the frame represents the typical block size and location used for the segmentation; (b) the neighborhood of ASD is extracted using the tracking information; a family of vertical slices defined by the angle θ between the normal to the plane and the x axis are used to detect the boundary of the hole; (c) a typical vertical section after thresholding; the red points indicate the computed location of the hole boundary and allow the reconstruction of the ASD shape parameterized by the angle θ.
Results
To test the tracking algorithms, we used a database of three 4D time sequences of clinical infant beating hearts with ASD acquired intra-operationally. The US data were acquired with a Sonos 7500 Live 3D Echo scanner (Philips Medical Systems, Andover, MA, USA). The acquisition frame rate was 25 frames/s, which corresponded to 15 to 17 frames per cardiac cycle. The image size is of 160×144×208 voxels. The size of the septal defects varied between 10×16 and 18×20 mm2.
Tracking
Figure 3 shows the entire 3D US volume with the position of the block marked. We show results at frames 1, 25 and 50. More qualitative tracking results are illustrated in Figure 4, where each block is a 3D entity visualized from the right atrium looking into the left atrium (from above the block) using a 3D renderer and semi-transparency. In this particular view, a well-tracked ASD will appear as a black hole in the middle of the block, where the surrounding tissue is part of the septum. The rows present the absolute reference in frame 1 and subsequent tracking results until the end of the heart cycle.
Figure 3.
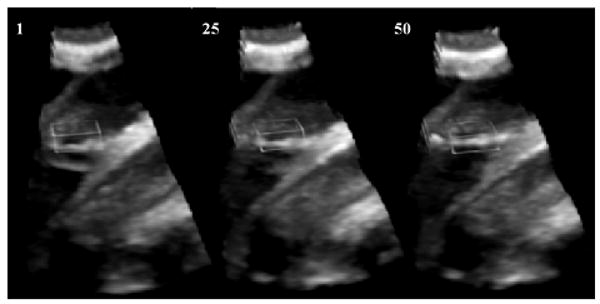
Tracking results in 3D volume. From left to right, the columns show the entire US volume with the 3D block delineated at frames 1, 25 and 50.
Figure 4.
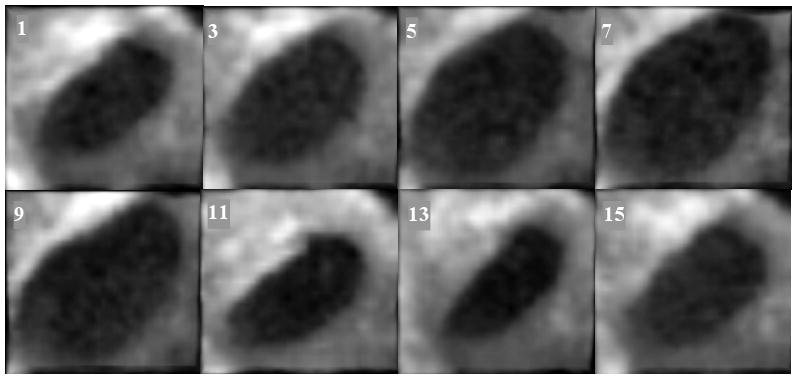
Clinical ASD tracking. From left to right and top to bottom, the columns show 3D blocks visualized from right atrium to left atrium every two frames between frames 1 and 15 (the frame number is marked on the upper left corner).
Since images were acquired intra-operatively, the septum was not orthogonal to the US beam and the ASD appears slanted. This slightly twisted position alters the visual estimation of the size changes of the ASD, as heart contraction and blood pressure modify the opening between atria. The tracking results presented in Figure 4, obtained in a clinical ASD case, clearly show the ASD dilation/contraction. We ensured that the block enfolding the absolute reference in the first frame was large enough to accommodate the change of size of the ASD. The results are robust and the ASD is tracked as a blood whole in the middle of the septal tissue.
Estimating abserr and conserr at every frame in a typical ASD 4D volume, we obtained the results shown in Figure 5. Our data are ungated, but Figure 5 shows a decrease of errors at the end of the heart cycle, when the ASD returns to its initial position. abserr becomes maximal at the time of the greatest change in shape of the ASD. conserr shows peaks at the time of the sudden movements of the heart septum related to the pumping of the heart. The mean errors for the three clinical 4D images associated with the block flow algorithm are 7.09±2.77 for abserr and 4.40±2.14 for conserr. A large part of the error is associated with the change of shape between frames in the clinical ASD. abserr and conserr have synchronized peaks, associated with the heart cycle, as in Figure 5. abserr has maximal value at frame 7, when the ASD is fully dilated (late diastole) and furthest from absref (selected at early diastole). conserr is maximal at frame 10 (systole), when the contraction of left atrium changes fast the shape and size of ASD. The 3D cyclic motion of the block is presented in Figure 6. The maximum displacement appears on the z-axis and is of approximately 10 voxels; it is due to the heart contraction/dilation. The block is found again at the start position at the end of the heart cycle.
Figure 5.
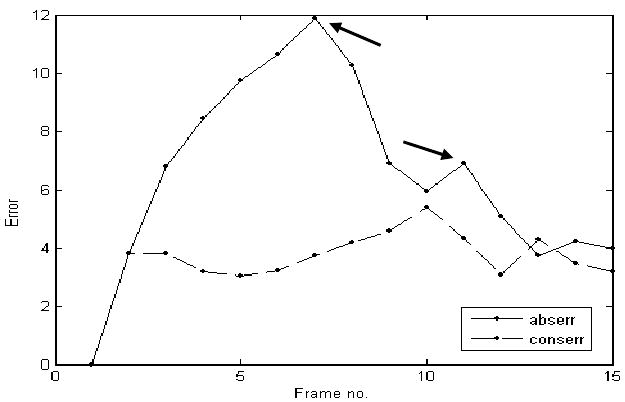
The evolution in time of the absolute and conservation errors in clinical experiments. Although data are ungated, each error measure has two synchronized peaks, which are temporally related to each other, as shown by the two arrows.
Figure 6.
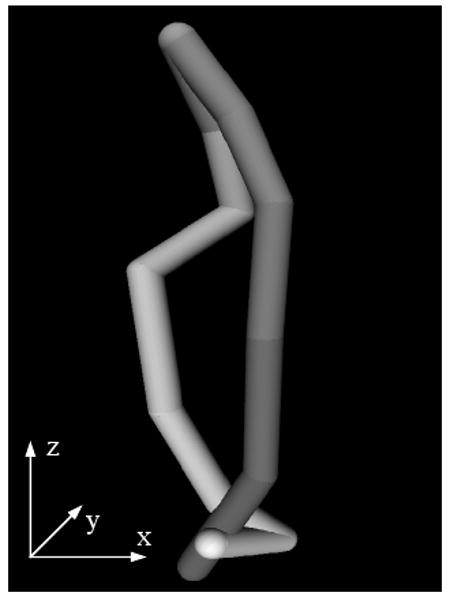
The 3D motion of the block for a typical clinical case for one heart cycle. Temporal frames start at dark shades of grey and end at light grey. At the end of the heart cycle, the block is found at the same position as at the start.
Stability and Efficiency
The algorithm shows excellent stability on periodic evolution of the ASD position. Figure 7 illustrates the z component of the ASD position as a function of the number of cycles, when the record is looped. We used data from one full heart cycled and repeated it 20 times. No drift is observed on the image. The small variations (within 1 voxel) between cycles are caused by the local and global constraints imposed by the energy formulation in block flow, even if the data is identical between cycles. However, the ASD tracking remains stable and position errors do not increase in time.
Figure 7.
Vertical motion of the ASD for different block sizes and different resolutions. Data are obtained over 20 repetitions of a unique full heart cycle in order to test the stability of tracking.
Using the described optimization scheme, the tracking algorithm runs in US real-time. Previously, we reported results before optimization implemented on Matlab 7 (MathWorks, Inc.) on a Pentium IV machine with 1GB RAM and 2.40 GHz processor. We reported a computational speed of 3 s/frame [15]. The results obtained on clinical data with our optimized scheme in C++ achieved 18 Hz (US real-time) on the Pentium IV machine, and 30 Hz on an Intel Core2Duo T7200 processor, 2GHz, 4MB L2 Cache, 667 MHz FSB, 667 MHz DDR2 RAM.
The method has also been tested on a resampled dataset of lower resolution (half of the initial resolution in each direction) with no considerable loss of the trajectory precision, as seen in Figure 7. Using resampled data, the method reaches a processing speed above 60 frames/s. The results are also robust to changes in the size of the tracked block (Figure 7). Both for the change in resolution and variation of block size, the impact on the trajectory of the ASD stays within one voxel size in variation.
ASD Segmentation and Dynamic Morphology
Following the proposed method for segmentation, we extract in each frame the shape of ASD, using fifty points to sample the curve. Figure 8.a shows three typical contours of the ASD, measured respectively at the minimal, intermediate, and maximal size of the hole. In the case we present, the ASD area changes to a factor greater than 3 between end-diastole and end-systole. It equally tilts considerably, with variations in inclinations up to 30 degrees, as seen in Figure 8.b. Figure 8 shows the respective evolutions of the hole size and tilt in a clinical ASD as a function of time for one heart cycle. The similarity between Figure 8.c and Figure 5 confirms our observations on the relation between the cyclic evolution of tracking errors and the heart cycle.
Figure 8.
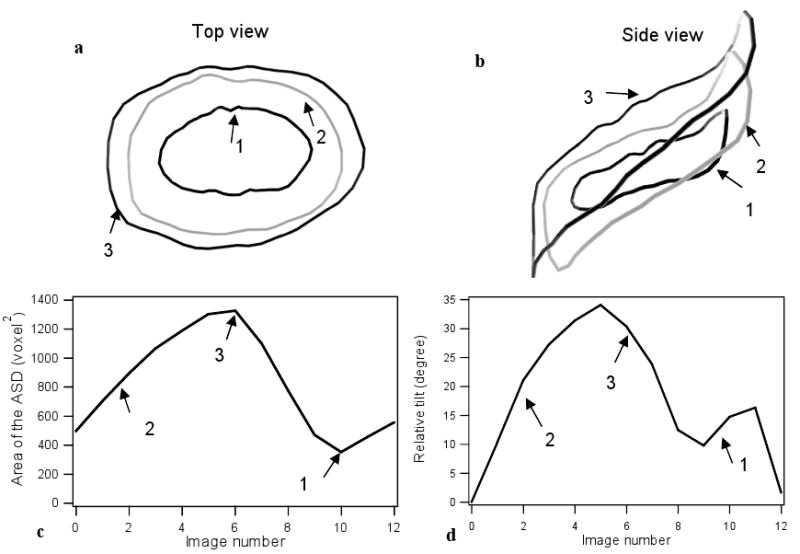
The 4D segmentation of a typical ASD case during one heart cycle: (a) the ASD contour is shown from top view at three different times, corresponding to the smallest, intermediate, and maximal size; (b) the ASD contour is shown from side view at the same times as in (a); (c) the plot of the evolution of the ASD surface area as a function of time during a heart cycle; (d) the plot of the evolution of the ASD tilt angle as a function of time during a heart cycle.
The 4D dynamic morphology of ASD is illustrated in Figure 9. Our preliminary results confirm the literature remarks on the large variability of ASD size during the heart cycle [14,18]. However, through the full 4D segmentation of ASD, our measurements have higher precision and, to our knowledge, they account for the first time for the effect of ASD tilting in relation to the US probe. A thorough study will be performed when a larger clinical database will have become available.
Figure 9.
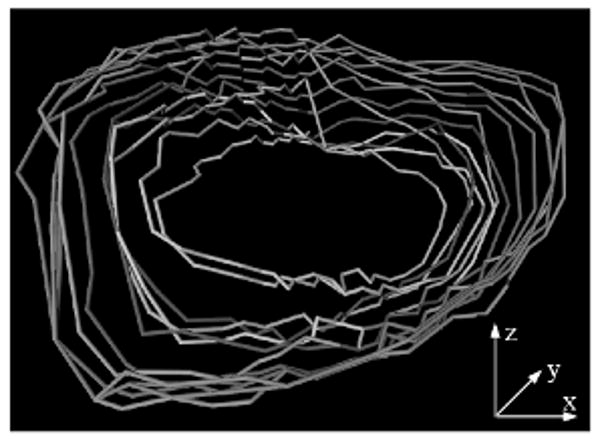
The 4D ASD dynamic morphology during one heart cycle. Temporal frames start at dark shades of grey and end at light grey.
Discussion
We have presented an optimized block flow technique for real-time tracking of ASD to assist in minimally invasive beating heart surgery. The algorithm combines probability-based velocity computation for an entire block with template matching. Enforcing similarity constraints to both the previous and first frames, we ensure robust and unique solutions. As shown in this specific application, our method proposes the standard use of references for processing repetitive data. Results obtained on clinical 4D datasets show that our technique is stable and robust in tracking and segmenting ASD data.
The block flow tracking algorithm finds the 3D velocity of an entire block that enfolds the object of interest. In this application, the object is an ASD with an approximate cylindrical shape. The ASD is segmented from every frame and its complex 3D shape extracted. For an application such as ASD tracking, the block displacement is sufficient and offers a good trade off between processing speed and accuracy.
We first normalize the intensities to reduce the effect of attenuation factors, change of speckle characteristics and angular reflections between frames. We use a Rayleigh noise model in the energy function. Although we do not smooth the data, the pre-processing of the commercial ultrasound machines may alter the noise distribution. Our assumption on noise has led to robust results, but other noise models may be studied.
After visual validation by medical experts, our results appear to have sufficient tracking accuracy to guide the placement of the surgical patch over the ASD in clinical applications. The method proved to be not sensitive to the size of ASD, the change in resolution or the motion of the US probe. An interesting observation was the cyclic evolution of errors in ungated cardiac data. We will investigate the use of the cardiac cycle for predictive estimation to minimize tracking errors.
The ideal speed of tracking should be equal to that of the US frame rate (25 frames/s). Our optimized tracking method achieved the desired speed, reaching up to 60 Hz on a conventional Core2Duo Intel processor. The residual processing time can be used for additional computational and accuracy features, as for visualization and integration with instrument control.
In closing an ASD with a catheter device it is extremely important to measure the size of the ASD to choose the appropriate device. This is usually less important in typical open-heart surgery, but may become essential when closing the ASD on the beating heart when trying to precisely place anchors to close the defect. However, most published papers on the size of ASD used 2D measuring tools, which do not account for the full 3D motion/deformation. Hence, our tracking algorithm, combined with the full 4D segmentation of ASD, can provide valuable information for the full understanding of the dynamic morphology of ASD.
The preliminary results reported in this paper represent, to our knowledge, the first study on the motion and size changes of an ASD that takes into account the angular effect introduced by the slanted position of the intra-atrial communication with respect to the US probe. We have shown in a clinical case that the ASD area could change to a factor greater than 3 during the heart cycle. Moreover, we have illustrated that the tilt of ASD can change up to 30 degrees during the cycle. These changes of orientation with respect to the US probe are possible sources of errors in the estimation of the dynamic size changes of ASD in previous studies.
In the future, other sources of errors, such as free-hand movements will be considered. We will include a larger study on clinical images acquired over more than one heart cycle. For the intricate process of assisting surgical interventions on beating heart, real-time ASD tracking will be combined with real-time instrument tracking. While it is widely acknowledged that the interface between tissue and instruments brings more challenges to image analysis, we propose the use of instrument materials suited for US applications combined with passive markers for the segmentation and tracking of instruments [16, 22]. Both ASD and instrument are expected to preserve their shape characteristics in intra-operative US images (the rigid instrument is above the ASD looking from the US probe) and using cyclic information will correct for the lack of information in the presence of instrument shadowing. While the ASD tracking is performed on CPU, the instrument tracking uses a Graphical Processing Unit (GPU). Hence, the real-time tracking methods for ASD and instruments can be ran on separate computational resources and combined in a complex real-time tracking tool.
Acknowledgments
This work is partly funded by the National Institutes of Health under grant NIH R01 HL073647-01. The authors would like to thank Dr. Ivan Salgo from Philips Medical Systems for assistance with image acquisition and informative discussions.
Footnotes
Publisher's Disclaimer: This is a PDF file of an unedited manuscript that has been accepted for publication. As a service to our customers we are providing this early version of the manuscript. The manuscript will undergo copyediting, typesetting, and review of the resulting proof before it is published in its final citable form. Please note that during the production process errors may be discovered which could affect the content, and all legal disclaimers that apply to the journal pertain.
References
- 1.Barron JL, Fleet DJ, Beauchemin S. Performance of Optical Flow Techniques. International Journal of Computer Vision. 1994;12(1):43–77. [Google Scholar]
- 2.Behar V, Adam D, Lysyansky P, Friedman Z. The Combined Effect of Nonlinear Filtration and Window Size on the Accuracy of Tissue Displacement Estimation using Detected Echo Signals. Ultrasonics. 2004;41(9):743–753. doi: 10.1016/j.ultras.2003.09.003. [DOI] [PubMed] [Google Scholar]
- 3.Benson LN, Freedom RM. Atrial Septal Defect. In: Freedom RM, Benson LN, Smallborn JF, editors. Neonatal Heart Disease. Springer; London: 1992. pp. 633–644. [Google Scholar]
- 4.Boukerroui D, Noble JA, Brady M. Velocity Estimation in Ultrasound Images: a Block Matching Approach. Information Processing in Medical Imaging (IPMI ) 2003:586–598. doi: 10.1007/978-3-540-45087-0_49. [DOI] [PubMed] [Google Scholar]
- 5.Cannon JW, Stoll JA, Salgo IS, Knowles HB, Howe RD, Dupont PE, Marx GR, del Nido PJ. Real Time 3-Dimensional Ultrasound for Guiding Surgical Tasks. Computer Aided Surgery. 2003;8:82–90. doi: 10.3109/10929080309146042. [DOI] [PubMed] [Google Scholar]
- 6.Chen X, Xie H, Erkamp R, Kim K, Jia C, Rubin JM, O'Donnell M. 3-D Correlation-based Speckle Tracking. Ultrasonic Imaging. 2005;27(1):21–36. doi: 10.1177/016173460502700102. [DOI] [PubMed] [Google Scholar]
- 7.Cohen B, Dinstein I. New Maximum Likelihood Motion Estimation Schemes for Noisy Ultrasound Images. Pattern Recognition. 2002;35:455–463. [Google Scholar]
- 8.Deriche R. Using Canny's Criteria to Derive a Recursively Implemented Optimal Edge Detector. International Journal of Computer Vision. 1987;1(2):167–187. [Google Scholar]
- 9.Downing SW, Herzog WR, Jr, McElroy MC, Gilbert TB. Feasibility of Off-pump ASD Closure using Real-time 3-D Echocardiography. Heart Surgery Forum. 2002;5(2):96–99. [PubMed] [Google Scholar]
- 10.Duan Q, Angelini ED, Herz SL, Ingrassia CM, Gerard O, Costa KD, Holmes JW, Laine AF. Evaluation of Optical Flow Algorithms for Tracking Endocardial Surfaces on Three-dimensional Ultrasound Data. SPIE International Symposium, Medical Imaging. 2005;5750 [Google Scholar]
- 11.Faella HJ, Sciegata AM, Alonso JL, Jmelnitsky L. ASD Closure with the Amplatzer Device. Journal of Interventional Cardiology. 2003;16(5):393–397. doi: 10.1046/j.1540-8183.2003.01006.x. [DOI] [PubMed] [Google Scholar]
- 12.Fenster A, Downey DB, Cardinal HN. Three-dimensional Ultrasound Imaging. Physics in Medicine and Biology. 2001;46(5):R67–99. doi: 10.1088/0031-9155/46/5/201. [DOI] [PubMed] [Google Scholar]
- 13.Fleet DJ, Jepson AD. Computation of component image velocity from local phase information. International Journal of Computer Vision. 1990;5(1):77–104. [Google Scholar]
- 14.Handke M, Schäfer D, Müller G, Schöchlin A, Magosaki E, Geibel A. Dynamic Changes of Atrial Septal Defect Area: New Insights by Three-dimensional Volume-rendered Echocardiography with High Temporal Resolution. European Journal of Echocardiography. 2001;2(1):46–51. doi: 10.1053/euje.2000.0064. [DOI] [PubMed] [Google Scholar]
- 15.Linguraru MG, Vasilyev NV, del Nido PJ, Howe RD. Atrial Septal Defect Tracking in 3D Cardiac Ultrasound. In: Larsen R, Nielsen M, Sporring J, editors. Medical Image Computing and Computer-Assisted Intervention – MICCAI 2006, Lecture Notes in Computer Science. Vol. 4190. Springer; New York: 2006. pp. 596–603. [DOI] [PubMed] [Google Scholar]
- 16.Linguraru MG, Howe RD. Texture-based Segmentation of Instruments in 3D Ultrasound. In: Reinhardt JM, Pluim JPW, editors. Proceedings of SPIE Medical Imaging 2006: Image Processing; 2006. pp. 61443J1–9. [Google Scholar]
- 17.Lucas B, Kanade T. An Iterative Image Registration Technique with an Application to Stereo Vision. Proc Image Understanding Workshop; 1981. pp. 121–130. [Google Scholar]
- 18.Maeno YV, Benson LN, McLaughlin PR, Boutin C. Dynamic morphology of the secundum atrial defect evaluated by three dimensional septal transoesophageal echocardiography. Heart. 2000;83:673–677. doi: 10.1136/heart.83.6.673. [DOI] [PMC free article] [PubMed] [Google Scholar]
- 19.Montagnat J, Sermesant M, Delingette H, Malandain G, Ayache N. Anisotropic Filtering for Model-based Segmentation of 4D Cylindrical Echocardiographic Images. Pattern Recognition Letters. 2003;24:815–828. [Google Scholar]
- 20.Morsy AA, von Ramm OT. FLASH Correlation: A New Method for 3-D Ultrasound Tissue Motion Tracking and Blood Velocity Estimation. IEEE Transactions on Ultrasonics, Ferroelectrics, and Frequency Control. 1999;46(3):728–736. doi: 10.1109/58.764859. [DOI] [PubMed] [Google Scholar]
- 21.Noble JA, Boukerroui D. Ultrasound Image Segmentation: A Survey. IEEE Transactions on Medical Imaging. 2006;25(8):987–1010. doi: 10.1109/tmi.2006.877092. [DOI] [PubMed] [Google Scholar]
- 22.Novotny PM, Stoll JA, Vasilyev NV, del Nido PJ, Dupont PE, Howe RD. GPU Based Real-Time Instrument Tracking with Three Dimensional Ultrasound. In: Larsen R, Nielsen M, Sporring J, editors. Medical Image Computing and Computer-Assisted Intervention – MICCAI 2006, Lecture Notes in Computer Science. Vol. 4190. Springer; New York: 2006. pp. 58–65. [DOI] [PubMed] [Google Scholar]
- 23.Ourselin S, Roche A, Prima S, Ayache N. Block Matching: A General Framework to Improve Robustness of Rigid Registration of Medical Images. In: DiGioia AM, Delp S, editors. Medical Image Computing and Computer Assisted Intervention (MICCAI 2000), Lectures Notes in Computer Science. Vol. 1935. Springer; New York: 2000. pp. 557–566. [Google Scholar]
- 24.Papademetris X, Sinusas AJ, Dione DP, Duncan JS. Estimation of 3D Left Ventricular Deformation from Echocardiography. Medical Image Analysis. 2001;5(1):17–28. doi: 10.1016/s1361-8415(00)00022-0. [DOI] [PubMed] [Google Scholar]
- 25.Papadopoulou DI, Yakoumakis EN, Makri TK, Sandilos PH, Thanopoulos BD, Georgiou EK. Assessment of Patient Radiation Roses During Transcatheter Closure of Ventricular and Atrial Septal Defects with Amplatzer Devices. Catheterization and Cardiovascular Interventions. 2005;65(3):434–441. doi: 10.1002/ccd.20353. [DOI] [PubMed] [Google Scholar]
- 26.Paragios N. A Level Set Approach for Shape-driven Segmentation and Tracking of the Left Ventricle. IEEE Trans Med Imaging. 2003;22(6):773–786. doi: 10.1109/TMI.2003.814785. [DOI] [PubMed] [Google Scholar]
- 27.Patel A, Cao QL, Koenig PR, Hijazi ZM. Intracardiac Echocardiography to Guide Closure of Atrial Septal Defects in Children less than 15 Kilograms. Catheterization and Cardiovascular Interventions. 2006;68(2):287–291. doi: 10.1002/ccd.20824. [DOI] [PubMed] [Google Scholar]
- 28.Podnar T, Martanovi P, Gavora P, Masura J. Morphological Variations of Secundum-type Atrial Septal Defects: Feasibility for Percutaneous Closure using Amplatzer Septal Occluders. Catheterization and Cardiovascular Interventions. 2001;53(3):386–391. doi: 10.1002/ccd.1187. [DOI] [PubMed] [Google Scholar]
- 29.Roche A, Malandain G, Ayache N. Unifying Maximum Likelihood Approaches in Medical Image Registration. International Journal of Imaging Systems and Technology: Special issue on 3D imaging. 2000;11:71–80. [Google Scholar]
- 30.Singh A, Allen P. Image-flow Computation: an Estimation-theoretic Framework and a Unified Perspective. CVGIP: Image Understanding. 1992;65(2):152–177. [Google Scholar]
- 31.Stoll JA, Novotny PM, Howe RD, Dupont PE. Real-time 3D Ultrasound-based Servoing of a Surgical Instrument. Proceeding of IEEE International Conference on Robotics and Automation; 2006. pp. 613–618. [Google Scholar]
- 32.Suematsu Y, Marx GR, Stoll JA, DuPont PE, Cleveland RO, Howe RD, Triedman JK, Mihaljevic T, Mora BN, Savord BJ, Salgo IS, del Nido PJ. Three-Dimensional Echocardiography-guided Beating-heart Surgery without Cardiopulmonary Bypass: a Feasibility Study. Journal of Thoracic and Cardiovascular Surgery. 2004;128(4):579–587. doi: 10.1016/j.jtcvs.2004.06.011. [DOI] [PubMed] [Google Scholar]
- 33.Suematsu Y, Martinez JF, Wolf BK, Marx GR, Stoll JA, DuPont PE, Howe RD, Triedman JK, del Nido PJ. Three-dimensional Echo-guided Beating Heart Surgery without Cardiopulmonary Bypass: Atrial Septal Defect Closure in a Swine Model. Journal Thoracic Cardiovascular Surgery. 2005;130(5):1348–1357. doi: 10.1016/j.jtcvs.2005.06.043. [DOI] [PubMed] [Google Scholar]
- 34.Thijssen JM. Ultrasonic Speckle Formation, Analysis and Processing Applied to Tissue Characterization. Pattern Recognition Letters. 2003;24:659–675. [Google Scholar]


