Abstract
We are presenting a program for interactive segmentation of tomographic maps, based on objective criteria so as to yield reproducible results. The strategy starts with the automatic segmentation of the entire volume with the watershed algorithm in 3D. The watershed regions are clustered successively by supervised classification, allowing the segmentation of known organelles, such as membranes, vesicles and microtubules. These organelles are processed with topological models and input parameters manually derived from the tomograms. After known organelles are extracted from the volume, all other watershed regions can be organized into homogeneous assemblies on the basis of their densities. To complete the process, all voxels in the volume are assigned either to the background or individual structures, which can then be extracted for visualization with any rendering technique.
The user interface of the program is written in Java, and computational routines are written in C. For some operations, involving the visualization of the tomogram, we refer to existing software, either open or commercial. While the program runs, a history file is created, that allows all parameters and other data to be saved for the purposes of comparison or exchange. Initially, the program was developed for the segmentation of synapses, and organelles belonging to these structures have thus far been the principal targets modeled with JUST. Since each organelle is clustered independently from the rest of the volume, however, the program can accommodate new models of different organelles as well as tomograms of other types of preparations of tissue, such as citoskeletal components in vitreous ice.
Keywords: Electron tomography, Volume segmentation, Image processing, Feature extraction, Synapsis
Introduction
Electron Tomography (McEwen and Marko, 2001; Baumeister, 2005) has benefited from technological and computational improvements, so that the production of three-dimensional maps of biological tissues is becoming routine in many laboratories. Typical dimensions of the maps are 1024×1024×128 voxels or larger and the resolutions vary from 3 nm to 8 nm. The maps may portray tissue sections (He et al., 2003), organelles such as axonemes and flagella (Nicastro et al., 2005; 2006), nuclear pore complexes (Beck et al., 2004), synapses (Harlow et al., 2001; Zampighi et al., 2006) and viruses (Grunewald et al., 2003). Their analysis, however, is often hampered by their low signal to noise ratio as well as by incomplete sampling of the Fourier space, limiting our understanding of the distribution and structure of organelles and macromolecules in their cellular environments.
The analysis of the maps is performed both by looking at plane sections as well as rendered volumes and, with increasing frequency, by tracing the contours of organelles and macromolecules throughout the volume and thereby extracting their densities. This process, called “segmentation”, reconstructs the 3D shape of cytoplasmic organelles based on density thresholds and/or topological considerations. The segmentation is often performed manually in an effort to adjust to the alteration of shape resulting from the anisotropy of the resolution. Many tools are available to help manual segmentation, implemented in software packages like Amira (Amira, 2001), Chimera (Petterson et al., 2004; see also Goddard et al., 2007), Imod (Kremer et al., 1996) and Bsoft (Heymann, 2001; Heymann and Belnap, 2007). Manual segmentation, though potentially precise, is user-dependent, and thus not objective in tracing the fine contours of structures. Moreover, for unknown macromolecular assemblies, manual segmentation is rarely tenable.
Recently, a number of automatic segmentation tools have been proposed and successfully applied to various types of samples. Due to the variety of tissue sections and biological preparations studied with electron tomography, no single method suffices. The surface minimal energy based method (Bartesaghi et al., 2005) appears highly efficient in detecting thin geodesic surfaces encapsulating membranous entities. Eigenvector analysis (Franghakis and Hegerl, 2002) partitions the tomograms on the basis of their intrinsic properties, using density information, rather than topology, and has been successful with unstained samples embedded in ice. Volumetric feature extraction by gradient vector diffusion (Bajaj et al., 2003) is used to skeletonize regions of the sample and to create isosurface contours. Seeds expansion (Baker et al. 2006) addresses the segmentation of molecular subunits and is applied to high-resolution maps. The strategy by Ress et al. (2004) involves the use of manually collected markers and parametric curves to model membranes. The watershed algorithm (Volkmann, 2002) segments the entire tomogram and does not simply extract features. Though this technique is of a more general nature, it does not however, produce immediately accessible results especially in the case of information-rich tomograms. Since our interests tend toward tomograms containing a variety of different structures, it is important to preserve the resolution of the maps without substituting volumetric data with isocontours; we needed a new method capable of modeling the entire 3D volume. Combining the versatility of manual segmentation with the objectivity of computer-driven methods, we thus developed a semiautomatic strategy based on the automatic segmentation of the complete volume with the 3D watershed algorithm (Vincent and Soille, 1991) coupled with the supervised classification of biological structures. In this strategy, the operator only needs to identify the position and topology of the structure, whereby its contours are automatically extracted from the watershed map. Regions not assigned to any “known” organelle but which fall within a certain density range, are segmented as “unknowns”. This program, called JUST (Java User Segmentation Tool), was first used for segmenting chemical synapses of rat sensory cortex, reconstructed by conical electron tomography (Zampighi et al., 2005; 2006). A typical map is represented in Figure 1. The sections contain a portion of the active zone of the synapse, with plasma membranes and membrane vesicles, as well as other regions with high or low densities.
Figure 1.
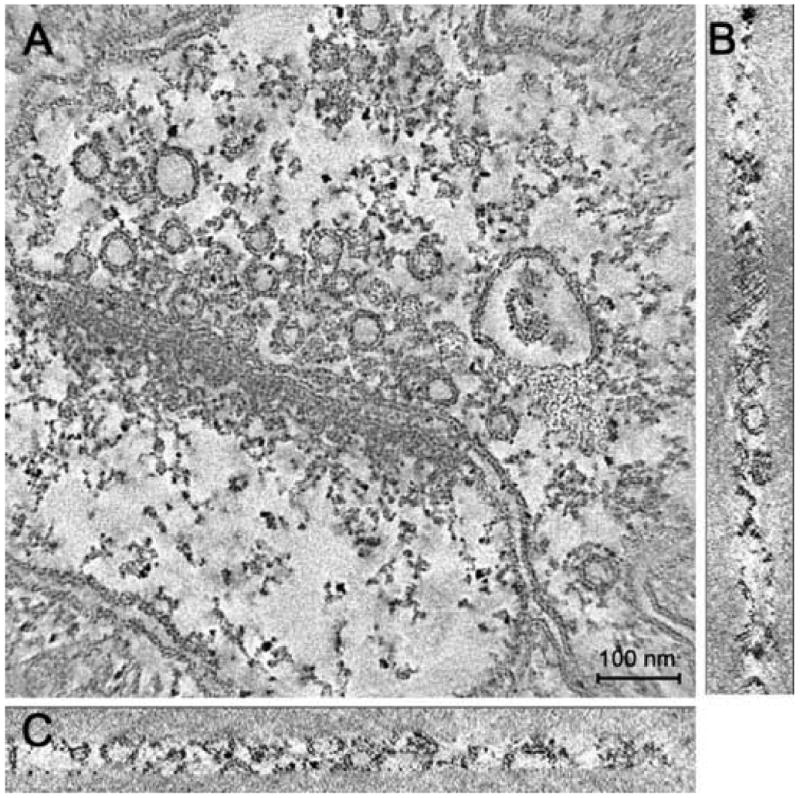
Tomographic reconstruction of rat somato-sensory cortex. Cross sections are oriented as XY (a), YZ (b) and XZ (c) planes. The map contains membranes as well as a few types of intercellular organelles, such as vesicles and dense bodies. Many filaments of medium density are visible in pre-synaptic regions; other filaments connect vesicles belonging to the post-synaptic region.
The algorithm
JUST consists of the following five steps: 1) the creation of a 3D watershed map of the volume. 2) The extraction of the background that is the set of all featureless regions in the map. 3) The interactive segmentation of known structures, such as vesicles, membranes, gold particles, and tubules according to theoretical models. 4) The extraction of regions with high, medium and low densities. 5) The composition of the final segmentation map, in which all segmented structures are analyzed and conflicting assignments are resolved.
3D watershed
The watershed algorithm (Vincent and Soille, 1991) is applied in 3D to create an additional map with the same metric and size of the reconstructed volume. In the new map, the value of each voxel is an integer, corresponding to the region of the original voxel. The algorithm is applied as proposed by Volkman (2002), by first dividing the dynamic range of the entire map into evenly spaced intervals, and then running through a number of cycles equal to the number of intervals. This number is a crucial parameter, responsible for over- or under-segmentation if not chosen correctly. The optimum number of density intervals depends on the type of reconstruction and the noise level. For this reason the value is normally chosen by the operator.
In the first cycle, all voxels with density values in the first interval are analyzed and grouped into a set of connected regions, marked with a progressive number corresponding to the region. In subsequent cycles, all voxels from the same interval are considered and processed according to three criteria: 1) When contiguous with a single existing region, the region is enlarged. 2) If contiguous with two or more regions, they are assigned to the watershed line, which represents the frontier between the regions. 3) If they are not contiguous with any region detected in the previous step, they are grouped into a region with a new label. In the new map, the voxels are numbered with either the label of a region or the label of the watershed. The labels of the regions are integer numbers assigned progressively, while the watershed label is conventionally set to zero.
Extraction of the background
The background is defined on the basis of density thresholds. Since the watershed map does not contain information about absolute density values, it is necessary to calculate a third map. This new map has the same size of the original and of the watershed map. The value of each voxel in the new map corresponds to the mean value of all voxels belonging to the region assigned in the watershed map. This mean value, calculated from the original map—not that of the watershed which determines the regions—is generally a floating-point number. The background is defined on the basis of two thresholds selected by the user. The first threshold is applied to the original volume and used to exclude the voxels of lowest density from the computation of the mean value of each region. The second threshold is applied to these mean values to exclude all the regions of the lowest density. The double threshold is used to correct for high-density spots that are contained within a smooth volume.
After accounting for the background, the operator can select the size of the smallest volume to be included in the watershed map. Everything smaller is merged with the neighboring regions of similar mean density values. In cases where the mean density values of these regions differ significantly from those of their neighbors, they remain irrespective of their size. This merging operation reduces significantly the number of regions of the original watershed map.
Interactive segmentation
This step deals with the processing of organelles, the shapes of which can be approximated with geometric models (i.e., spheres, cylinders, polyhedra). To perform this operation, the program uses input files that define the independent parameters of the model for each organelle. To derive these parameters, the user must select coordinates from the original volume which define its rough position. The algorithm analyzes each type of organelle independently. For each case, the algorithm creates a new volume by copying the watershed map, setting all voxels associated with the organelles to the proper labels and zeroing all the others. We call these volumes “inter-medium segmentation maps” (ISM). In each ISM, the same label is applied to all regions belonging to the given structure and is continually recalculated as a progressive integer number. If more than one of the same type of organelle are present (i.e., a group of synaptic vesicles), the label for each individual organelle is kept separate, so that they may be viewed individually. So far, the organelles able to be processed in this step include membrane vesicles, plasma membranes, pre-synaptic “dense” particles, called here syndesomes, and microtubules.
Synaptic vesicles are modeled as empty spheres, using the vesicle's center, the thickness of the “crown” (T) and the density range of the matter (minimum and maximum value) as the defining parameters. The number of voxels (N) falling within the watershed regions of the appropriate density range is tabulated, starting at the center selected by the operator and expanding outward in a sphere of radius R. The expansion stops when the condition N=4πR2*T is met. All vesicles are segmented simultaneously, but each vesicle receives a separate label. Another label is used for regions where two or more vesicles are in contact.
Plasma membranes are modeled as thick surfaces. The parameters needed for the segmentation are a series of points contained on the membrane in two or more planes of the map (Fig 2a). For each plane, a curved line is drawn which fits the coordinates of the points by cubic spline interpolation (Hou and Andrews, 1978). In the space between the marked planes, other splines are traced conjoining the two curves and reproducing the layout of the membrane (Fig 2b). The user chooses the number of points for each plane as well as the number of planes in which the points are recorded, values which are both based on the amount of variation in the membrane within the sample. Once the layout is created, regions are assigned to the membrane on the basis of their density and of their proximity to the splines (Fig 2c). As in the segmentation of vesicles, the operator defines the thickness and density range. Note that the segmented volume is generated as a set of regions from the watershed map, not as a continuous surface.
Figure 2.
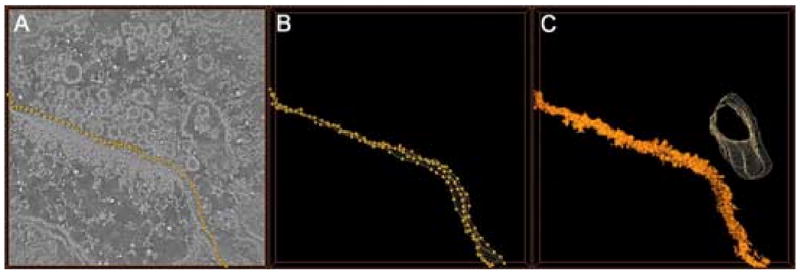
Segmentation of a membrane. a) A few dots are manually marked on the membrane in an XY section of the tomogram (the contrast is reversed with respect to figure 1). b) The same procedure is repeated on two other planes, and a surface passing through all the markers is computed. The points constituting the surface are evaluated by cubic spline interpolation. c) The watershed 3D map is analyzed to find all regions close to the surface with the appropriate density. Those regions are selected and associated to the membrane. In (c) a second surface is also represented, encompassing a second membrane.
The polyhedron was used to model syndesomes, or “dense” particles (Gray 1963) bounded by synaptic vesicles at the active zone. Like in the segmentation of membranes, curves, either convex or concave, are drawn to create an enclosed volume. The segmented polygons are comprised of those regions that fit within this volume and are within the given range.
Cylinders have been used to model microtubules contained in the flagellar axoneme or filamentous structures, protruding from bacteria. The microtubule model is a curved, empty cylinder, of thickness T. The axis of the cylinder is constructed by fitting a spline curve to a select number of points recorded by the user. Additional parameters provided by the user include the internal and external radii as well as the density range. The segmented tubule is then obtained by selecting the regions, fitting both the geometric and density constraints.
Density segmentation
This step deals with the remaining regions in the watershed map, after the “known” organelles have been segmented in the interactive segmentation step. These “unknown” regions are segmented solely on the basis of density, with three possible ranges for low, medium or high-density values. For each material the user selects a density range, which defines the regions that will constitute that density. Also in this step, a new volume is created where the voxels of the regions of interest are marked with a new label that is created as a progressive integer. As a side note, gold particles are segmented in a different step, as spheres with the highest density values.
Composition
This step deals with the creation of the final segmentation map. Segmentation into ISMs allows the possibility that the same voxel can be assigned to multiple structures. In this step, these potential conflicts can be resolved, producing the final segmentation map.
In order to achieve this final map, the user specifies the priority of the various ISMs hitherto segmented. The labels of each ISM are then copied into the final map based on these priorities. Once a voxel has been copied into the final map, it cannot be copied again, so that in the final map single voxels can no longer constitute multiple structures. To eliminate the watershed line, the regions are enlarged while being copied.
The final composition map contains all the objects of the watershed map as well as the background, each with its own label. Additionally, a file list is generated linking the labels to their corresponding objects. It is also possible to label the remaining voxels that were not assigned to any of the objects of the final composition map.
Visualization
The segmentation map is a volume with the same size and topology of the original map, where each voxel is an integer number corresponding to the label associated to an object. At this point, the map no longer contains information about density variation. Recovering this information can be achieved by combining the segmentation map (S) with the original volume (V). For each voxel v∈V, the corresponding value s∈S is tested for a specific label s′ (s==s′). A simple operation of logical AND between V and the tested version of S produces a new volume V′ = V AND (S== s′). In V′ all voxels are zeroed apart from those belonging to the object associated to the label s′, which retains their original density values. (Instead of a single label s′, an interval [s′, s″] can also be used). Finally, the volume V′ is visualized by rendering techniques.
Implementation
The algorithm was implemented in a program running under the Linux operating system. The graphic user interface was written in Java, while all intensive computational routines were written in ‘C’. The display of images and volumes used ImageJ (Abramoff et al., 2004), Bsoft (Heymann, 2001), Amira (Amira, 2001) or Chimera (Petterson et al., 2004).
Figure 3 shows the graphic interface designed for controlling the input/output of data, text files, and a few other parameters. The window is comprised of a menu bar for the principal input/output as well as for setting preferences (upper line), and a status bar for information about the volume data created (bottom). The central region has a list of buttons, corresponding to the steps of the segmentation process (left column). The color on the button changes according to processing: red means not activated yet, blue active and green done. Two additional areas for input/output are also located in this region.
Figure 3.
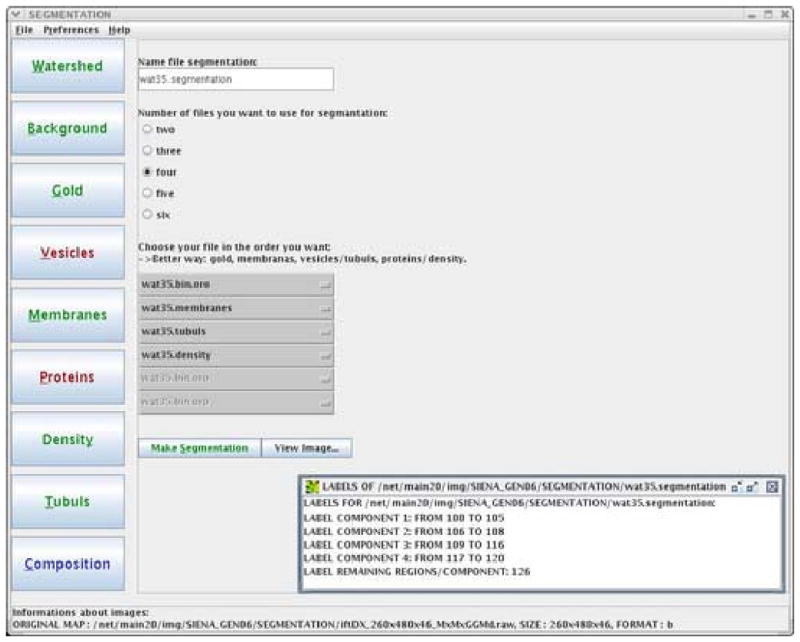
The graphical interface of JUST. The left column shows all buttons available for the various steps of the segmentation process. The color on the button changes according to processing: red means not activated yet, blue active and green done. The central part of the window displays data and parameters involving the current state of the analysis. The figure shows the final step: “composition” (see the blue color of the related button). In this step, gold particles, membranes, tubules and densities, which have been segmented independently, are combined to merge the data in a unique segmentation map. The box in bottom right corner displays the labels which are associated to the four materials in this final map.
When segmenting, a history file is created, recording the name, type of data, the directory where the data are stored, the name of the files, the steps performed and the parameters used. Furthermore, the history file also records temporary files that can be deleted at the end of the processing. In this manner, the analysis can be stopped, saved and restarted to finish or modify analysis from a previous segmentation.
The volume data are read and written in EM3D format (Hegerl, 1996) though almost any format can be imported as raw data by skipping a header of known length. Temporary files, such as watershed map or individual structures, are saved as raw data and may be visualized with ImageJ, Amira or Bshow. A Bshow window is automatically opened after each step of the segmentation to facilitate the analysis of the results and the choice of parameters.
The coordinates of the centres of vesicles and the layout of membranes and tubules are recorded with either Amira or ImageJ and saved as text files. A single file is enough for the coordinates of the vesicle's centers. In contrast, the coordinates of membranes require an individual file for each plane. The number of planes for each membrane is arbitrary, since it depends on the user. However, selecting a common radix retrieves the multiple files representing each membrane automatically.
Visualization of the segmented volume is done with the Amira or Chimera packages. JUST may produce different outputs according to the preferred displaying program. For instance, Chimera needs a separate file for each material in order to represent each organelle in a different color. Therefore, JUST produces several outputs with a few logical AND operations between the original volume and the segmented map. For each object selected by the user, the relative labels are retrieved and the corresponding regions extracted from the original volume and copied to a new map, which is saved in EM3D format. A typical result of this procedure is presented in Fig 4ab. With Amira, on the other hand, a single output consisting of the final segmentation map is often sufficient for visualization. Amira manages “arithmetic” operation between maps including a logical AND. Therefore, the segmentation map can be viewed either directly or in conjunction with the original volume (see Fig. 4c).
Figure 4.
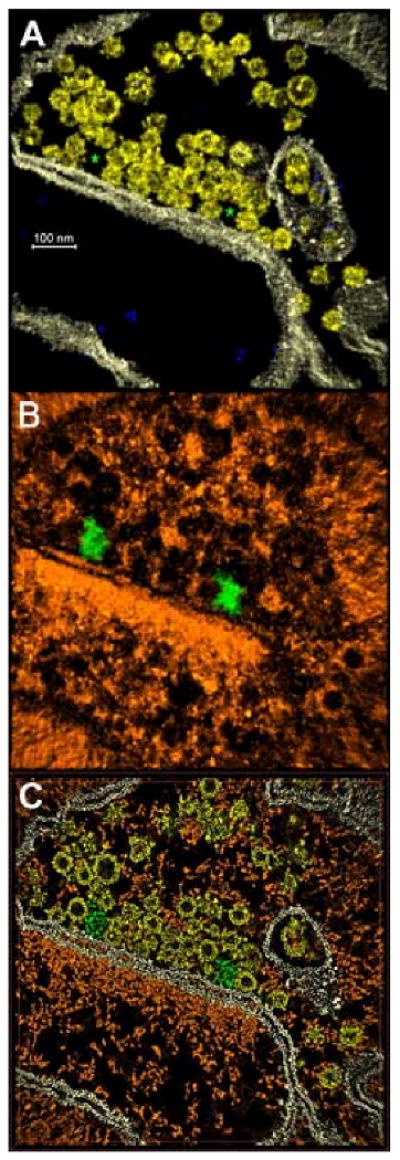
Results of the segmentation process applied to the map of figure 1. (a) Volume rendering visualized with Chimera, showing only membranes (white), vesicles (yellow) and gold particles (blue). Two stars are placed where holes appear between groups of vesicles and the membrane. (b) Volume rendering of the rest of tomograms, i.e., the cytomatrix (orange). The green organelles lie in the holes marked with stars in panel A, and correspond to dense-bodies. Using Amira, the results of the segmentation can also be observed in plane sections (c) using the same colors as in 4a and 4b.
Processing Time
The computation of the watershed map is the most time-consuming step of the segmentation process. Computation time depends non-linearly upon the volume of the 3D map, and also upon the number of steps in which the dynamic range of the map is divided. On a 3 GHz Xeon processor a watershed map measuring 1024×1024×64 voxels and with a large number of steps (say 50) can take up to 30 hours. For this reason, we often cut the map in advance, to exclude featureless regions. After this initial procedure, which is fully automatic and can run as a batch script, the computation time then depends upon the number of structures present in the volume. Here, all computational routines are fast, and the amount of time taken by this step is determined by the manual selection of the reference points marked on the tomogram and by the visual check of the result. The signal to noise ratio and the resolution of the volume as well as the skill and the confidence of the operator directly impact how long this step takes. Usually, every time a new type of sample is analyzed, a few trials are needed to optimize the parameters and fix a strategy for the composition step. After this first run, other maps are processed much faster. A large synaptic map normally is processed in 4-5 hours after the computation of the watershed while a small map can usually be finished in an hour.
Results
JUST was developed for the study of chemical synapses from rat sensory neocortex reconstructed by conical electron tomography (Zampighi et al., 2005; 2006). The 3D maps, approximately one fifth to one eighth of the synapse, contained membranous organelles (vesicles and plasma membranes) intermingled with elements of the cytoskeleton forming the cytomatrix (Hirokawa et al., 1989). Since the tissues were fixed and stained with solutions of heavy metal atoms, the signal-to-noise ratio of the maps was high. The resolution of the maps, estimated from the “unit membrane” pattern (Zampighi et al., 2005; 2006), was ∼3 nm along the X-Y, X-Z and Y-Z planes (Fig. 1 A-C). About 20 tomograms of synapses have been reconstructed and segmented. For segmentation purposes, the volumes were saved in negative contrast (protein and stain were white) and in byte format (dynamic range [0,255]).
Gold particles, deposited on the surface of the thin sections, were used for the alignment. They were characterized by their size (∼10 nm), their spherical shape and by the fact that they exhibited the highest density values of the reconstructed volume [150, 255]. Small particles evenly spread throughout the reconstructed volume exhibited the next highest value of density [130, 220]. Since the range of densities was close to that of gold particles, we interpreted these smaller particles as accumulations of heavy metals that occurred either during the preparation of the specimens or during irradiation that took place during the collection of the conical series. They received no further analysis.
Membranes and the cytomatrix of the pre- and post-synaptic neurons exhibited density values of approximately one half those of gold particles [80, 120]. Membranes exhibited a trilayer pattern (Fig. 1 A-C), comprised of two dense layers flanking a central unstained layer, measuring ∼4 nm in overall thickness. Filaments comprised the cytoplasm of both neurons. In the pre-synaptic neuron, large particles of ∼60 nm in diameter associated both to the active zone and to coronas of vesicles were visible, forming two-dimensional arrays, called the “pre-synaptic grid” (Gray, 1963; Bloom and Aghajanian, 1966).
The map of figure 1, measuring 1024×1024×64 voxels, was obtained by conical tomography (Lanzavecchia et al., 2005) and segmented extensively using JUST. The watershed algorithm was applied using 18 steps and obtaining 90066 regions, which were subsequently reduced to 81102 after discarding the background and the smallest regions. Vesicles and membranes were then segmented interactively. The cytoplasm of the pre-synaptic neuron contained 75 vesicles and 14 membranes (or membrane fragments). A file was created containing the approximate centers of the vesicles, and processed by JUST for their segmentation. The segmentation of the membranes used, on average, 4 planes each comprised of 25 points, stored in disparate files. 4 nm was used as the thickness for both vesicles and membranes.
Once segmented, vesicles and membranes can be studied either in isolation or as a group (Fig. 4a). Analysis of their layout in the absence of the cytomatrix allowed the identification of large empty spaces in the active zone of the pre-synaptic neuron (Fig. 4a) surrounded by a crown of synaptic vesicles. The dense particles of the cytomatrix occupying these spaces were segmented by marking points at their boundaries and segmenting them using the polyhedron button. In this way, their distinct form as well as the docking sites for the vesicles that bind to them could be visualized (Fig 4b). A 2D slice of the segmented map showing both membranes and cytomatrix is presented in figure 4c.
Additionally, segmentation using JUST allowed us to examine the small regions of contact that the membranes establish with each other, such as the points of contact between vesicles and the membrane of the active zone (Fig. 5). This region warranted special attention since it is here that vesicles fuse and release their neurotransmitters upon electrical stimulation. Though difficulties in the assignment of watershed regions using JUST can arise in the composition step, (see methods) the structure of the membranes as trilayers comprised of cytoplasmic and external leaflets flanking a central band remained intact (Fig. 5). At the region of contact, the membranes of the vesicle and the plasma membrane merged their cytoplasmic leaflets and appeared as a single membrane (hemi-fusion, Zampighi et al., 2006). The regions of contact were small (∼20 nm) and the areas where the membranes hemi-fused even smaller (∼8 nm), though still well within the resolution of the map (∼3 nm). The observation of hemi-fusion at the region of contact provides strong evidence that the formation of lipid intermediaries precedes synaptic vesicle fusion in chemical synapses (Zampighi et al., 2006).
Figure 5.
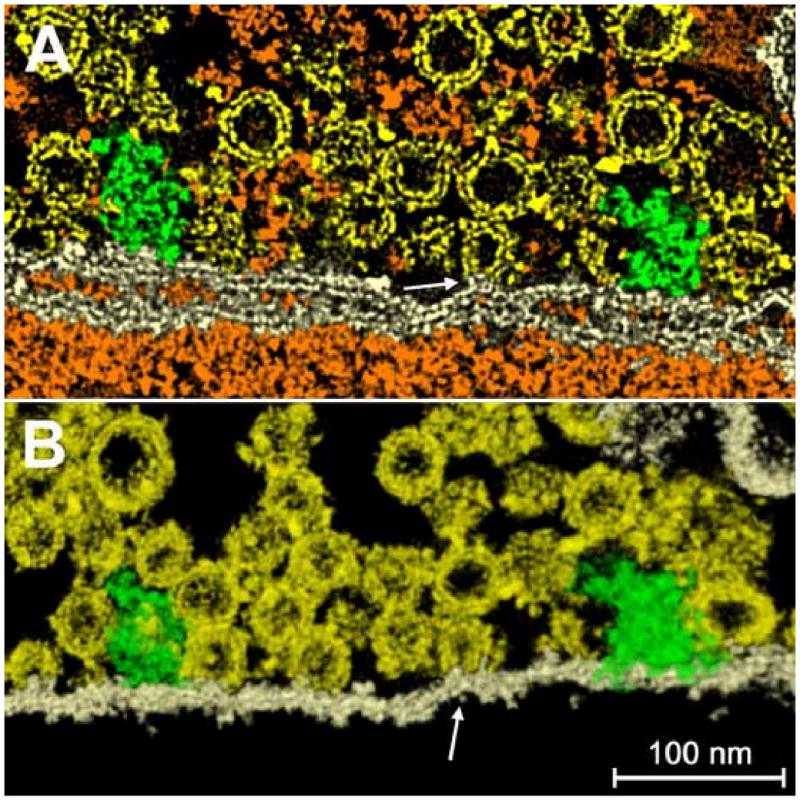
A hemi-fused vesicle. The accuracy of the segmentation can be appreciated in the regions where vesicles are in contact with the plasma membrane or hemi-fused to it. (a) A plane section within the tomogram, where the structure of the bilayer and of the membranes and vesicles is well-defined. One vesicle (arrow) is hemi-fused with the membrane, the two constituent bilayers becoming a single structure. Since they're merged, the assignment of the common regions to one material over another becomes meaningless, but is retained for the purposes of viewing. In (b) the same region is shown with a volume rendering technique.
Studying other tomograms, regions of close apposition between neighboring vesicles in the cytoplasm of the pre-synaptic terminal (yellow and red vesicles in Fig. 6) could also be examined using JUST. By segmented the regions where neighboring vesicles contacted each other into separate materials, these areas could be investigated individually without the need to visualize the surrounding structures (vesicles, cytomatrix). Investigation of these regions indicated that the cytoplasmic leaflets of the membranes were in close apposition but were not hemi-fused. In addition to volume rendering, analysis also involved an examination of the planes cut both parallel to the XY direction and obliquely (Fig. 6b). Moreover, analysis of the medium density components of this region, corresponding to the elements of the cytomatrix, revealed short filamentous and particulate structures connecting the vesicles to each other or to the plasma membrane of the active zone (Fig. 6, orange).
Figure 6.
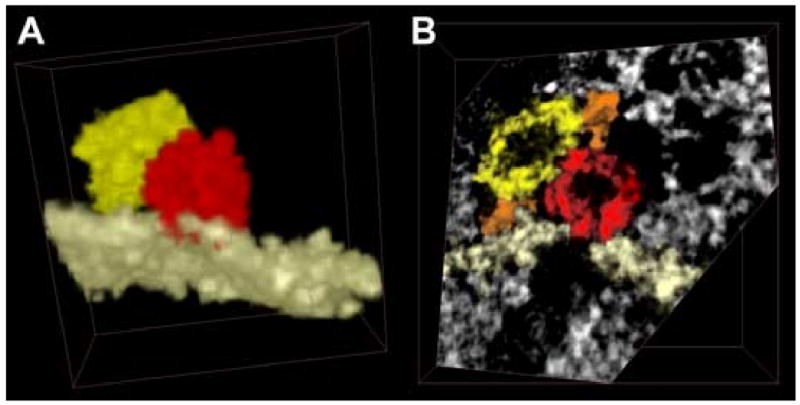
A vesicle is fused with the plasma membrane and in contact with another vesicle. (a) After segmentation, everything was excluded from the image apart from a single membrane, the fused vesicle and the neighboring one. Though vesicles have often been represented with the same color (yellow), the segmentation process can assign a different label to each vesicle, allowing us to represent them with multiple colors when necessary (as done here). Note the red spot on the membrane, demonstrative of the fusion between vesicle and membrane. In (b) a single plane is shown, cut obliquely to the edge of the volume, for a better representation of the region where the two vesicles touch other. The plasma membrane is shown in white and two filaments in orange.
Application to cryo-tomography
We have studied a few tomograms containing isolated axonemal microtubular doublets with attached the radial spokes embedded in vitreous ice. Dynein arms have been removed from the doublets by incubation in KI solution. In these conditions the radial spokes remain attached to the B-tubule of each microtubular doublet (MT-doublet). Tomograms were collected in single axis geometry, tilting from -60° to + 60° (Pigino et al., manuscript in preparation). Figure 7 presents a map portraying three doublets lying almost parallel to each other; the tilt axis was oriented parallel to the doublets.
Figure 7.
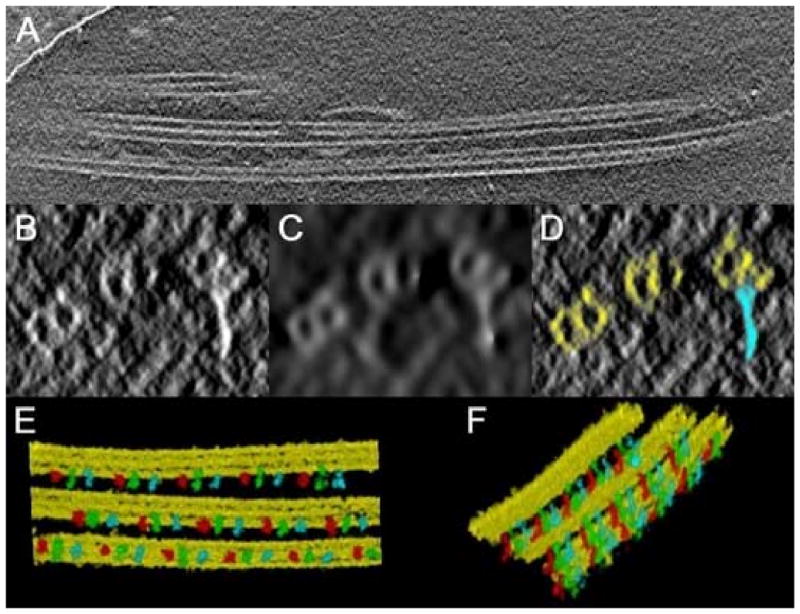
Segmentation of a cryotomogram containing ciliary MT-doublets, obtained in single axis geometry. (a) A plane section along XY; the tilt axis is oriented parallel to the doublets. (b-d) a section orthogonal to the tilt axis direction: (b) original plane; (c) after non linear anisotropic diffusion; (d) after segmentation. MT-doublets are in yellow, and radial spokes in light blue. (e-f) volume rendering views of the segmented doublets with radial spokes attached. Three different colors (red, green and blue) have been assigned to each non equivalent radial spoke of a triplet.
The low S/N derived from the unstained specimen and the strong anisotropy derived from single axis geometry made the tomogram quite difficult to analyze. The MT-doublets, laying on planes parallel to the tilt axis (7a), appeared in cross sections as elliptical and hollow structures (7b). Due to the low contrast intrinsic to the preparation of biological samples in vitreous ice, radial spokes were almost undistinguishable from featureless regions of the surrounding ice. In this condition the use of Just was problematic because of the difficulties in providing the human input about the gross position of the various structures. The small difference in density between the ice and the tubules was also insufficient to precisely extract the background, preserving the shape of the tubules.
To overcome these problems, the tomogram was filtered by non linear anisotropic diffusion (Frangakis and Hegerl, 2001) using Bsoft. The result of this powerful filter is shown in 7c. Here the center of the tubules were much more evident, as well as the radial spokes. We applied the watershed algorithm to the unfiltered volume and then we used the filtered map to trace a few points lying on the center of the tubules and to record the position of the radial spokes. In this way, Just clustered around the reference models the watershed regions extracted from the original map, with no loss in resolution. The result of the segmentation is shown in 7d, using the same plane of 7b-c. The density of the tubules and of the spokes was then isolated and the structures observed with volume rendering techniques (7e-f). Because the radial spokes were recorded using the MT-doublets as reference points it was possible to assign to each member of the triplet different colors. The detection of single radial spoke in a triplet might have a functional significance but this implication is still matter of discussion among structural biologist studying flagellar axonemes.
Discussion
Due to the ever-increasing dimensions of electron tomograms, segmentation has become an indispensable tool for modeling density values in 3D maps calculated from tissue sections (Frey et al., 2006). The preferred strategy is still manual segmentation that has been extremely useful in the analysis of cells and organelles in their cellular environments (see, e.g., He et al., 2003; Lučić et al., 2005) giving rise to the use of smooth surfaces or geometric solids. Despite its utility, however, there are several drawbacks to manual segmentation that curtail its generality and usefulness. First, since it is operator-based, biases are necessarily introduced in the tracing of organelle contours in the different planes of the reconstruction. Second, only organelles and macromolecules known to the operator can be segmented. Third, when the surface is rendered by creating an “isosurface” to represent the contour of an organelle, the density is converted to a binary map and a significant part of the information contained is lost. Fourth, when a geometric solid replaces the density, the segmented organelle or macromolecular complex is not suitable for further post-processing. Finally, these “isosurfaces”, that encompass a few points manually drawn or computationally evaluated, are normally neither smoothed nor low-pass filtered at the nominal resolution of the map. In consequence, the apparent resolution of these surfaces may become misleadingly better than that of the tomogram.
In this paper, we used semiautomatic segmentation, implemented with a program called JUST in an effort to deal with these drawbacks. For an objective segmentation, JUST is based on the watershed algorithm first introduced to the analysis of electron micrographs by Niels Volkmann (2002). When applied to chemical synapses, however, the resulting watershed maps were as difficult to analyze as the original volume. We thus combined the algorithm with manual classification of the different regions to assemble the organelles.
In this respect, JUST still depends heavily on operator input. However, this input is significantly reduced from that involved in manual segmentation since the fine contours of the organelles do not depend on the operator but on the behavior of the watershed algorithm. In this way, even if two users choose different points while marking the references for a membrane, the final boundaries of a membrane are likely to be the same. After all, with JUST, reference points define a surface used only to identify the correct watershed regions, not the shape of these regions. Moreover, since the program creates a history file that stores all used parameters, this input is recorded for reference or amendment, standardizing the involved subjectivity. The file includes the positions of the reference points as well as the thresholds adopted for each material, the number of steps used for the watershed algorithm, and the priorities of the materials used in the final composition. Users can repeat the analysis by testing new parameters as well as exchange the list of parameters with other investigators, defining with precision and specificity the contributions of the operator.
The most critical parameter is generally the number of intervals in which the dynamic range of the tomogram is divided, during the computation of the watershed map. Depending on this choice, the tomogram can be under- or over-segmented (Volkmann, 2002) and finding the right parameter requires skill and often more than one trial. Though the watershed computation is normally the most time consuming step of the process, it is fully automatic, apart from the initial choice input; therefore, many trials require only computer time, but not human interaction. The test of many choices is easy and inexpensive, because, after a complete segmentation process has been completed, the transfer of input parameters such as the position of the markers and the thresholds to a different watershed map is straightforward.
Another advantage of JUST is that all voxels comprising the maps are analyzed when the maps are processed by watershed segmentation. At the start of the interactive process, “known” organelles are extracted with inputs from the operator, at which time all remaining voxels are then classified and grouped according to quantitative criteria. Density information is always available since no voxel contained in the original map is eliminated during this process. All segmented structures are stored as sub-maps of density values. This allows the application of post-processing strategies, such as statistical analysis and averaging techniques, which can lead to the identification of novel structures. Moreover, the resolution of a segmented organelle is the same as that of the original tomogram, allowing information to be gleaned that is lost in geometric surface renderings. As an example, the volume rendering of the syndesome in Fig. 8, where the shape of a cage appears reminiscent of a clathrin coat, was made possible by the choice of extracting the syndesome voxels as densities (Zampighi et al., submitted). Rendering the volume as a surface or as a platonic polyhedron encompassing the points selected by the user does not produce the same results.
Figure 8.
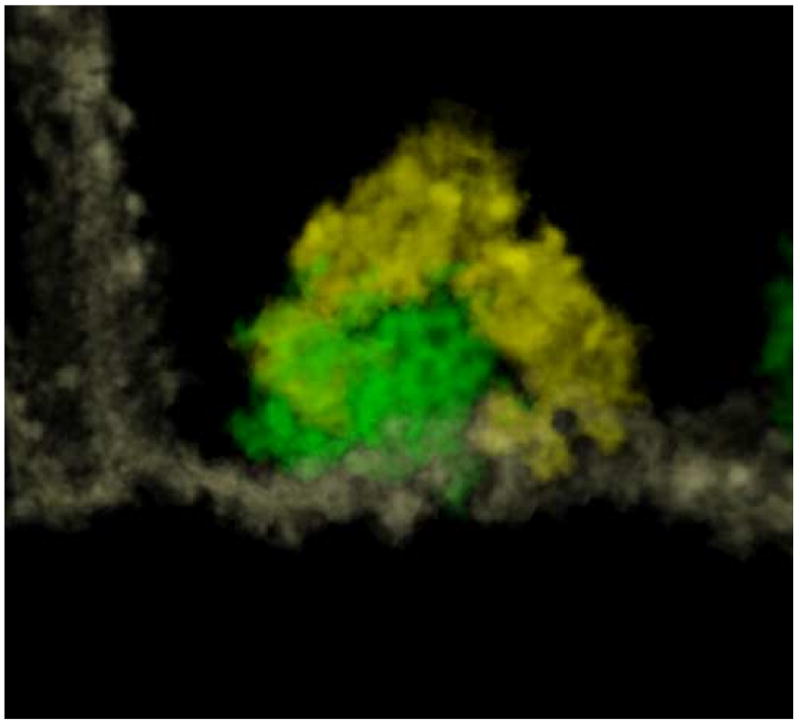
A syndesome (green) has been segmented and visualized with a volume rendering technique, together with the portion of membrane (white) to which it is attached. The density of the structure is such that a cage with polygonal faces is quite well-defined. Vesicles surrounding the syndesome are evidenced in yellow.
The program was tested on reconstructions from plastic embedded sections of chemical synapses and flagellar axonemes sectioned both orthogonal and parallel to the flagellum (data not shown). As expected, JUST segmented both types of tissue equally well, since the contrast and the noise level of the tomograms were similar. The principal difference in segmenting these tissues was the predominance of the membranous organelles in synapses and of microtubules in the flagella. Further, the behavior of JUST was not depending upon the collecting geometry, as we verified by studying tomograms of synapses collected in three different geometries (Cantele et al., 2007). We also tested JUST on cryotomograms of frozen hydrated rows of MT-doublets isolated by KI treatment on cilia from Tetrahymena (∼100 nm in thickness). For this type of specimen, the signal to noise ratio was quite low and the visual detection of the microtubular doublets was possible only after pre-processing the maps with severe low-pass filters. However, the watershed algorithm performed quite well on the original tomograms, and we successfully fused the information coming from both maps together (Figure 7).
The watershed algorithm has been introduced in 3D electron microscopy as a stand-alone method and applied with good results for the segmentation of both individual structures and tomographic maps (Volkmann 2002; Marsh et al., 2004). Other tools have been proposed as methods for automatic segmentation (Bartesaghi et al., 2005; Franhakis and Hegerl, 2002; Bajaj et al., 2003), and semiautomatic segmentation (Ress et al., 2004). Though each of these methods has been applied successfully on a few test samples, and though each one possesses its own distinct advantages, no method is currently able to cope with the wide spectrum of tissue sections and biological preparations that can be studied by electron tomography. Combining the specificity of manual segmentation with the objectivity of the watershed algorithm is at this point the best way to achieve this versatility.
Presently, the program includes models that can account for just a few structures (vesicles, membranes, tubules, polyhedrons) however, the organization of the program allows for the incorporation of future developments. As the study of different tissues provides tomograms containing structures that cannot be accommodated by the geometrical models designed so far, the addition of new models will be easy to accomplish. At present we have a list of possible models, which though used in different maps have not been used together within a single tomogram. New structures will require additional models, buttons, and parameters, but the basic architecture of the program will remain intact, including the watershed algorithm, background extraction and the final composition of all segmented objects.
Just is freely available for academic use on the web site: http://dcssi.istm.cnr.it/Lanzavecchia/Just. Interested users can contact fracesca.cantele@unimi.it or salvatore.lanzavecchia@unimi.it for more information.
Acknowledgments
We thank Takashi Ishikawa for his help with cryo-tomography and Pietro Lupetti for making available the cytoskeletal samples. This work was supported by grant Cofin 2004 and First 2005 (S.L.) and NIH EY-04410 (G.Z.)
Footnotes
Publisher's Disclaimer: This is a PDF file of an unedited manuscript that has been accepted for publication. As a service to our customers we are providing this early version of the manuscript. The manuscript will undergo copyediting, typesetting, and review of the resulting proof before it is published in its final citable form. Please note that during the production process errors may be discovered which could affect the content, and all legal disclaimers that apply to the journal pertain.
References
- Abramoff MD, Magelhaes PJ, Ram SJ. Image Processing with ImageJ. Biophotonics International. 2004;11:36–42. [Google Scholar]
- Amira - User's Guide and Reference Manual. Zuse Institute Berlin (ZIB) and Indeed - Visual Concepts GmbH; Berlin: 2001. http://www.amiravis.com. [Google Scholar]
- Bajaj C, Yu Z, Auer M. Volumetric feature extraction and visualization of tomographic molecular imaging. J Struct Biol. 2003;144:132–143. doi: 10.1016/j.jsb.2003.09.037. [DOI] [PubMed] [Google Scholar]
- Baker ML, Yu Z, Chiu W, Bajaj C. Automated segmentation of molecular subunits in electron cryomicroscopy density maps. J Struct Biol. 2006;156:432–441. doi: 10.1016/j.jsb.2006.05.013. [DOI] [PubMed] [Google Scholar]
- Bartesaghi A, Sapiro G, Subramaniam S. An Energy-Based Three-Dimensional Segmentation Approach for the Quantitative Interpretation of Electron Tomograms. IEEE Trans Image Proc. 2005;14:1314–1323. doi: 10.1109/TIP.2005.852467. [DOI] [PMC free article] [PubMed] [Google Scholar]
- Baumeister W. From proteomic inventory to architecture. FEBS letters. 2005;579:933–937. doi: 10.1016/j.febslet.2004.10.102. [DOI] [PubMed] [Google Scholar]
- Beck M, Forster F, Ecke M, Plitzko JM, Melchior F, Gerisch G, Baumeister W, Medalia O. Nuclear pore complex structure and dynamics revealed by cryoelectron tomography. Science. 2004;306:1387–1390. doi: 10.1126/science.1104808. [DOI] [PubMed] [Google Scholar]
- Bloom FE, Aghajanian GK. Cytochemistry of synapses: a selective staining method for electron microscopy. Science. 1966;154:1575–1577. doi: 10.1126/science.154.3756.1575. [DOI] [PubMed] [Google Scholar]
- Cantele F, Zampighi L, Radermacher M, Zampighi G, Lanzavecchia S. Local refinement: An attempt to correct for shrinkage and distortion in electron tomography. J Struct Biol. 2007;158:59–70. doi: 10.1016/j.jsb.2006.10.015. [DOI] [PMC free article] [PubMed] [Google Scholar]
- Frangakis AS, Hegerl R. Noise reduction in electron tomographic reconstructions using nonlinear anisotropic diffusion. J Struct Biol. 2001;135:239–250. doi: 10.1006/jsbi.2001.4406. [DOI] [PubMed] [Google Scholar]
- Frangakis AS, Hegerl R. Segmentation of two- and three-dimensional data from electron microscopy using eigenvector analysis. J Struct Biol. 2002;138:105–113. doi: 10.1016/s1047-8477(02)00032-1. [DOI] [PubMed] [Google Scholar]
- Frey TG, Perkins GA, Ellisman MH. Electron Tomography of Membrane-Bound Cellular Organelles. Annu Rev Biophys Biomol Struct. 2006;35:199–224. doi: 10.1146/annurev.biophys.35.040405.102039. [DOI] [PubMed] [Google Scholar]
- Goddard TD, Huang CC, Ferrin TE. Visualizing density maps with UCSF Chimera. J Struct Biol. 2007;157:281–287. doi: 10.1016/j.jsb.2006.06.010. [DOI] [PubMed] [Google Scholar]
- Gray EG. The granule cells, mossy synapses and Purkinje spine synapses of the cerebellum: light and electron microscope observations. J Anat Lond. 1963;97:101–106. [PMC free article] [PubMed] [Google Scholar]
- Grunewald K, Desai P, Winkler DC, Heymann JB, Belnap DM, Baumeister W, Steven AC. Three-dimensional structure of herpes simplex virus from cryo-electron tomography. Science. 2003;302:1396–1398. doi: 10.1126/science.1090284. [DOI] [PubMed] [Google Scholar]
- Harlow ML, Ress D, Stoschek A, Marshall RM, McMahan UJ. Nature. 2001;409:479–484. doi: 10.1038/35054000. [DOI] [PubMed] [Google Scholar]
- He W, Cowin P, Stokes DL. Untangling desmosomal knots with electron tomography. Science. 2003;302:109–113. doi: 10.1126/science.1086957. [DOI] [PubMed] [Google Scholar]
- Hegerl R. The EM Program Package: A Platform for Image Processing in Biological Electron Microscopy. J Struct Biol. 1996;116:30–34. doi: 10.1006/jsbi.1996.0006. [DOI] [PubMed] [Google Scholar]
- Heymann JB. Bsoft: Image and molecular processing in electron microscopy. J Struct Biol. 2001;133:156–169. doi: 10.1006/jsbi.2001.4339. [DOI] [PubMed] [Google Scholar]
- Heymann JB, Belnap DM. Bsoft: Image processing and molecular modeling for electron microscopy. J Struct Biol. 2007;157:3–18. doi: 10.1016/j.jsb.2006.06.006. [DOI] [PubMed] [Google Scholar]
- Hirokawa N, Sobue K, Kanda K, Harada A, Yorifuji H. The cytoskeletal structure of the presynaptic terminal and molecular structure of synapsin 1. J Cell Biol. 1989;108:111–126. doi: 10.1083/jcb.108.1.111. [DOI] [PMC free article] [PubMed] [Google Scholar]
- Hou HS, Andrews HC. Cubic splines for image interpolation and digital fitering. IEEE Trans Acoust Speech Signal Processing. 1978;26:508–517. [Google Scholar]
- Kremer JR, Mastronarde DN, McIntosh JR. Computer visualization of three-dimensional image data using IMOD. J Struct Biol. 1996;116:71–76. doi: 10.1006/jsbi.1996.0013. [DOI] [PubMed] [Google Scholar]
- Lanzavecchia S, Cantele F, Bellon PL, Zampighi L, Kreman M, Wright EA, Zampighi GA. Conical Tomography of Freeze-Fracture Replicas: a Method for the Study of Integral Membrane Proteins Inserted in Phospholipid Bilayers. J Struct Biol. 2005;149:87–98. doi: 10.1016/j.jsb.2004.09.004. [DOI] [PubMed] [Google Scholar]
- Lučić V, Förster F, Baumeister W. Structural studies by electron: from cells to molecules. Annu Rev Biochem. 2005;74:833–865. doi: 10.1146/annurev.biochem.73.011303.074112. [DOI] [PubMed] [Google Scholar]
- Marsh BJ, Volkmann N, McIntosh JR, Howell KE. Direct continuities between cisternae at different levels of the Golgi complex in glucose-stimulated mouse islet beta cells. PNAS. 2004;101:5565–5570. doi: 10.1073/pnas.0401242101. [DOI] [PMC free article] [PubMed] [Google Scholar]
- McEwen BF, Marko M. The emergence of electron tomography as an important tool for investigating cellular ultrastructure. J Histochem Cytochem. 2001;49:553–564. doi: 10.1177/002215540104900502. [DOI] [PubMed] [Google Scholar]
- Nicastro D, McIntosh JR, Baumeister W. 3D structure of eukaryotic flagella in a quiescent state revealed by cryo-electron tomography. Proc Natl Acad Sci U S A. 2005;102:15889–15894. doi: 10.1073/pnas.0508274102. [DOI] [PMC free article] [PubMed] [Google Scholar]
- Nicastro D, Schwartz C, Pierson J, Gaudette R, Porter ME, Richard McIntosh R. The Molecular Architecture of Axonemes Revealed by Cryoelectron Tomography. Science. 2006;313:944–948. doi: 10.1126/science.1128618. [DOI] [PubMed] [Google Scholar]
- Pettersen EF, Goddard TD, Huang CC, Couch GS, Greenblatt DM, Meng EC, Ferrin TE. UCSF Chimera - A Visualization System for Exploratory Research and Analysis. J Comput Chem. 2004;25:1605–1612. doi: 10.1002/jcc.20084. [DOI] [PubMed] [Google Scholar]
- Ress DB, Harlow ML, Marshall RM, McMahan UL. Methods for Generating High-Resolution Structural Models from Electron Microscope Tomography Data. Structure. 2004;12:1763–1774. doi: 10.1016/j.str.2004.07.022. [DOI] [PMC free article] [PubMed] [Google Scholar]
- Vincent L, Soille P. Watersheds in digital space: an e.cient algorithm based on immersion simulations. IEEE Trans Pattern Anal Mach Intell. 1991;13:583–598. [Google Scholar]
- Volkmann N. A novel three-dimensional variant of the watershed transform for segmentation of electron density maps. J Struct Bio. 2002;138:123–129. doi: 10.1016/s1047-8477(02)00009-6. [DOI] [PubMed] [Google Scholar]
- Zampighi G, Zampighi L, Fain N, Wright EM, Cantele F, Lanzavecchia S. Conical tomography II: A method for the study of cellular organelles in thin sections. J Struct Biol. 2005;151:263–274. doi: 10.1016/j.jsb.2005.05.008. [DOI] [PubMed] [Google Scholar]
- Zampighi G, Zampighi L, Fain N, Lanzavecchia S, Simon S, Wright EM. Conical tomography III: synaptic vesicles docked to the active zone are hemi-fused. Biophys J. 2006 doi: 10.1529/biophysj.106.084814. in press. [DOI] [PMC free article] [PubMed] [Google Scholar]


