Cancer immunotherapy approaches, including vaccination,[1] adoptive cell transfer (ACT),[2,3] and combinational strategies,[4] have been developed to assist the body's immune system to selectively recognize and kill malignant tumor cells. Currently, immunotherapies are evaluated by either function-based assays, such as enzyme-linked immunosorbent spot (ELISPOT) and limiting dilution studies,[5] or structure-based assays such as peptide-MHC tetramer labeling.[6] These assessment methods require invasive sample collection,[1-3] have not yielded strong correlations with clinical responses to treatment,[7] and provide limited in vivo T cell tracking information. Alternative visualization strategies have been developed, whereby T cells extracted from an animal and labeled ex vivo, are injected back into the animal to be monitored. This approach has been applied to positron emission tomography (PET), single-photon emission computed tomography (SPECT),[8] and multi-photon intravital microscopy.[9,10] More recently, magnetic nanoparticle labeling of T cells for in vivo tracking by MRI has received considerable attention, as MRI offers superior capabilities for deep-tissue, whole-body imaging at higher resolution than alternative imaging modalities.[11] These nanoparticles have been coupled with immunotherapy regimens as ex vivo T cell labels for ACT, inducing non-specific cellular uptake through conjugation with the transmembrane HIV-Tat peptide,[12,13] poly-L-lysine,[14] or using lipofection reagents.[15] While capable of labeling cells, these nanoparticles cannot specifically bind to cytotoxic T lymphocytes (CTLs) and thus, use of these nanoparticles in vitro requires either CTL isolation or prolonged CTL expansion before the labeling can be performed, and for in vivo tracking, is limited to externally tagged cells, neglecting endogenously recruited, vaccine-elicited or ad hoc labeling of adoptively transferred CTLs.
Here we present a dual-modality nanoparticle system capable of selectively labeling and imaging CTL cells expressing T cell receptors (TCR) that recognize cognate major histocompatibility complex (MHC) peptide complexes on the surface of antigen-presenting tumor cells. This work demonstrates the ex vivo T-cell selectivity and reporter functionality of the developed nanoparticle system as both a MRI and fluorescence contrast agent.
The nanoparticle system is made of an iron oxide nanoparticle (NP) with a thin covalently-bound polyethylene glycol (PEG) coating which is functionalized with peptide-MHC monomers, and coupled with the fluorophore, Alexa Fluor 647 (AF647). PEG-coated iron oxide nanoparticles (NP-PEG) were prepared following a previously established procedure,[16,17] and shown to have 26 linear PEG chains, each bearing a reactive amine, attached to the surface of each iron oxide core (Figures S1 and S2, and Supporting Information).
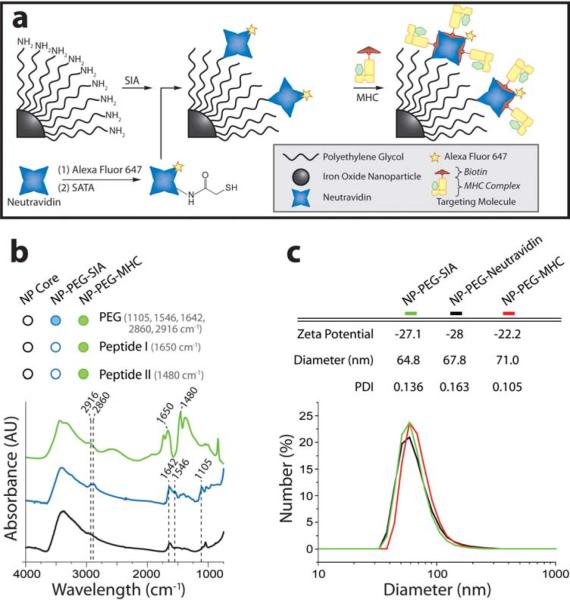
Peptide-MHC monomers were used to impart targeting specificity to the NP-PEG. Melanoma-reactive CTLs specific for the gp10025-33 epitope restricted by H-2D(b) (called pmel-1) can be tagged using multimers of the peptide-MHC complex presenting the pmel-1 peptide. Pmel-1 peptide MHC monomers were synthesized and biotinylated. A fluorophore-labeled neutravidin protein (neutravidin-AF647), with strong affinity for biotinylated peptide-MHC, was coupled to NP-PEG through a three-step process as illustrated in Figure 1a: (1) NP-PEG was reacted with N-succinimidyl iodoacetate (SIA) to yield sulfhydryl-reactive nanoparticles, (2) neutravidin was reacted with N-succinimidyl-S-acetylthioacetate (SATA) to present active sulfhydryl groups, and (3) the two components were reacted to form NP-PEG-neutravidin-AF647. The biotinylated peptide-MHC was then attached to neutravidin-AF647 to create the resulting functionalized nanoparticle (hereafter abbreviated as NP-PEG-MHC-AF647). Nanoparticle concentration was determined by inductively coupled plasma atomic emission spectroscopy, and the particle's core diameter was ~10 nm as determined previously.[17] Fluorometric analysis of the nanoparticle system yielded an estimated 2.59 dyes per neutravidin and 13.0 neutravidins per nanoparticle (Figures S1 and S2).
Figure 1.
Nanoparticle synthesis and characterization. (a) Schematic illustration of synthesis of NP-PEG-MHC-AF647. Iron oxide nanoparticles were coated with a functionalized PEG to which neutravidin was covalently bound via a thioether linkage. Biotinylated peptide-MHC was attached to the PEG termini, lending the particle targeting specificity for CTLs. Neutravidin was pre-labeled with the fluorophore, Alexa Fluor 647. (b) Surface modification of nanoparticles with PEG and MHC/peptide verified by FTIR. (c) Hydrodynamic size and zeta-potential of nanoparticle constructs at physiologic pH.
Nanoparticle coating and surface functionalization with peptide-MHC monomers were confirmed by FTIR (Figure 1b and Supporting Information). Hydrodynamic size of the PEG-coated nanoparticle was 64.8 nm, increasing minimally to 71.0 nm (PDI 0.105) subsequent to attachment of neutravidin (NP-PEG-neutravidin) and peptide-MHC (NP-PEG-MHC-AF647; Figure 1c). Likewise, nanoparticle zeta-potential remained consistent during particle preparation (Figure 1c).
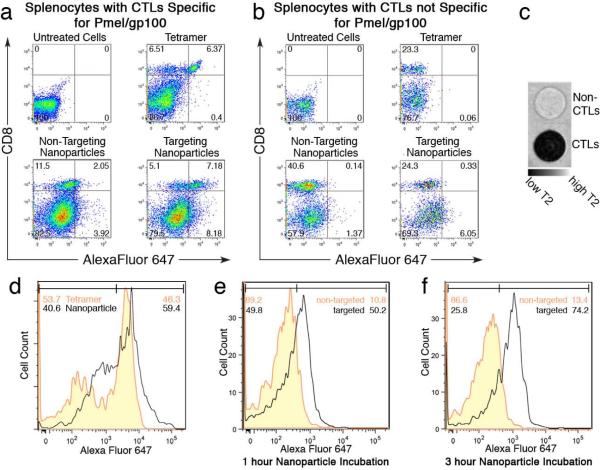
To evaluate the specific binding of the nanoparticle to CTLs (T cells expressing TCR) among various types of cells present in a splenocyte population, NP-PEG-MHC-AF647 (targeting nanoparticles), NP-PEG-AF647 (non-targeting nanoparticles, as control for comparison), and MHC-tetramer-AF647 (synthesized by reacting biotinylated peptide-MHC with AF647-conjugated streptavidin as previously described;21 Supporting Information) were incubated for 30 min with splenocytes isolated from Pmel-1 transgenic mice (comprised of targeted CTLs expressing the T cell receptor for the melanoma-associated pmel epitope) or the splenocytes isolated from B6 trangenic mice (representing control non-targeted CTLs). Prior to nanoparticle incubation, these cells were filtered by passage through a 25g needle and incubated in RPMI 1640 with 10% heat-inactivated fetal bovine serum, 2mM L-glutamine, 25mM HEPES, 1mM sodium pyruvate, 100 μg/ml streptomycin, and 100 μg/ml penicillin. MHC-tetramer-AF647, a standard labeling molecule for T-cell isolation, served as a benchmark to provide a quantitative measure of the labeling efficacy of NP-PEG-MHC-AF647. After incubation, cells were washed to remove unbound nanoparticles or tetramers, labeled with a fluorescein-isothiocyanate (FITC)-labeled anti-CD8 antibody to identify CTLs (CD8+), and analyzed by flow cytometry (Figures 2a and 2b). Targeting nanoparticles showed significant CTL binding (58.47%; note that only a specific CTL subpopulation is targeted) and minimal non-CTL attachment (9.33%), demonstrating selective cell labeling. CTL labeling efficiency was measured as the ratio of CTLs labeled by nanoparticles or tetramers divided by the total CTL population (CD8+ cells) (Table 1). Targeting nanoparticles demonstrated 3.9 fold higher labeling of CTLs than non-targeting nanoparticles and 44 fold higher labeling efficiency for CTLs than for non-CTLs. Non-targeting nanoparticles showed only 15% of the CTLs labeled, which is normal as a result of non-specific particle attachment. The targeting nanoparticle bound to CTLs with the complementary TCR, while non-targeted CTLs did not bind the nanoparticles (1.34% labeled; Figure 2b), further demonstrating the specificity of targeting nanoparticles.
Figure 2.
Targeting specificity of NP-PEG-MHC-AF647 for CTLs. Flow cytometry profile of splenocyte cell populations with targeted CTLs (a) or splenocytes with non-targeted CTLs (b) incubated with nanoparticles bearing an Alexa Fluor 647 fluorochrome (x-axis) and stained by a FITC-labeled anti-CD8+ antibody (y-axis). (c) MRI phantom image of CTL and non-CTL cells incubated with targeting nanoparticles. (d) Flow cytometry analysis of CTLs incubated with targeting nanoparticles or peptide-MHC tetramers. (e & f) Flow cytometry analysis of CTLs+ incubated with targeting and non-targeting nanoparticles at two different incubation times.
Table 1.
Percentage of CTLs labeled by nanoparticles, as evaluated by flow cytometry.
| Splenocytes without CTL (from w.t. B6 mice) (%) | Splenocytes with CTL (from pmel-1 mice)(%) | |
|---|---|---|
| Non-Targeting Nanoparticles | 0.34 | 15.13 |
| Targeting Nanoparticles | 1.34 | 58.47 |
| Tetramer | 0 | 49.46 |
NP-PEG-MHC-AF647 was further demonstrated as a MRI probe. CTLs separated from the splenocyte population and the remaining non-CTLs were separately incubated with targeting nanoparticles. Cells were suspended in an agarose cast[18] and imaged by MRI. The MR phantom image in Figure 2c shows the CTLs significantly darker (negative contrast enhancement) than the non-CTL cells. The contrast enhancement was quantified by the corresponding T2 relaxation times, which were 24 ± 3 ms and 71 ± 2 ms for CTL and non-CTL samples, respectively. Specific cell labeling, here, was markedly more efficient (0.5-3 hr) than alternative non-specific loading schemes that require relatively lengthy incubation times (up to 48 hours).[14,15,19]
To test the avidity of NP-PEG-MHC-AF647 for CTLs, cell-binding of the targeting nanoparticle was compared with that of MHC-tetramer-AF647. Flow cytometry showed that the nanoparticle binding to the CTLs was higher than tetrameric labeling (59.4% vs. 46.3%; Figure 2d), probably attributable to higher valency of the nanoparticles. Although four peptide-MHC complexes are presented on each tetramer, steric hindrance limits the number of bound complexes to two or three at a time.[20] Nanoparticle labels are expected to offer greater binding avidity due to increased peptide-MHC presentation. The multiple, flexible PEG chains of the nanoparticle coat, on which the targeting molecule is displayed, can present multiple peptide-MHCs to the target cell.
Prolonged cell exposure to nanoparticles may potentially increase non-specific particle attachment to cells. To show minimal non-specific interactions, splenocytes were incubated with nanoparticles for 1 or 3 hrs. The results in Figures 2e and 2f show that targeting nanoparticles showed 4.65 times higher avidity for CTLs than non-targeting nanoparticles after 1 hr, and 5.54 times after 3 hrs. Significantly, non-specific attachment of non-targeting nanoparticles remained under 14% after 3 hours.
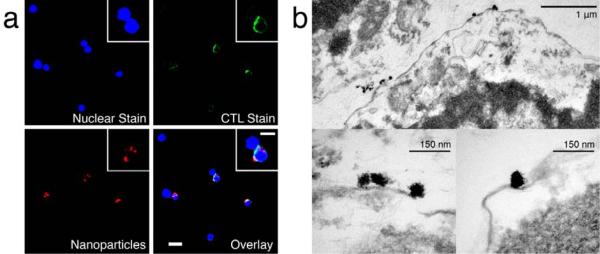
Targeted cellular labeling with the nanoparticles and their cellular localization was visualized by fluorescence microscopy. Splenocytes containing CTLs were incubated with targeting nanoparticles for 1 hr, stained, and imaged. Fluorescence images of cells co-stained with the CD8+ antibody (green), 4,6-diamidino-2-phenylindol (DAPI) nuclear stain (blue), and nanoparticles labeled with the AF647 (red) demonstrated specific attachment of the targeting nanoparticles to CTL cells (Figure 3a), while non-targeting nanoparticles showed limited AF647 fluorescence signal from either CD8+ or CD8-cells (Figure S3a).
Figure 3.
Micrographs of targeting nanoparticle-labeled CTLs. (a) Fluorescently-labeled CTLs incubated with nanoparticles coupled with Alexa fluorophore (red). The cells were labeled with a DAPI for nuclear stain (blue) and with a FITC-CD8+ antibody for CTL identification (green). (b) TEM micrograph of CTLs labeled with targeting nanoparticles. Nanoparticles are shown, bound at the surface of the T cell cross sections.
The localization of nanoparticles within the cells was examined by transmission electron microscopy (TEM). Splenocytes containing CTLs were incubated with targeting nanoparticles; the CTL subpopulation was then isolated by fluorescence-activated cell sorting (FACS) and imaged by TEM. Nanoparticles accumulated at the outer leaflet of the cell membrane (Figure 3b), agreeing with the fluorescence imaging where signal intensity was greatest at the cellular edges indicating surface localization of nanoparticles (Figure 3a). The specific attachment of individual nanoparticles at the cellular membrane illustrates the selective binding of the nanoparticles via TCR affinity. Binding of non-targeting nanoparticles to CTLs was not readily observed by TEM (Figure S3b).
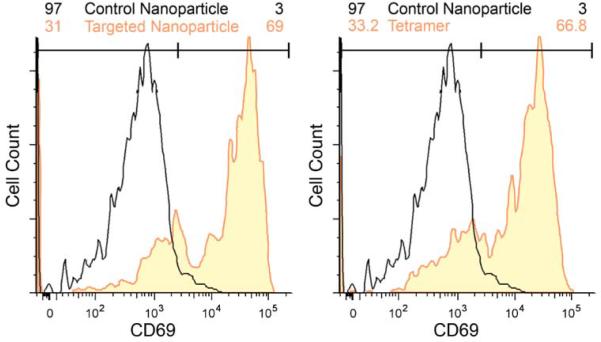
Functional CTL activity after nanoparticle labeling was demonstrated by the upregulation of the activation induction molecule (CD69; Figure 4). CD69 expression was characterized by flow cytometry 18 hrs post incubation on CTLs exposed to targeting nanoparticles, non-targeting nanoparticles, or peptide-MHC tetramer. Study showed cells exposed to either targeting nanoparticles or MHC-tetramer-AF647 tetramers elicited similar, normal CD69 expression (69 and 66.8%, respectively), while unstimulated control nanoparticles demonstrated no CD69 increase (Figure 4).
Figure 4.
Functionality of nanoparticle-labeled CTLs. Flow cytometry analysis of the functionality of CTLs incubated with control/targeting nanoparticles (left) and control nanoparticles/tetramer (right) 18 hrs post incubation. Cells incubated with nanoparticles or tetramers were probed for upregulation of CD69, an early indicator of T cell activation. Targeting nanoparticles demonstrated T cell functionality comparable to MHC- peptide tetramers after loading.
Selective cell labeling offers clinicians and researchers the ability to identify specific cell populations and monitor their localization patterns throughout a biological system. Here, we have developed a nanoparticle system that can be used to tag and monitor CTLs directed against melanoma tumor cells using MR and fluorescence imaging. The nanoparticles were functionalized with peptide-MHC monomers (Figure 1) for directed binding to specific CTLs and demonstrated high specificity and labeling efficiency in less than one hour (Figure 2). The ability of the developed nanoparticle system to discriminate between specific T cell populations in mixed cellular systems, while demonstrating limited non-specific attachment to non-targeted cells, has not been established by alternative nanoparticle systems.
Magnetic microparticles labeled with antibodies are often used to separate cells in vitro but require removal prior to manipulation due to their adverse effects on cell functionality. Cells labeled by nanoparticles can retain full functionality subsequent to isolation, as reported in the literature[21] and demonstrated in this study (Figure 4). Current ACT strategies using existing non-targeting nanoparticle systems require FACS sorting of cells labeled with peptide-MHC tetramers, cellular expansion, followed by CTL labeling with the non-targeting magnetic nanoparticles for in vivo tracking. The nanoparticle system presented here can directly label antigen-specific CTLs and allows separation of labeled cells with magnetic columns, which would significantly speed up the labeling process, reduce the processing cost, simplify clinical application of the technology, and limit the physical and biological impact on labeled cells. Combined with targeted labeling, the flexibility of this dual-imaging capable nanoparticle system can be potentially used for in vivo T cell labeling, followed by tracking with either MRI or fluorescence reporting.
Supplementary Material
Acknowledgments
This work is supported in part by NIH grants (R01CA119408 and R01EB006043). J.G. would like to acknowledge NIH training grant (T32GM065098). C.Y. and H. W. would like to acknowledge the Clinical Scientist Award in Translational Research from the Burroughs Wellcome and the ASCO Young Investigator Award, respectively.
Footnotes
References
- [1].Klebanoff CA, Finkelstein SE, Surman DR, Lichtman MK, Gattinoni L, Theoret MR, Grewal N, Spiess PJ, Antony PA, Palmer DC, Tagaya Y, Rosenberg SA, Waldmann TA, Restifo NP. Proc Natl Acad Sci U S A. 2004;101:1969–1974. doi: 10.1073/pnas.0307298101. [DOI] [PMC free article] [PubMed] [Google Scholar]
- [2].Dudley ME, Wunderlich JR, Yang JC, Sherry RM, Topalian SL, Restifo NP, Royal RE, Kammula U, White DE, Mavroukakis SA, Rogers LJ, Gracia GJ, Jones SA, Mangiameli DP, Pelletier MM, Gea-Banacloche J, Robinson MR, Berman DM, Filie AC, Abati A, Rosenberg SA. J Clin Oncol. 2005;23:2346–2357. doi: 10.1200/JCO.2005.00.240. [DOI] [PMC free article] [PubMed] [Google Scholar]
- [3].Yee C, Thompson JA, Byrd D, Riddell SR, Roche P, Celis E, Greenberg PD. PNAS. 2002;99:16168–16173. doi: 10.1073/pnas.242600099. [DOI] [PMC free article] [PubMed] [Google Scholar]
- [4].Overwijk WW. Curr Opin Immunol. 2005;17:187–194. doi: 10.1016/j.coi.2005.01.011. [DOI] [PubMed] [Google Scholar]
- [5].Yee C, Riddell SR, Greenberg PD. Curr Opin Immunol. 2001;13:141–146. doi: 10.1016/s0952-7915(00)00196-5. [DOI] [PubMed] [Google Scholar]
- [6].Yee C, Greenberg P. Nat Rev Cancer. 2002;2:409–419. doi: 10.1038/nrc820. [DOI] [PubMed] [Google Scholar]
- [7].Rosenberg SA, Yang JC, Restifo NP. Nat Med. 2004;10:909–915. doi: 10.1038/nm1100. [DOI] [PMC free article] [PubMed] [Google Scholar]
- [8].Pautler RG, Fraser SE. Curr Opin Immunol. 2003;15:385–392. doi: 10.1016/s0952-7915(03)00073-6. [DOI] [PubMed] [Google Scholar]
- [9].Sumen C, Mempel TR, Mazo IB, von Andrian UH. Immunity. 2004;21:315–329. doi: 10.1016/j.immuni.2004.08.006. [DOI] [PubMed] [Google Scholar]
- [10].Boissonnas A, Fetler L, Zeelenberg IS, Hugues S, Amigorena S. J Exp Med. 2007:345–56. doi: 10.1084/jem.20061890. [DOI] [PMC free article] [PubMed] [Google Scholar]
- [11].Bulte JW, Duncan ID, Frank JA. J Cereb Blood Flow Metab. 2002;22:899–907. doi: 10.1097/00004647-200208000-00001. [DOI] [PubMed] [Google Scholar]
- [12].Josephson L, Tung CH, Moore A, Weissleder R. Bioconjug Chem. 1999;10:186–191. doi: 10.1021/bc980125h. [DOI] [PubMed] [Google Scholar]
- [13].Kircher MF, Allport JR, Graves EE, Love V, Josephson L, Lichtman AH, Weissleder R. Cancer Res. 2003;63:6838–6846. [PubMed] [Google Scholar]
- [14].Arbab AS, Bashaw LA, Miller BR, Jordan EK, Lewis BK, Kalish H, Frank JA. Radiology. 2003;229:838–846. doi: 10.1148/radiol.2293021215. [DOI] [PubMed] [Google Scholar]
- [15].Hoehn M, Kustermann E, Blunk J, Wiedermann D, Trapp T, Wecker S, Focking M, Arnold H, Hescheler J, Fleischmann BK, Schwindt W, Buhrle C. Proc Natl Acad Sci U S A. 2002;99:16267–16272. doi: 10.1073/pnas.242435499. [DOI] [PMC free article] [PubMed] [Google Scholar]
- [16].Kohler N, Fryxell GE, Zhang M. J Am Chem Soc. 2004;126:7206–7211. doi: 10.1021/ja049195r. [DOI] [PubMed] [Google Scholar]
- [17].Veiseh O, Sun C, Gunn J, Kohler N, Gabikian P, Lee D, Bhattarai N, Ellenbogen R, Sze R, Hallahan A, Olson J, Zhang M. Nano Lett. 2005;5:1003–1008. doi: 10.1021/nl0502569. [DOI] [PubMed] [Google Scholar]
- [18].Sun C, Sze R, Zhang M. J Biomed Mater Res A. 2006;78:550–557. doi: 10.1002/jbm.a.30781. [DOI] [PubMed] [Google Scholar]
- [19].Bulte JW, Douglas T, Witwer B, Zhang SC, Strable E, Lewis BK, Zywicke H, Miller B, van Gelderen P, Moskowitz BM, Duncan ID, Frank JA. Nat Biotechnol. 2001;19:1141–1147. doi: 10.1038/nbt1201-1141. [DOI] [PubMed] [Google Scholar]
- [20].Davis MM, Lyons DS, Altman JD, McHeyzer-Williams M, Hampl J, Boniface JJ, Chien Y. Ciba Found Symp. 1997;204:94–100. doi: 10.1002/9780470515280.ch7. discussion 100-104. [DOI] [PubMed] [Google Scholar]
- [21].Lewin M, Carlesso N, Tung CH, Tang XW, Cory D, Scadden DT, Weissleder R. Nat Biotechnol. 2000;18:410–414. doi: 10.1038/74464. [DOI] [PubMed] [Google Scholar]
Associated Data
This section collects any data citations, data availability statements, or supplementary materials included in this article.


