Abstract
Dialysis is measured as Kt/V, which scales the dose (Kt) to body water content (V). Scaling dialysis dose to body surface area (Sdub) has been advocated, but the implications of such rescaling have not been examined. We developed a method of rescaling measured Kt/V to Sdub and studied the effect of such alternative scaling on the minimum adequacy values that might then be applied in male and female patients of varying body size. We examined anthropometric estimates of V and S (Watson vs. Dubois estimates) in 1765 patients enrolled in the HEMO study after excluding patients with amputations. An S-normalized target stdKt/V was defined, and an adequacy ratio (R) was computed for each patient as R = D/N where D = delivered stdKt/V (calculated using the Gotch–Leypoldt equation for stdKt/V) and N = the S-normalized minimum target value. In the HEMO data set, we determined the extent to which baseline (prerandomization) stdKt/V values would have exceeded such an S-based minimum target stdKt/V. The median Vwat:Sdub ratios were significantly higher in men (21.34) than in women (18.50). The average of these (20) was used to normalize the current suggested minimally adequate value (stdKt/V ≥ 2.0 / week) to the S-normalized target value (stdKt/S ≥ 40 L/M2), assuming that average modeled V = average anthropometric V. To achieve this S-normalized target, the required single-pool (sp) Kt/V was always higher in women than in men at any level of body size. For small patients (Vwat = 25L), required stdKt/V values were 2.05 and 2.21/week for men and women, respectively, corresponding to spKt/V values of 1.31 and 1.52/session. On the other hand, large (Vwat = 50L) male patients would need spKt/V values of only 1.0/session. Prerandomization baseline dialysis sessions in the HEMO study were found to meet such a new S-based standard in almost all (766/773) men and in 885/992 women. An analysis of scaling dose to anthropometrically estimated liver size (L) showed similar gender ratios for Vwat:L and Vwat:Sdub, providing a potential physiologic explanation underpinning S-based scaling. S-based scaling of the dialysis dose would require considerably higher doses in small patients and in women, and would allow somewhat lower doses in larger male patients. Current dialysis practice would largely meet such an S-based adequacy standard if the dose were normalized to a Vwat:Sdub ratio of 20.
Hemodialysis therapy is commonly scaled to the urea distribution volume (V). The choice of V is governed by the fact that urea, which is distributed in body water, was initially chosen as the marker solute. Elimination of urea by dialysis more or less follows first-order kinetics with an elimination constant equal to K/V, where K is the dialyzer clearance and V is the urea distribution volume, approximately equal to total body water content (1). The product of K/V, which can be considered a measure of dialysis intensity, and t, the dialysis session length (time), has been accepted as a measure of dialysis dose independent of body size. Concern has been raised about the relatively low dialysis dose (when expressed as Kt or liters of plasma cleared) provided to smaller patients and in particular, women (2,3); such patients have relatively low values forV compared to body surface area (S).
Alternative methods of scaling Kt/V have been proposed, including no scaling, providing the same Kt to all patients (4), scalingKt toS (5), or scaling Kt to basal metabolicrate (6,7).Scaling to visceral mass as the presumptive source of uremic toxins has also been proposed. (8). Native kidney function is measured as the glomerular filtration rate (GFR).In a recent study, some of us examined the impact of scaling native kidney GFR, measured with 125iothalamate, to anthropometric estimates of V or S in healthy kidney donors. When men were compared with women, GFR/S values were similar in men and women, but GFR/V values were substantially different (9).
One problem with scaling dialysis dose (Kt) to S is that currently, in most dialysis centers in the United States.Kt/V is measured, instead of Kt, with Kt/V calculated from the ratio pre/post BUN weight change during dialysis, and session length; V and Kt cannot easily be disentangled without accurate measures of dialyzer clearance. Direct, reliable measures of Kt are becoming available from dialysis machines with conductivity-measuring devices, but their presence is not yet universal. Thus, monthly measurements of the blood urea reduction ratio from which Kt/V measurements are derived remain the current standard. Given this reality, we attempted to develop an algebraic method of putting a “wrapper” around the delivered Kt/V in order to “rescale” Kt/V to anthropometric estimates of S. We further examined the implications of surface-area-based scaling to KDOQI-recommended minimum values for session (3/week) and standard Kt/V, based on the relationships among anthropometric estimates of V and S observed in patients studied prior to randomization in the HEMO study.
Materials and Methods
Anthropometric and modeling data were drawn from a prerandomization modeling session performed in 1846 patients who were accepted into the baseline phase of the HEMO study (10). The characteristics of these patients have been described previously (10). Both men and women were well represented, the mean age of the patients was 57.6 (14.0) years, and African Americans made up 62.6% of the study population. For this analysis, 81 patients with amputations were excluded, leaving 1765 for analysis. For each subject, body surface area was computed from postdialysis weight and height measured during the baseline period using the equations of Dubois and Dubois (11). Anthropometric V (Vwat) was determined from the Watson equations for men and women (12). Equations of the form S = aVb were fit by applying orthogonal regression (13) to relate logarithmically transformed values of S and V separately for men and women. These regression equations were used to calculate expected ratios of V:S when V = 25, 30, 35, 40, 45, and 50 l. A value close to the average of the median values in men and women for V:S ratio, namely 20L/M2 was used as a normative ratio to calculate target stdKt/S values corresponding to a stdKt/V value of 2.0.
The stdKt/V was computed for each patient from single-pool Kt/V, dialysis session length (t), and dialysis frequency (N) using a modification of the Leypoldt equation (14) as described in the KDOQI 2006 guidelines (15).
The equilibrated Kt/V (eKt/V) was computed from spKt/V using the Tattersall equation (16):
where t is dialysis session length in minutes. For each patient, an “adequacy ratio” (R) was computed as D/N, where D is the delivered stdKt/V, and N the S-normalized minimum target stdKt/V. The latter was calculated as:
where 2.0 is the current stdKt/V minimum standard, 20 is the normalizing Vwat:Sdub ratio (described in the Results section), and Sdub and Vwat are the Dubois and Watson estimates of surface area and body water, respectively, calculated for each patient based on weight, height, gender, and age. R was then plotted against the spKt/V for both men and women to determine the extent to which dialysis doses delivered to HEMO patients before randomization would meet the new S-normalized target (N).
The exponential regressions of Sdub vs. Vwat were then used to compute estimated Vwat:Sdub values in men and women when V is 25–50L, and these values were used to compute the average stdKt/V as well as 3/week session spKt/V that would be required to achieve S-normalized minimum target values of stdKt/V for each value of V. The relationship between spKt/V and stdKt/V is dependent on session length (t). In determining the required spKt/V values for patients with Vwat levels of 25–50L, values for t were derived based on an estimated dialyzer clearance of 250 ml/minute. The session length was set accordingly unless it was less than 180 minutes; in such a case a 180 minute session length was used.
Results
Relationship between Dubois S and Watson V
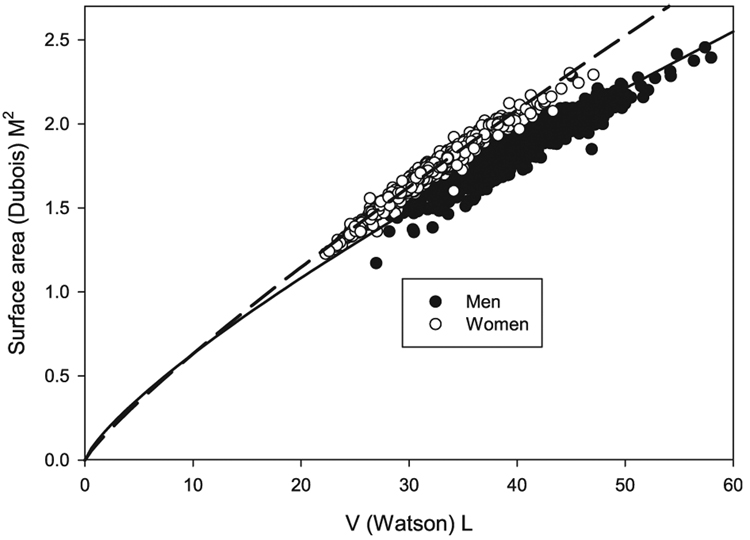
These results are shown in Fig. 1. The median values for Watson V were 38.85 and 31.07L for men and women, respectively. The corresponding median values for Dubois S were 1.82 and 1.68. Exponential regressions of the form S = aVb fit the data well, with coefficients for men (a = 0.104, b = 0.770) and women (a = 0.085, b = 0.866) being substantially different.
Fig. 1.
Plot of Dubois S vs. Watson V. Equations of the form S = aVb were used to fit the data. Coefficients for a were 0.104 and 0.085 and for b were 0.780 and 0.866 for men and women, respectively.
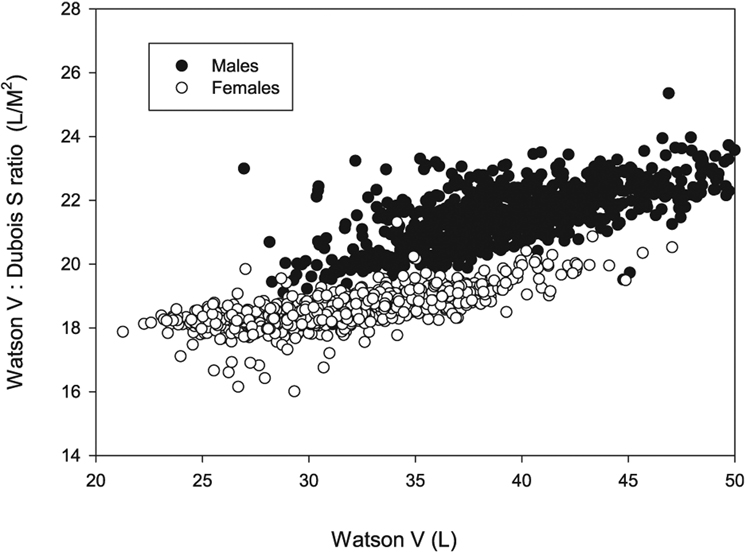
In Fig. 2, the same data are replotted as Vwat:Sdub vs. Vwat. As can be seen, the Vwat:Sdub ratio increases with increasing body size (the latter expressed as Vwat), but the ratios are different between the genders, with median values of 21.34 in men and 18.50 in women. The average of these two numbers is close to 20, and this value was used as the normalizing factor to adjust the dialysis dose from a V-based approach to S-based scaling.
Fig. 2.
Relationship of Vwat:Sdub ratio to Vwat (by gender), The relationships were close to linear, Vwat:Sdub increased as Vwat increased, and Vwat:Sdub was higher in men than in women.
Extent to Which HEMO Prerandomization Therapy Would Meet the New Target
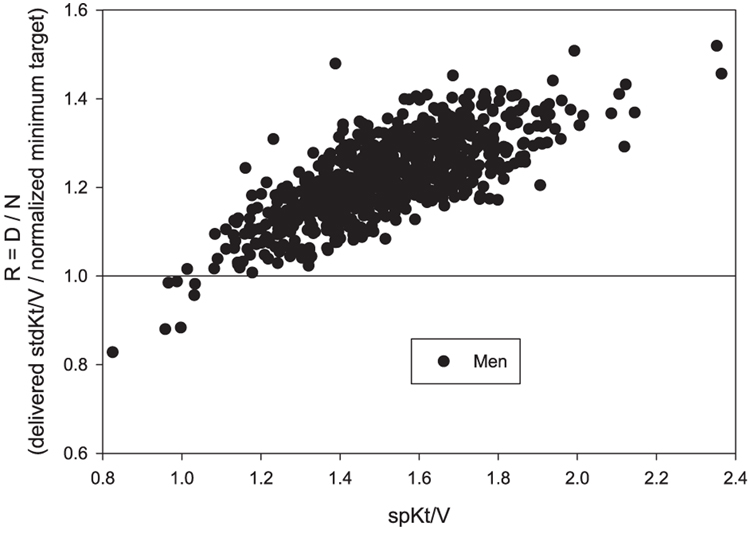
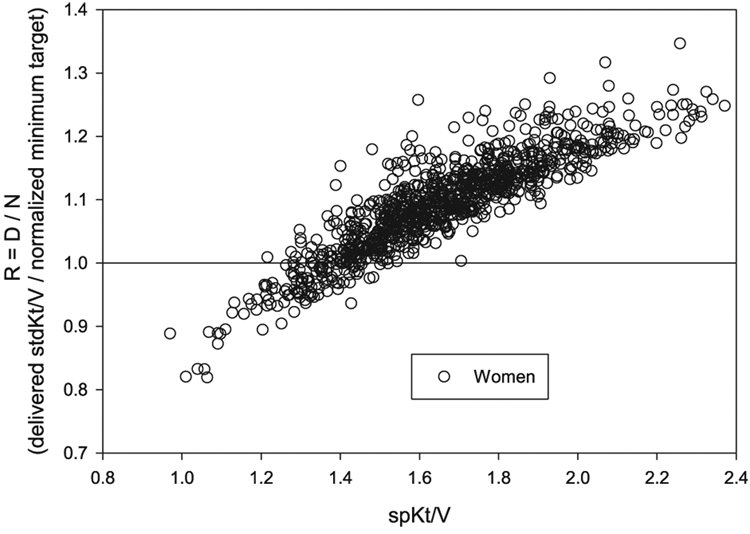
In the HEMO study, baseline (prerandomization) values for the adequacy ratio, R, calculated as described in the Materials and Methods section, are shown in Fig. 3 for men and in Fig. 4 for women, each plotted against delivered spKt/V. It is clear that in most instances, the stdKt/V that was delivered to these patients prior to randomization would still exceed an S-based minimum target defined in this way, as R was ≥1.0 in almost all men and in the great majority of women. However, in men this occurred when spKt/V > 1.05/ session, whereas in women, a considerably higher level of spKt/V was required, approximately 1.5/session. A nonnegligible percentage of the women patients, especially those with spKt/V < 1.5, would not meet the minimum S-normalized stdKt/V target (e.g., R < 1.0).
Fig. 3.
Plot of adequacy ratio R (delivered stdKt/V divided by N, the S-normalized minimum target stdKt/V) in the HEMO baseline patients (men) against spKt/V. D was computed using the fixed volume Gotch–Leypoldt stdKt/V equation. The normalized target (N) = 40 × Sdub/Vwat. The data show that almost all men (766/773) would achieve the new target, and that a minimum spKt/V value in the range of 1.05 was all that was required.
Fig. 4.
Plot of adequacy ratio R (delivered stdKt/V divided by N, the S-normalized target stdKt/V) in the HEMO baseline patients (women) against spKt/V. The data show that almost all women (885/992) would achieve the new S-normalized minimum target, but that an spKt/V value of 1.5 or higher would be necessary.
Calculation of Minimum Required Values for stdKt/V Based on Body Size and Gender
Using the regression equations for Sdub vs. Vwat, predicted average Vwat:Sdub ratios were estimated in men and women for values of V ranging from 25 to 50 l. These were used to compute values for the S-normalized minimum target values (N) for stdKt/V according to gender and size (V). These results are shown in Table 1.
TABLE 1.
S-normalized minimum target stdKt/V values (N) by body size and gender
| Watson V | 25 | 30 | 35 | 40 | 45 |
|---|---|---|---|---|---|
| Men | 2.049 | 1.968 | 1.902 | 1.848 | 1.800 |
| Women | 2.209 | 2.155 | 2.111 | 2.074 | 2.041 |
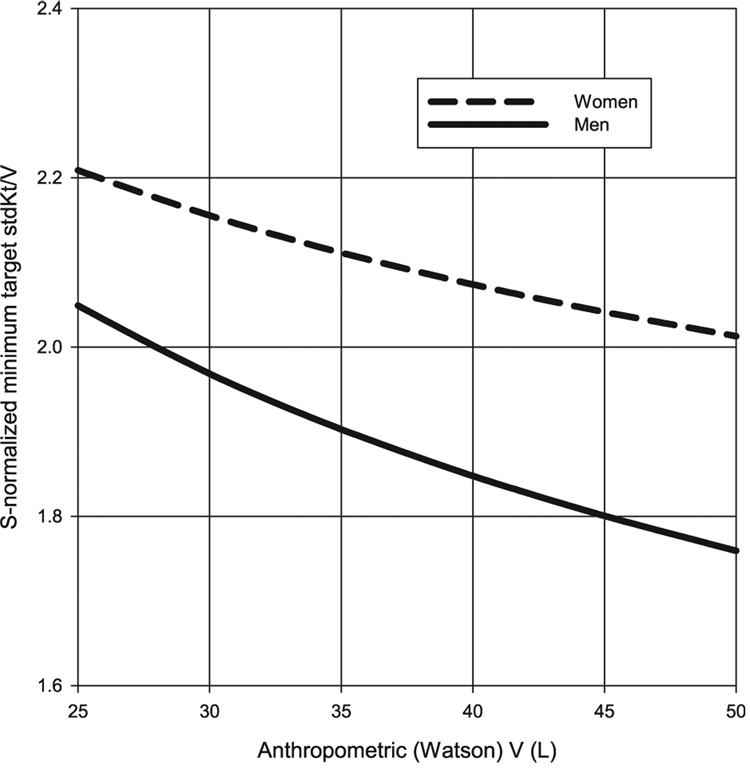
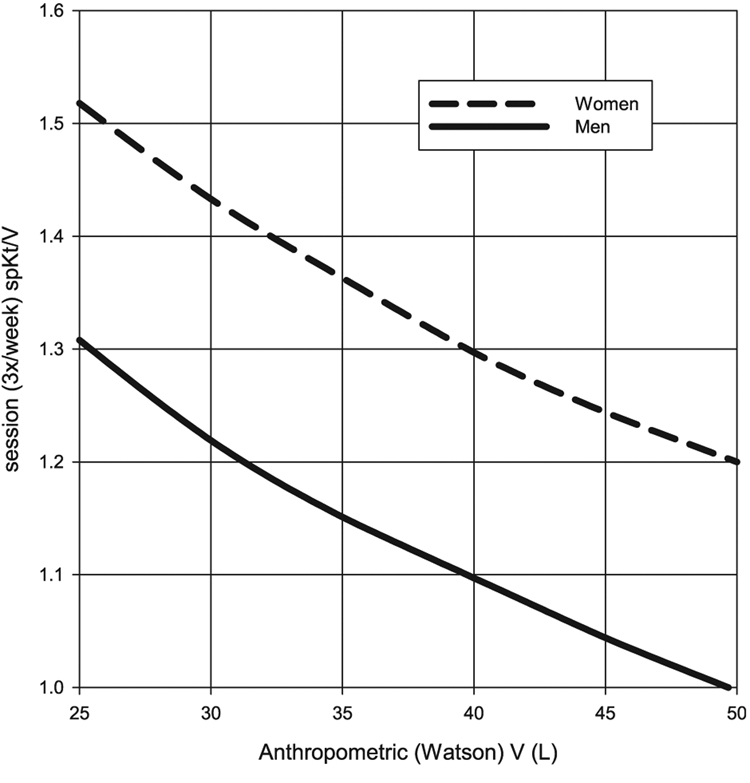
These results are plotted graphically in Fig. 5 and Fig. 6. Required stdKt/V values range from 8%to 13% higher in women than in men, with the increase across genders becoming greater with larger body size. When considering required session Kt/V values, the results are very session-length dependent, but again, are 16–19% higher in women than in men. For very small patients, the required spKt/V targets are in the range of 1.31 formen, and 1.52 for women. In large (e.g., Vwat = 50L) male patients, this method of S-normalization suggests that session spKt/V values ≥1.0may be sufficient (Fig. 6).
Fig. 5.
Predicted S-normalized stdKt/V minimum targets in men and women based on body size, with the latter expressed in terms of Watson V. This assumes that stdKt/V is being calculated using the fixed-volume Gotch–Leypoldt simplified equation (see text for details).
Fig. 6.
Session (3/week) spKt/V values that would be required to achieve the S-normalized stdKt/V minimum targets shown in Fig. 5. Session length was set as 180 minutes or higher; in the latter case, session length used to calculate stdKt/V corresponded to a dialyzer clearance of 250 ml/minute.
Discussion
Our results describe a method of moving from a V-based system of dialysis dosing, which is required if uremic toxin generation rate were to scale to total body water volume, to one in which the dose of dialysis is normalized to anthropometric body surface area. If this approach were accepted, such an adjustment would obligate a higher dose of dialysis for smaller patients, and an additional across the board increase in dialysis dose for women. Also, it would allow a somewhat reduced dose of dialysis in men.
The practical implications of S-based dosing can be seen in Fig. 5 and Fig. 6, where values from Table 1 and Table 2 are plotted in the form of a nomogram. They show the minimum stdKt/V and 3/week session spKt/V values that would be required. This computation involves at least three assumptions: (i) that KDOQI minimums apply to an average size patient, with a Vwat:Sdub ratio of 20, (ii) that the dialysis dose for patients of other sizes and gender should be equivalent to this normative patient in terms of body surface area, and (iii) that modeled and anthropometric V are identical or at least that the relationships between modeled V and Sdub are similar to those between Vwat and Sdub. The analysis suggests that this method of S-normalization, when applied to a continuous clearance like stdKt/V, would require a 16–19% higher session spKt/V (3/week) for women vs. men of the same anthropometric body surface area as well as higher Kt/V values for smaller patients.
TABLE 2.
Session (3/week) spKt/V values by body size and gender required to achieve values of N shown in Table 1
| Watson V | 25 | 30 | 35 | 40 | 45 |
|---|---|---|---|---|---|
| Men | 1.308 (180)a | 1.219 (180) | 1.151 (180) | 1.097 (180) | 1.044 (188) |
| Women | 1.518 (180) | 1.433 (180) | 1.363 (191) | 1.297 (208) | 1.244 (224) |
Values in parentheses reflect the session length (minutes) used to calculate the stdKt/V.
While the relationship between required session spKt/V and body size and gender shown in Fig. 6 is the consequence of S-adjustment, the actual values of spKt/V depend on the particular Vwat:Sdub normalization factor that is chosen. In the current S-normalization strategy, a Vwat:Sdub ratio of 20 was chosen, close to the average of the median value in men and the median value in women. This resulted in a lower recommended minimal spKt/V in larger men than current KDOQI guidelines. For example, the minimum target stdKt/V for a male with Vwat = 40L is 1.848 /week, with a corresponding spKt/V of 1.1/session when three sessions per week are being given. One could normalize all values to a Vwat:Sdub ratio of 21.4, close to the median value in men. This would increase the stdKt/V minimum targets by 21.4/20 = 1.07, or 7%. This would bring the stdKt/V target for a male with Vwat = 40L up to the more familiar 1.98/week, and spKt/V close to 1.2/session. However, it would also raise the stdKt/V target for a small woman with Vwat = 25L (one can think of this as moving the nomogram curves in Fig. 5 and Fig. 6 to the right), such that an spKt/V value greater than 1.7/session would be required.
Another issue with these proposed minimum targets is the method used to compute standard Kt/V. For the purposes of this paper, we have been using the Gotch–Leypoldt simplified equation as modified by theKDQOI 2006 update (14,15). When using this equation, an spKt/V of 1.2 with a 3/week schedule and a 240 minute session length translates into a stdKt/V of 2.0. For this reason, in the KDOQI clinical practice recommendations, a stdKt/V of at least 2.0 was suggested to guide treatment in patients with residual renal function and when using other than 3/week schedules. Recently, some of us have analyzed the performance of this simplified equation against stdKt/V derived from formal two-pool modeling (where weekly traces of serum urea nitrogen vs. time were generated) and found that it underestimates modeled stdKt/V by about 8%, on average (17). There is a simple fix: multiplying the old stdKt/V by 1/(1 − 0.9 × Qf × t/V), where Qf is the ultrafiltration rate in ml/minute, t is the session length in minutes, and V is the urea distribution volume in ml. Were this new equation to be used, the values of stdKt/V would, on average, increased by 7–8%. With the new formula, for someone in whom Qf × t/V = ~0.08 (for example, 2800 ml of fluid removal in a patient with V = 35,000 ml), the stdKt/V value corresponding to an spKt/V of 1.2 given over 240 minutes 3/week becomes about 2.16 instead of 2.0. So with the new formula, the S-normalized target (N) would also need to be increased proportionately, from = 2.0 × 20 × Sdub/Vwat to = 2.16 × 20 × Sdub/Vwat. The net result would be that the stdKt/V values in Table 1 would all go up by 7–8%, but the spKt/V values in Table 2 would remain largely unchanged.
One issue with any new proposed dialysis standard is to what extent it would be achievable in current practice. Analysis of baseline (prerandomization) modeling sessions in HEMO study patients shows that the amount of therapy delivered would have largely met such a new S-based adequacy standard (normalizing to Vwat: Sdub = 20). This occurred because in practice higher amounts of spKt/V are routinely delivered to women and to small patients. For example, only 7 of 772 male patients were below the proposed S-normalized minimum target (D/N) ratio of 1.0, and in 3 of these, the ratio was above 0.98. An spKt/V of 1.05 or so was sufficient to ensure that the S-normalized target would be consistently met (Fig. 3). In contrast, in the women patients, 107 of 992 patients were below a D/N ratio of 1.0. Admittedly, many of these were very close to 1.0, but from Fig. 4, it is clear that an spKt/V of 1.5 is required to insure that such a new S-normalized target is being consistently met, although a considerable percentage of women with spKt/V in the range of 1.3–1.5 were able to meet the new target as well.
Are there any outcomes data that suggest that women and/or smaller patients may be relatively underdialyzed, to the point that they have a worse outcome? A large, cross-sectional study of the dialysis dose vs. mortality relationship by Owen et al. suggested that there was a gender difference, with dose impacting mortality more strongly in women than in men (2). Lowrie et al. published a number of cross-sectional analyses of dialysis dose vs. mortality, and their conclusions were that Kt/V may be giving too little dialysis to smaller patients (4,5). They also suggested normalizing dialysis dose to body surface area (5).
The NIH HEMO trial compared mortality in patients dialyzed to urea reduction percentages of approximately 63% vs. 75% (corresponding to equilibrated Kt/V values of 1.05 and 1.45). Mortality was similar in the two randomized groups (10) but women randomized to the higher dose of dialysis survived better than those in the lower dose group (3). Subsequent to the release of the data showing a gender effect in the HEMO trial, analysis of the USRDS data revealed a concordant effect—mortality was lower at higher dose in women, but not nearly so much in men (18). So there are data from a randomized trial as well as data from observational studies suggesting that women may benefit from more dialysis than currently recommended doses that are indexed by V.
On the other hand, the data suggesting that women and smaller patients are relatively underdialyzed are not strong or necessarily consistent. The HEMO study analysis by gender is subject to the standard limitations of subgroup analyses in randomized trials, and may have represented a Type I error (i.e., a false-positive result) in the context of several subgroup analyses that were performed for this trial (3). Moreover, in the HEMO analysis by gender cited above, the gender effect of randomized dose could not be linked to any of multiple measures of body size. When the dose effect on outcome was controlled for body size, a gender effect remained, but when controlled for gender, the body size effect was no longer significant (3). Analysis of observational data purporting to show a link between gender or body size and the effect of dose on outcome is fraught with the confounding effects of delivered dose on mortality, the so-called “dose-targeting bias” (19). Analysis of delivered doses in the HEMO trial also showed that dose targeting bias was stronger in women than in men (19),making interpretation of gender effects on dose vs. outcome in cross-sectional studies problematic. Nevertheless, examination of delivered dose in the HEMO study (10) shows that delivered dose in the standard-dose group was close to an spKt/V of 1.3. It is clear from an examination of Fig. 3 and Fig. 4 that, whereas almost all men with an spKt/V of 1.3 would be above the new S-normalized minimum target, most of the women would fall below the R = 1.0 line. Whether this might explain the discrepant results in outcomes between men and women (3) is amatter of conjecture.
Another issue is the question of modeled V vs. anthropometric V. The present analysis makes an assumption that they are equal, whereas experimental data suggest that the modeled urea volume may be only about 85% of the anthropometric total body water estimate (20). This will not affect the relative changes in dialysis dose when moving to a surface-based analysis, as long as the relationships between modeled V:Sdub and Vwat:Sdub are similar and first order. However, this relationship is important if one were to move from a urea-modeled approach (corrected or not for body surface area) to a completely anthropometric approach, where only Kt is measured, and where the only denominator is either anthropometric V or anthropometric S.
Other denominators have been considered. One proposal is to scale GFR, as well as dialysis dose, to the patient’s metabolic rate rather than V or S (6,7,21). When scaling to body surface area, the assumption is that a man and woman of the same height and weight will require the same GFR or Kt. But when scaling to metabolic rate this is no longer true, as men have consistently higher metabolic rates than women of the same body size. So if Kt were scaled to metabolic rate, the gender effect, so prominent with S, would be reduced. Also, physiologically, it may not be likely that metabolism per se requires a higher GFR, especially metabolism of tissues that are simply oxidizing carbohydrates and fats, such as muscle. There is little evidence that activity level substantially affects GFR, an observation not in keeping with an important role of metabolic rate in determining GFR among humans.
Another approach is to scale the dialysis dose to visceral body mass (8), as the latter may best predict the generation rate of uremic toxins, assuming that control of toxin concentrations is the ultimate goal of dialysis. The visceral mass represents a greater portion of the body weight in small patients, and is also a greater portion of the body water in women than in men (8).
One additional, focusing hypothesis might be that the main organ contributing uremic toxins is specifically the liver, as this is where compounds are detoxified and solubilized, and this is a major site of metabolism of nitrogenous compounds. The liver accounts for only about 20% of the resting energy expenditure (22), so scaling dialysis dose to metabolic rate vs. to liver size or functional activity may not be equivalent strategies. One could therefore assume that liver function is related to its size, and to scale dialysis to liver size. Many authors have developed anthropometric equations predicting liver size from body height and weight (23–25). In most of these equations, liver size is simply a function of body surface area and is not gender dependent (23,24), although in one study liver size was gender dependent in patients younger than 50 years of age (25). We did examine the relationship of predicted liver (L)mass (in grams) or volume (in ml) and the ratio of Vwat:L in men vs. women, using the same baseline HEMO data set as described in the Materials and Methods section. The results are presented in Table 3 and are compared with the ratio of Vwat:Sdub. For a comparison of liver size and other alternative rescaling measures, see the accompanying article in this issue (26).
TABLE 3.
Vwat:S and VwatL in baseline HEMO patients and their ratios in men vs. women
| Ratio | Equation | Men (median) | Women (median) | Men/womena |
|---|---|---|---|---|
| VwatSdub | Watson,Dubois | 21.34 | 18.50 | 1.153 |
| VwatL (l/ml) | Heinemann (23) | 0.0244 | 0.0215 | 1.135 |
| VwatL (l/g) | Yoshizumi (24) | 0.0279 | 0.0240 | 1.162 |
| VwatL (l/g) | Chouker (25) | 0.0222 | 0.0189 | 1.175 |
Median ratio inmen divided by the median ratio in women.
It can be seen that in general, the ratio of median values of Vwat:L between men and women, regardless of the equation used, is similar to the gender ratio of the median values of Vwat:Sdub. This means that, for any level of V, a woman will have a larger estimated liver size, as well as a larger body surface area, compared to a similarly sized male. Thus, liver size may be a physiological underpinning explaining why scaling both GFR and dialysis dose to S is a more appropriate strategy than scaling to V.
In summary, the present data identify a practical method of rescaling the dose of dialysis from a system based on urea distribution volume, V, to one based on body surface area. Rescaling to surface area would obligate more dialysis for smaller patients, more dialysis for women, and potentially, less dialysis for larger, male patients. The present analysis can be used as a guide to estimate how much more dialysis might be indicated as a minimum for women and for small patients and might be used to justify slightly less dialysis for larger male patients. However, additional research may be required before the current minimum targets for hemodialysis dosing are revised. Assuring that current standards are sufficient for all major dialysis subpopulations should be a high priority goal for future quality improvement efforts.
References
- 1.Gotch FA. Kinetics of solute removal in hemodialysis. Adv Exp Med Biol. 1987;223:227–237. doi: 10.1007/978-1-4684-5445-1_36. [DOI] [PubMed] [Google Scholar]
- 2.Owen WF, Jr, Chertow GM, Lazarus JM, Lowrie EG. Dose of hemodialysis and survival: differences by race and sex. JAMA. 1998;280:1764–1768. doi: 10.1001/jama.280.20.1764. [DOI] [PubMed] [Google Scholar]
- 3.Depner T, Daugirdas J, Greene T, Allon M, Beck G, Chumlea C, Delmez J, Gotch F, Kusek J, Levin N, Macon E, Milford E, Owen W, Star R, Toto R, Eknoyan G. Hemodialysis Study Group: Dialysis dose and the effect of gender and body size on outcome in the HEMO Study. Kidney Int. 2004;65:1386–1394. doi: 10.1111/j.1523-1755.2004.00519.x. [DOI] [PubMed] [Google Scholar]
- 4.Lowrie EG, Li Z, Ofsthun N, Lazarus JM. Body size, dialysis dose and death risk relationships among hemodialysis patients. Kidney Int. 2002;62:1891–1897. doi: 10.1046/j.1523-1755.2002.00642.x. [DOI] [PubMed] [Google Scholar]
- 5.Lowrie EG, Li Z, Ofsthun N, Lazarus JM. The online measurement of hemodialysis dose (Kt): clinical outcome as a function of body surface area. Kidney Int. 2005;68:1344–1354. doi: 10.1111/j.1523-1755.2005.00533.x. [DOI] [PubMed] [Google Scholar]
- 6.Singer MA. Of mice and men and elephants: metabolic rate sets glomerular filtration rate. Am J Kidney Dis. 2001;37:164–178. doi: 10.1016/s0272-6386(01)80073-1. [DOI] [PubMed] [Google Scholar]
- 7.McKnab BK. Water and Salt Exchange in Terrestrial Vetebrates. Ithaca, NY: Cornell University Press; 2002. The Physiological Ecology of Vertebrates: A View from Energetics Chapter 7; p. 205. [Google Scholar]
- 8.Sarkar SR, Kuhlmann MK, Kotanko P, Zhu F, Heymsfield SB, Wang J, Meisels IS, Gotch FA, Kaysen GA, Levin NW. Metabolic consequences of body size and body composition in hemodialysis patients. Kidney Int. 2006;70:1832–1839. doi: 10.1038/sj.ki.5001895. [DOI] [PubMed] [Google Scholar]
- 9.Daugirdas JT, Meyer KH, Greene T, Poggio E. Scaling of iothalamate GFR in kidney donor candidates by anthropometric estimates of body surface area,metabolic rate, or body water: Gender equivalence when scaling to body surface area, but not to the others. ASN Abstr. 2008 (in press) [Google Scholar]
- 10.Eknoyan G, Beck GJ, Cheung AK, Daugirdas JT, Greene T, Kusek JW, Allon M, Bailey J, Delmez JA, Depner TA, Dwyer JT, Levey AS, Levin NW, Milford E, Ornt DB, Rocco MV, Schulman G, Schwab SJ, Teehan BP, Toto R. Hemodialysis (HEMO) Study Group: Effect of dialysis dose and membrane flux in maintenance hemodialysis. N Engl J Med. 2002;347:2010–2019. doi: 10.1056/NEJMoa021583. [DOI] [PubMed] [Google Scholar]
- 11.Dubois D, Dubois EF. A formula to estimate the approximate surface area if height and weight be known. Arch Intern Med. 1916;17:863–871. [Google Scholar]
- 12.Watson PE, Watson ID, Batt RD. Total body water volumes for adult males and females estimated from simple anthropometric measurements. Am J Clin Nutr. 1980;33:27–39. doi: 10.1093/ajcn/33.1.27. [DOI] [PubMed] [Google Scholar]
- 13.Fuller W. Measurement Error Models. Section 1.3: Ratio of Measurement Variances Known. New York: Wiley; 1987. pp. 30–49. [Google Scholar]
- 14.Leypoldt JK, Jaber BL, Zimmerman DL. Predicting treatment dose for novel therapies using urea standard Kt/V. Semin Dial. 2004;17:142–145. doi: 10.1111/j.0894-0959.2004.17212.x. [DOI] [PubMed] [Google Scholar]
- 15.Hemodialysis Adequacy 2006 Work Group. Clinical practice guidelines for hemodialysis adequacy, update 2006. Am J Kidney Dis. 2006;48 Suppl. 1:S2–S90. doi: 10.1053/j.ajkd.2006.03.051. [DOI] [PubMed] [Google Scholar]
- 16.Tattersall JE, DeTakats D, Chamney P, Greenwood RN, Farrington K. The post-hemodialysis rebound: predicting and quantifying its effect on Kt/V. Kidney Int. 1996;50:2094–2012. doi: 10.1038/ki.1996.534. [DOI] [PubMed] [Google Scholar]
- 17.Depner TA, Daugirdas JT, Greene T, Schulman G. for the FHN Trial Network: Improved simplified formula for estimating hemodialysis standard Kt/V-urea. ASN Abstr. 2008 (in press) [Google Scholar]
- 18.Port FK, Wolfe RA, Hulbert-Shearon TE, McCullough KP, Ashby VB, Held PJ. High dialysis dose is associated with lower mortality among women but not among men. Am J Kidney Dis. 2004;43:1014–1023. doi: 10.1053/j.ajkd.2004.02.014. [DOI] [PubMed] [Google Scholar]
- 19.Greene T, Daugirdas J, Depner T, Allon M, Beck G, Chumlea C, Delmez J, Gotch F, Kusek JW, Levin N, Owen W, Schulman G, Star R, Toto R, Eknoyan G. Hemodialysis Study Group: Association of achieved dialysis dose with mortality in the hemodialysis study: an example of “dose-targeting bias”. J Am Soc Nephrol. 2005;16:3371–3380. doi: 10.1681/ASN.2005030321. [DOI] [PubMed] [Google Scholar]
- 20.Daugirdas JT, Greene T, Depner TA, Chumlea C, Rocco MJ, Chertow GM. Hemodialysis (HEMO) Study Group: Anthropometrically estimated total body water volumes are larger than modeled urea volume in chronic hemodialysis patients: effects of age, race, and gender. Kidney Int. 2003;64:1108–1119. doi: 10.1046/j.1523-1755.2003.00179.x. [DOI] [PubMed] [Google Scholar]
- 21.Morton AR, Singer MA. The problem with Kt/V: dialysis dose should be normalized to metabolic rate not volume. Semin Dial. 2007;20:12–15. doi: 10.1111/j.1525-139X.2007.00232.x. [DOI] [PubMed] [Google Scholar]
- 22.Gallagher D, Belmonte D, Deurenberg P, Wang Z, Krasnow N, Pi-Sunyer FX, Heymsfield SB. Organ-tissue mass measurement allows modeling of REE and metabolically active tissue mass. Am J Physiol. 1998;275(2 Pt 1):E249–E258. doi: 10.1152/ajpendo.1998.275.2.E249. [DOI] [PubMed] [Google Scholar]
- 23.Heinemann A, Wischhusen F, Pϋschel K, Rogiers X. Standard liver volume in the Caucasian population. Liver Transpl Surg. 1999;5:366–368. doi: 10.1002/lt.500050516. [DOI] [PubMed] [Google Scholar]
- 24.Yoshizumi T, Gondolesi GE, Bodian CA, Jeon H, Schwartz ME, Fishbein TM, Miller CM, Emre S. A simple new formula to assess liver weight. Transplant Proc. 2003;35:1415–1420. doi: 10.1016/s0041-1345(03)00482-2. [DOI] [PubMed] [Google Scholar]
- 25.Choukèr A, Martignoni A, Dugas M, Eisenmenger W, Schauer R, Kaufmann I, Schelling G, Löhe F, Jauch KW, Peter K, Thiel M. Estimation of liver size for liver transplantation: the impact of age and gender. Liver Transpl. 2004;10:678–685. doi: 10.1002/lt.20113. [DOI] [PubMed] [Google Scholar]
- 26.Daugirdas JT, Levin NW, Kotanko P, Depner TA, Kuhlmann MK, Chertow GM, Rocco MV. Comparison of proposed alternative methods for rescaling dialysis dose: Resting energy expenditure, high metabolic rate organ mass, liver size, and body surface area. Semin Dial. 2008:377–384. doi: 10.1111/j.1525-139X.2008.00483.x. [DOI] [PMC free article] [PubMed] [Google Scholar]


