Abstract
Adiabatic pulses are useful in achieving uniform excitation profiles in the presence of B1 inhomogeneity. At higher fields, this inhomogeneity becomes more severe, further amplifying the need for B1-insensitive excitation. Although gradient modulation techniques for slice-selective adiabatic excitation have been introduced, a pulse that falls within the gradient and RF amplifier limits for most commercial human scanners is currently unavailable. In this work, we present an alternative gradient modulated approach for pulse design that achieves adiabatic slice selection with significantly lower RF peak power requirements. The resulting Slice-selective Tunable-flip AdiaBatic Low peak-power Excitation (STABLE) pulse consists of an oscillating gradient in conjunction with a BIR-4-like RF envelope that is sampled by many short spatial subpulses to achieve spatial selectivity. Simulations show that the expected spatial profile as well as the off-resonance behavior of the pulse remain invariant for a range of B1 values. Phantom and in vivo results demonstrate the adiabaticity and slice selectivity of the STABLE pulse.
Keywords: slice-selective, adiabatic, excitation, brain, high field
2 Introduction
MRI at high magnetic fields offers the advantage of increased SNR but suffers from signal losses due to increased B1 inhomogeneity. Adiabatic pulses, particularly 180° slice selective inversion and refocusing pulses [1], may be used instead of standard windowed sinc pulses to provide some immunity to B1 variations. BIR-4 pulses [2,3] have been shown to achieve adiabatic excitation with user-selectable flip angles. However, these pulses are neither spatially nor spectrally selective.
The BIR-4 pulse design has been extended through the use of gradient modulation techniques to create slice-selective adiabatic excitation pulses. Examples include GMAX [4], BISS-8 [5] and SLAB-4 [6]. Unfortunately, these techniques require high RF amplitude, typically above the maximum output of the RF amplifiers available on most available commercial human scanners. They also require a high gradient strength and slew rate. This limits their utility to applications such as MR microscopy, animal experiments, and human studies using small surface transmit RF coils [5, 6]. In this work, we have developed an alternative gradient modulated approach that achieves adiabatic slice selection with significantly lower RF peak power requirements. Our Slice-selective Tunable-flip AdiaBatic Low peak-power Excitation (STABLE) pulse consists of an oscillating gradient in conjunction with a BIR-4-like RF envelope that is sampled by many short spatial subpulses in order to achieve spatial selectivity. These adiabatic pulses can be designed to achieve an arbitrary flip angle. The theory and design of the pulses is similar to that of conventional, non-adiabatic, spatial-spectral pulses. However, STABLE pulses are only spatially selective. The peak RF amplitude required to achieve adiabaticity for these pulses is well within the capabilities of our system’s RF coil/amplifier combination, which is 17 μT. In addition to adiabaticity, greater immunity to chemical shift localization error results due to the high spatial bandwidth of the short subpulses used for spatial selectivity.
3 Methods
3.1 Pulse Design
First, an adiabatic excitation pulse similar to the BIR-4 [2] pulse was designed. As in the conventional BIR-4 design, the pulse was made up of four adiabatic half-passage segments, with the first and the third segment being time-reversed. In contrast to the BIR-4 design, a sech/tanh amplitude/frequency modulation function was used instead of the usual tanh/tan modulation function so that the amplitude variations were sufficiently slow to be accurately sampled by a reasonable number of subpulses. The equations for the amplitude and frequency modulation functions for the pulse are:
| (1) |
| (2) |
where Ω(t) is the amplitude modulation function, Δω(t) is the frequency modulation function, Ω0 is the maximum B1 field, β is the modulation angular frequency, μ is a dimensionless parameter that determines the spectral bandwidth, and Tp is the pulse duration.
A β value of 280 rad/s and μ of 3.4 were chosen to minimize pulse duration, and therefore echo time, and achieve good off-resonance behavior while maintaining adiabaticity. A phase discontinuity was introduced between the first and second segments and between the third and fourth segments to produce the desired flip angle, which is 90° for this particular design. The final adiabatic spectral excitation pulse was 21 ms long and had a spectral bandwidth, or off-resonance immunity, of approximately 80 Hz. The spectral pulse was then subsampled with the number of sublobes chosen as a trade-off between adiabaticity and minimum slice thickness. Given a fixed pulse duration, if the pulse is sampled too finely, the subpulse duration is too short to cover the gradient area required for thinner slices. If the pulse is sampled too coarsely, the spectral profile for the BIR-4 spectral envelope degrades. Course sampling also results in spatial subpulses with larger flip angles that are more easily overdriven, yielding a spatial profile that is less B1-immune.
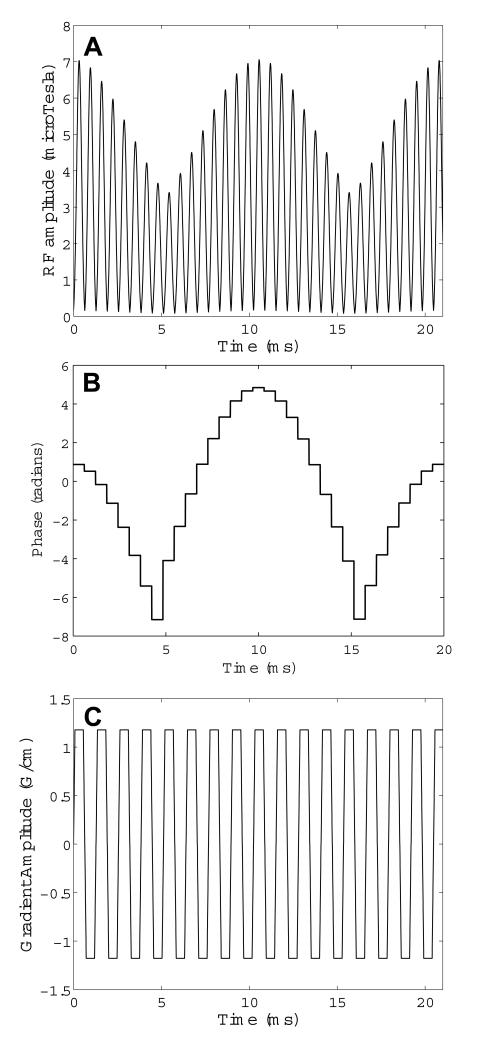
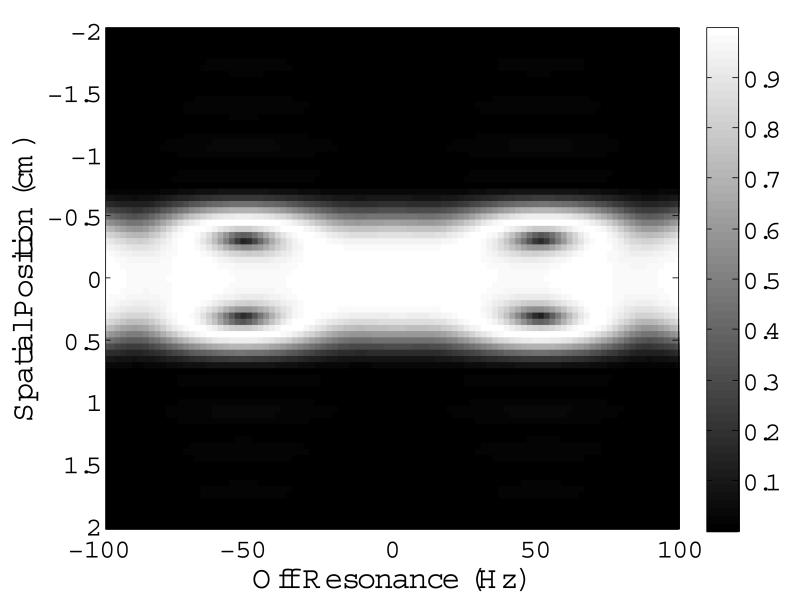
The final STABLE pulse was comprised of 33, 0.64 ms-long, conventional small tip-angle subpulses scaled by the sampled values of the adiabatic envelope given in Eqns. 1 and 2. The subpulses were a least squares Fourier design with a time-bandwidth product of 2.75 generated using the firls function in MATLAB (The Mathworks, Natick, MA, USA). The resulting spatial bandwidth was 4300 Hz. Figures 1 A & B show the magnitude and phase of the final STABLE 90° RF pulse. The pulse is played in conjunction with the oscillating gradient waveform shown in Fig. 1 C. Figure 2 is the simulated 2D spatial-spectral excitation profile for the pulse, showing the slice profile at a range of off-resonant frequencies. The slice profile remains constant for a ±40 Hz shift in resonant frequency.
Figure 1.
(A) Magnitude and (B) phase of the 21 ms STABLE pulse. The peak B1 value of the pulse is well below the 17 μT limit of our 3T RF coil/amplifier combination. The accompanying gradient waveform is shown in (C).
Figure 2.
Spatial excitation profile at a range of off-resonant frequencies. The spatial profile is invariant over a 80 Hz range in off-resonance. Immunity to off-resonance may be traded off for overdrive factor.
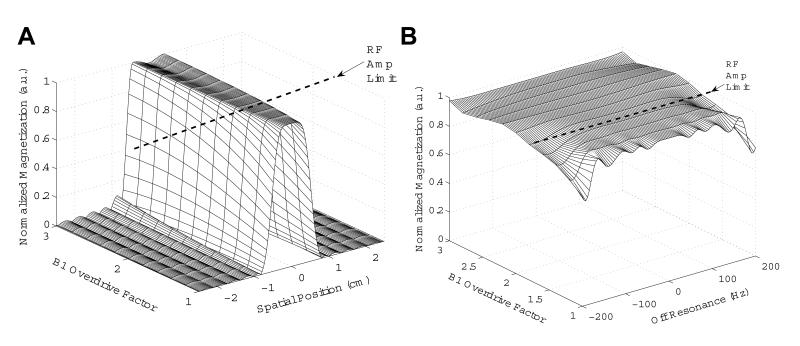
The adiabaticity of spatial and spectral excitation profiles of the pulse were first verified through simulations. In Fig. 3 A, the simulated spatial profile is shown for a range of B1 overdrive factors above adiabatic threshold. If the nominal B1 is set to be at the adiabatic threshold, the pulse may be overdriven by 67% (overdrive factor of 1.67) before reaching RF peak amplitude limit of 17 μT for our 3T RF coil/amplifier combination. An increase in stop band ripple as well as some signal loss at the center of the spatial passband at higher overdrive factors is noticeable in Fig. 3 A. However, the spatial profile is still fairly stable for the B1 range at which we plan to operate, which is at overdrive factors below 1.67. Figure 3 B shows the spectral profile of the pulse over the same range of B1 overdrive factors. Close to 100% excitation is achieved for resonances within a 80 Hz spectral bandwidth, even at very high B1 overdrive factors.
Figure 3.
Simulated excitation profiles for the STABLE pulse. (A) Spatial profile and (B) spectral profile (i.e. off-resonance behavior) versus B1 overdrive factor. Nominal B1 for these simulations is set at the adiabatic threshold. Pulses may be overdriven by 67% before reaching the 17 μT peak B1 limit for our RF amplifier; however, the pulses maintain adiabaticity beyond this limit.
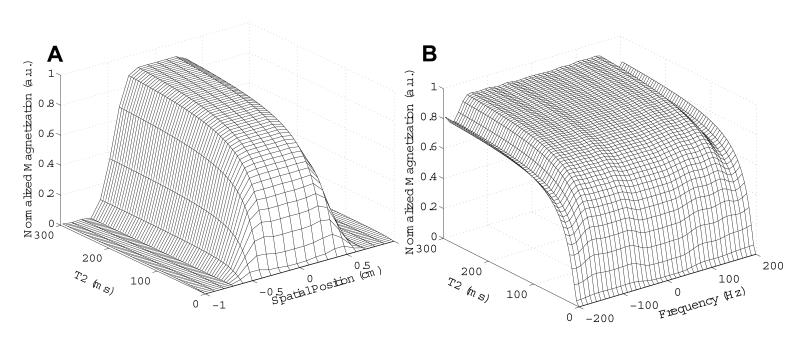
In order to determine the behavior of the STABLE pulse when exciting spins with short relaxation times, the pulse excitation profiles were simulated for a range of T2 values. The results are shown in Fig. 4 A and B for the spatial and spectral (i.e. off-resonance) profiles respectively. Signal loss at the center of the selected slice begins to occur at T2 values less than 15 ms.
Figure 4.
Simulated excitation profiles for a STABLE pulse with Tp = 21 ms and Ω0 = 12 μT, for a range of T2 values. (A) Spatial profile and (B) spectral profile (i.e. off-resonance behavior) versus T2. Degradation of the selected slice occurs for T2 values less than 15 ms.
Specific Absorption Rate (SAR) was calculated for the STABLE pulse and compared to a conventional windowed sinc pulse with the same spatial bandwidth as well as a BIR-4 pulse with the same spectral bandwidth. SAR for the STABLE pulse was 5 times the SAR of the conventional sinc pulse and 1.27 times the SAR for the BIR-4 pulse.
3.2 Final Pulse Sequence
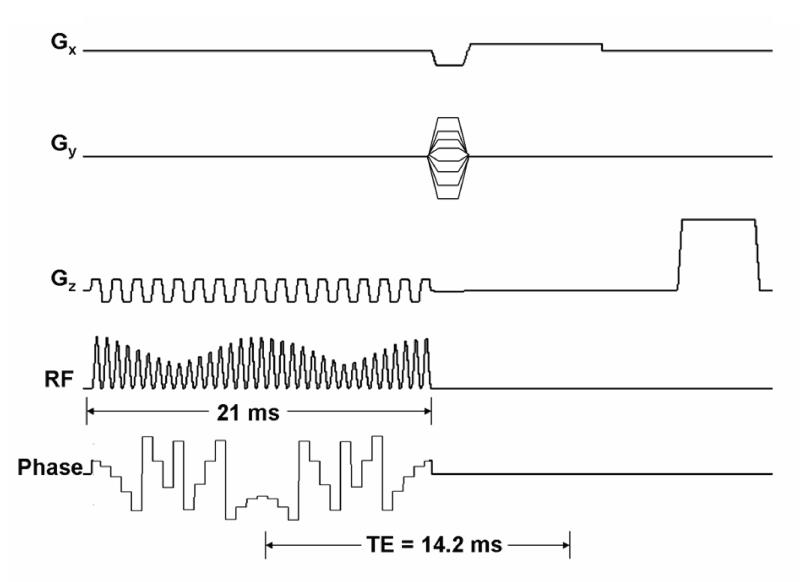
The STABLE pulse was integrated into a Gradient Recalled Echo (GRE) sequence to compare it to a standard GRE sequence with a conventional Hamming-windowed sinc (here-onafter referred to as sinc) excitation pulse. Figure 5 shows the RF amplitude, phase and gradient waveforms for the GRE sequence which uses the STABLE pulse for excitation. With the 21 ms STABLE pulse, a 1.7 ms phase encode and 4 ms readout duration, a minimum echo time (TE) of 14.2 ms can be achieved. Due to the spin-locked state of the magnetization for the duration of the STABLE pulse, instead of pure T2 decay, the signal decay occurs by a combination of longitudinal and transverse relaxation in the rotating frame. A magnetization vector that is rotating perpendicular to the effective field of an adiabatic pulse, undergoes T2ρ relaxation [7]. During a BIR-4 pulse, the magnetization vector remains mainly perpendicular to the e ective field; therefore, relaxation during the STABLE pulse will be mainly due to T2ρ. Also, T2* decay begins at the end of the pulse instead of the midpoint. Hence, the TE value is not exactly analogous to the TE for a conventional GRE sequence, during which both pure T2 decay and T2* decay occur. As a result, The e ective TE for the sequence in Fig. 5 is actually much shorter than 14.2 ms due to the slower effective decay of the magnetization.
Figure 5.
RF amplitude, phase and gradient waveforms for a GRE sequence using a STABLE pulse for excitation. The waveform for phase is wrapped. For a 21 ms pulse, an echo time of 14.2 ms can be achieved.
3.3 Phantom and In Vivo Experiments
Data was obtained from a spherical agar phantom scanned with a standard birdcage head coil at 3T (Echospeed whole-body magnet; GE Healthcare, Waukesha, WI, USA). A 5 mm slice was excited with the STABLE pulse using the sequence in Fig. 5 and compared to a conventional sinc pulse in a GRE sequence. Acquisition parameters were: TE/TR = 14.2/500 ms and matrix size = 256×256. Several such images were obtained with the STABLE pulse scaled to a range of B1 values. The experiment was repeated for the conventional sinc pulse. B1 scaling was performed by varying the pulse amplitude to a percentage of the nominal B1 value, in increments of 10%. The nominal B1 value was the value set during prescan at which the maximum signal was received from the entire excited slice. Variation in the image cross section was compared.
In order to test slice selectivity, several through-plane images of the spherical phantom were obtained by changing the readout gradient to the slice-select dimension. Acquisition parameters remained the same (i.e. slice thickness = 5 mm, TE/TR = 14.2/500 ms and matrix size = 256×256). Cross sections of images obtained using the STABLE GRE sequence as well as a conventional GRE sequence were obtained for a range of B1 values, so that slice profile degradation as B1 was overdriven could be compared.
In vivo data was obtained from the brain of a normal volunteer scanned at 3T (Echospeed whole-body magnet; GE Healthcare, Waukesha, WI, USA) with a standard birdcage head coil. As in the case of the phantom experiments, several images were obtained using the STABLE pulse as well as a conventional sinc scaled to a range of B1 values and image cross sections were compared. Acquisition parameters were: slice thickness = 5 mm, TE/TR=14.2/1000 ms and matrix size = 256×256.
4 Results
4.1 Phantom Results
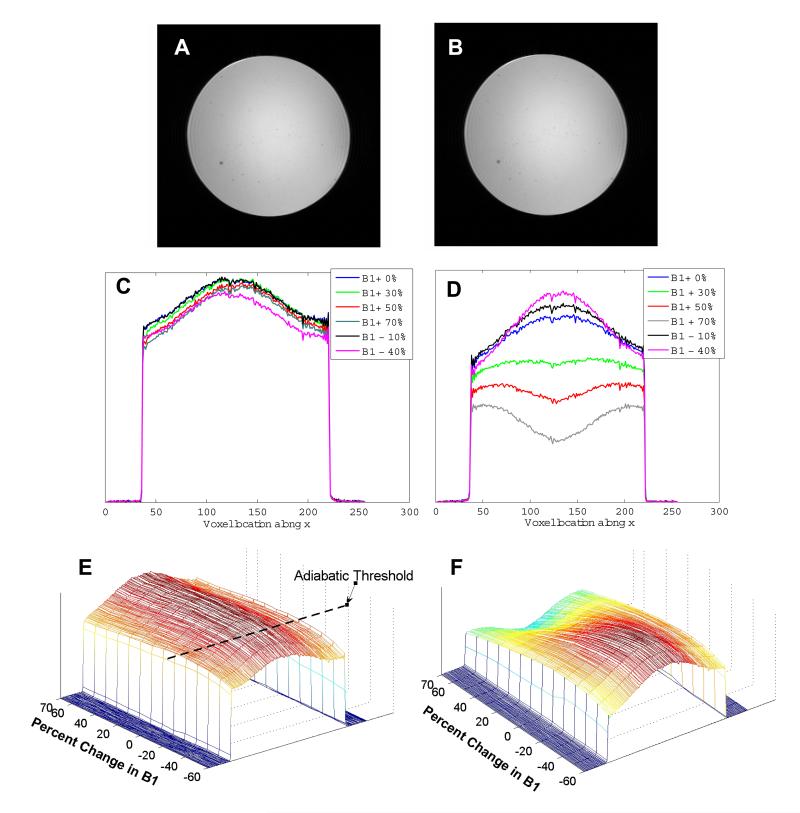
Figure 6 shows an in-plane image from a spherical agar phantom scanned at 3T obtained using (A) the STABLE pulse and (B) a conventional sinc pulse. A GRE sequence was used to excite and image a 5 mm slice. Several such images were obtained with the STABLE pulse scaled from +70% to -60% of the nominal RF pulse amplitude. Figure 6 C shows the plots of a few chosen central horizontal cross sections through the phantom. The adiabatic threshold is reached at around 40% below nominal peak B1. Above the adiabatic threshold, the excited cross section remains largely invariant. The same experiment conducted using a standard GRE sequence with a conventional sinc pulse yielded the result in Fig. 6 D, demonstrating that scaling the RF causes significant variation in the image cross-sections. All obtained cross sections are plotted against B1 value and shown in the form of mesh plots in Fig. 6 E and F for the STABLE and sinc pulse respectively.
Figure 6.
Results obtained from a spherical agar phantom using a standard birdcage head coil at 3T. In-plane image obtained with a GRE sequence using (A) a STABLE pulse and (B) a Hamming-windowed sinc pulse for excitation. Acquisition parameters were: TE/TR=14.2/500 ms, slice thickness=5 mm and matrix size=256×256. Chosen horizontal cross sections of several such images obtained with (C) the STABLE pulse and (D) the sinc pulse scaled to a range of peak B1 values. The cross-section obtained with a sinc excitation pulse varies significantly as the B1 is scaled, 20 while the cross-section obtained with the STABLE pulse stays largely invariant after adiabatic threshold is reached. Mesh plots, (E and F) showing all cross sections obtained vs. peak B1 for the STABLE and conventional sinc pulse respectively.
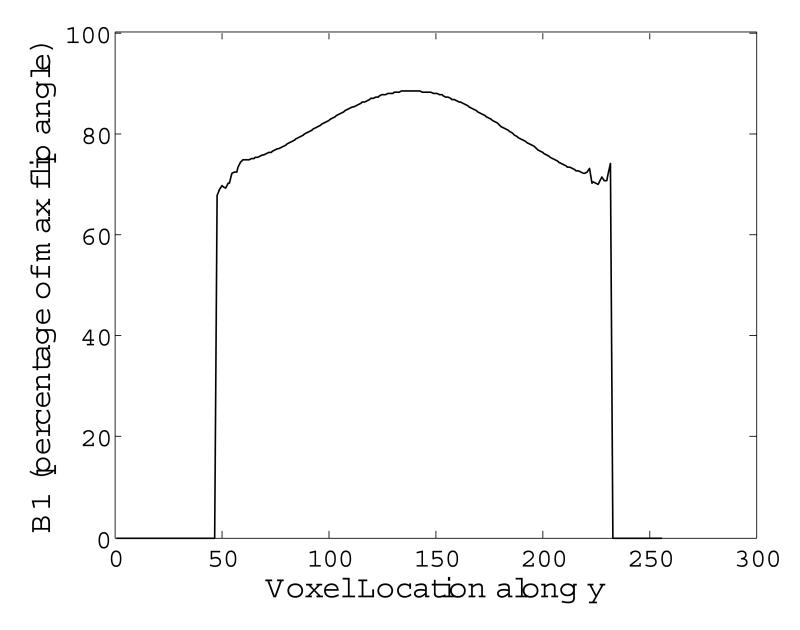
The cross sections in Fig. 6 C are not flat due to image shading caused by the receive B1 profile. Figure 7 shows the cross section of the receive B1 profile for the head coil used. Images obtained from both STABLE and sinc pulses are attenuated by this profile. Because adiabatic pulses can only reduce transmit B1 inhomogeneity, image shading due to the receiver B1 profile is still present.
Figure 7.
Horizontal cross section of the B1 receive profile measured for the spherical agar phantom used in our experiments. Although images obtained using the STABLE pulse benefit from a uniform transmit profile, they are still susceptible to shading due to the B1 receive profile. Consequently the horizontal cross-section of images obtained using the STABLE pulse follow the shape of the B1 receive profile.
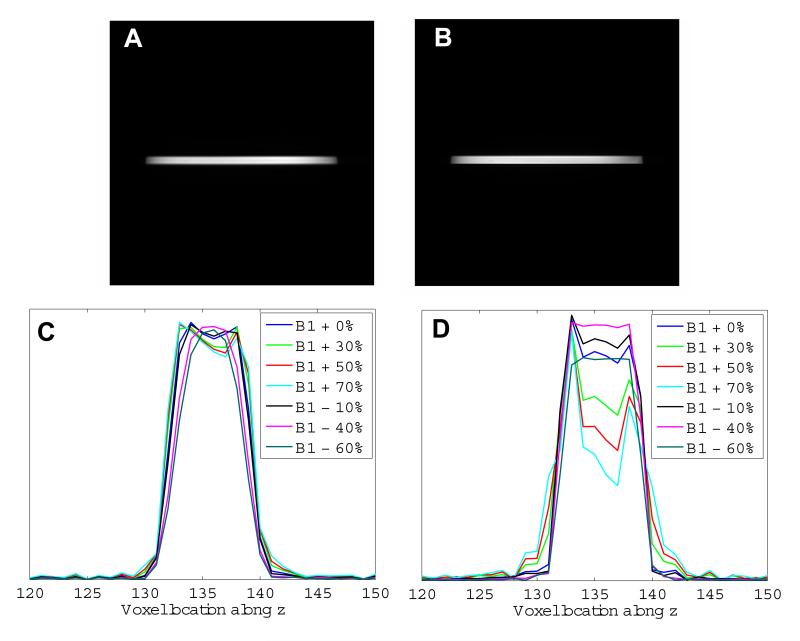
Figure 8 shows the selected slice obtained from through-plane images of the spherical agar phantom acquired using (A) the STABLE pulse and (B) a conventional sinc pulse in a GRE sequence. As in the in-plane case, several images were obtained with the STABLE pulse scaled from +70% to -60% of the nominal RF pulse magnitude. See Fig. 8 C for plots of the central vertical cross sections of these images, showing the slice profile achieved by the spatial subpulses of the STABLE pulse. Some degradation of the slice profile occurs at larger B1 values due to higher flip-angle subpulses becoming slightly overdriven. However, the effect is much less than that seen in Fig. 8 D for slice profiles of a sinc pulse that is identically scaled.
Figure 8.
Slice selection for a spherical agar phantom using a standard birdcage head coil at 3T. Image of selected slice, obtained with a GRE sequence using (A) the STABLE pulse and (B) a conventional Hamming-windowed sinc pulse for excitation. Acquisition parameters were: TE/TR=14.2/500 ms, slice thickness=5 mm and matrix size=256×256. Vertical cross section of several such images, showing the slice profile, obtained using (C) the STABLE pulse and (D) the conventional sinc pulse, both scaled from +70% to -60% of their nominal B1 value. Variation in slice profile is much more severe for the sinc than the STABLE pulse.
4.2 In Vivo Results
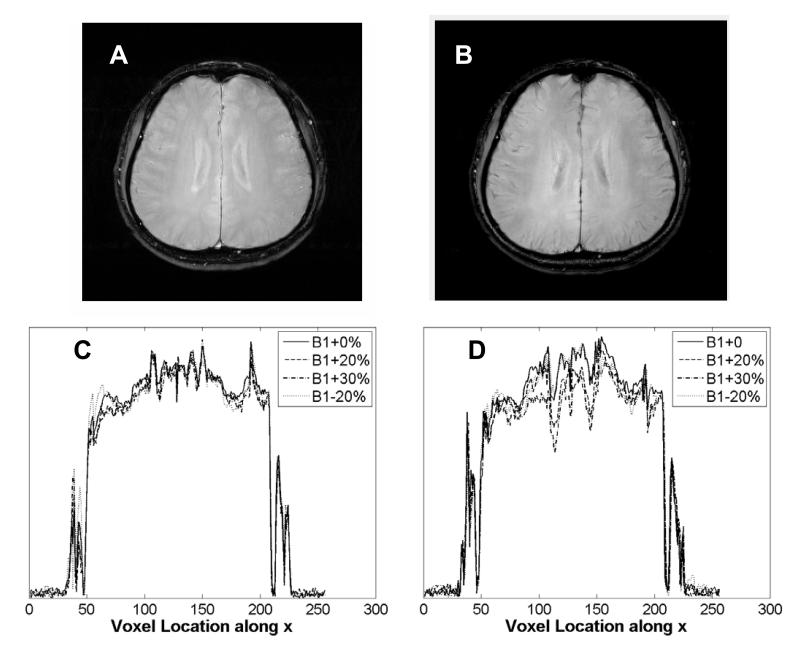
Refer to Fig. 9 for in vivo data from the brain of a normal volunteer scanned at 3T. Figure 9 A shows an image obtained using the STABLE pulse in a GRE sequence to excite and image a 5 mm slice. Several such images were obtained with the STABLE pulse scaled from -20% to +30% of the nominal RF pulse magnitude. Figure 9 C shows the plots of the central horizontal cross sections of these images, demonstrating minimal variation of the cross-sectional profile as B1 is varied. Of the variation that does occur, some portion may be attributed to patient motion between scans. The same experiment was conducted using a standard GRE sequence utilizing a sinc pulse with the same sequence parameters. Figure 9 B shows the image obtained with the sinc pulse and Fig. 9 D shows the horizontal cross-sections when B1 is varied. Variations with B1 scaling are evident in the images generated using the sinc pulse.
Figure 9.
In vivo data from normal volunteer obtained using a standard birdcage head coil at 3T. Image obtained using (A) a GRE sequence with the STABLE excitation pulse and (B) a standard GRE sequence with a conventional Hamming-windowed sinc excitation pulse. Acquisition parameters were: TE/TR=14.2/1000 ms, slice thickness=5 mm and matrix size=256×256. Horizontal cross sections across several such images obtained with (C) the STABLE pulse and (D) the sinc pulse scaled from -20% to +30% of their nominal B1 value, in increments of 10%. Cross-sections of the STABLE GRE images remain mostly invariant as B1 is scaled. Some variation can be attributed to patient motion between scans.
5 Discussion
Phantom and in vivo data demonstrate that the STABLE pulse is slice-selective as well as adiabatic over at least a 50% change in B1 while remaining within the 17μT limit of our 3T RF coil/amplifier setup. B1 variation across the adult human head has been reported as 23% at 4T and 42% at 7T [8]. Thus, given the range of B1 immunity offered, the STABLE pulse may also be useful at these fields. The pulse used to obtain the phantom and in vivo data in Figs. 6, 8 and 9 was designed to achieve a 90° flip angle, however, STABLE pulses may be designed to achieve arbitrary flip angles simply by adjusting the phase discontinuity introduced between the pulse segments.
When comparing Fig. 9 A and B, contrast in some regions of the brain is noticeably di erent. Contrast between gray and white matter seems to be slightly enhanced for the STABLE pulse versus the sinc, especially at the periphery of the brain. Several different factors may be contributing to the unique contrast achieved by the STABLE pulse. First, the magnetization vector is mainly spin-locked perpendicular to the e ective field for the duration of the STABLE pulse. The magnetization vector in this state undergoes T2ρ relaxation. T2ρ contrast has been observed in the brain and was found to be dominated by dynamic averaging (e.g., exchange and di usion between different magnetic sites), with only a small contribution from dipole-dipole interactions [9]. T2ρ has been found to be generally 50% greater than T2 throughout the brain, resulting in overall improved T2-like contrast in T2-weighted images [10]. The slightly enhanced gray-white contrast in the in vivo images acquired using the STABLE pulse, may be the result of this e ect. Second, since readout occurs close to the end of the STABLE pulse in our sequence (Fig. 5), reduced T2* decay may also affect the contrast. In Fig. 9 A, T2* decay begins at the midpoint of the sinc pulse and continues for the duration of TE (14.2 ms) until readout. In contrast, in Fig. 9 B, T2* decay begins at the end of the STABLE pulse. The spin-locked state of the magnetization for the duration of the pulse results in the suppression of T2* decay. Thus, in this case, T2* decay continues for only 3.2 ms. Third, substances that experience motion, such as cerebrospinal fluid (CSF), may behave di erently if they are spin-locked for a large portion of TE, as is the case for the sequence in Fig. 5. This may explain the slightly brighter CSF signal in Fig. 9 A when compared to Fig. 9 B. Lastly, some of the enhanced signal observed at the periphery of the brain may be due to the flatter transmit B1 profile of the STABLE pulse resulting in less apodization of the image.
The 21 ms STABLE pulse designed in this study is robust to a ±40 Hz center frequency shift due to B0 inhomogeneity. When comparing Figs. 9 A and B, no additional artifacts due to B0 shifts are apparent for the image acquired with the STABLE pulse, indicating su cient off-resonance immunity at 3T. However at higher fields such as 7T, a STABLE pulse with a greater spectral bandwith may be required to remain immune to B0 inhomogeneity, which scales with field. This can be achieved by increasing the μ or β values in Eqns. 1 and 2. However, for the same RF peak amplitude, this will require an increased pulse length in order to prevent discontinuities at the margins of the the RF envelope due to truncation. As the total pulse length increases, it is possible to use more subpulses (subpulse duration is unchanged), resulting in a more accurate estimate of the spectral envelope and consequently smoother off-resonance profile. Longer pulses result in longer echo times, however, since the transverse relaxation of the magnetization during the pulse is due mainly to T2ρ, which is larger than T2, slower decay of magnetization can be expected, easing the requirement for a short pulse duration.
Figure 3 shows that the spatial and spectral profiles for the STABLE pulse are invariant for B1 values well beyond 17 μT. When a small surface coil is used instead of a volume coil, RF amplitudes in excess of 50 μT may be possible. The current version of the STABLE pulse would provide robust abiabaticity when overdriven to this value. However, the increased RF peak amplitude allows the option of retaining the same range of adiabaticity, while increasing the spectral bandwidth of the pulse by increasing the value in Eqns. 1 and 2. This would result in a higher adiabatic threshold (which would now be tolerable due to the increased peak RF amplitude) as well as increased off-resonance immunity. In general, increased available B1 leads to more flexibility when designing the STABLE pulse, as long as SAR limits are not exceeded.
Future work is focused on finding the optimal amplitude and frequency modulation functions for the STABLE adiabatic envelope so that sampling errors may be minimized. Further analysis is also required to understand the specific type of contrast achieved by the STABLE pulse.
6 Conclusions
We have designed and tested a slice-selective adiabatic excitation pulse that falls below RF amplitude and gradient limits on most human scanners. Phantom and in vivo results show slice-selectivity as well as immunity to B1 variation. The pulse may be useful for many high field imaging applications.
Acknowledgments
This work was supported by NIH-RR09784 and The Lucas Foundation.
References
- [1].Silver MS, Joseph RI, Hoult DI. Selective spin inversion in nuclear magnetic resonance and coherent optics through an exact solution of the Bloch-Riccati equation. Phys Rev A. 1985;31(4):2753–2755. doi: 10.1103/physreva.31.2753. [DOI] [PubMed] [Google Scholar]
- [2].Staewen RS, Johnson AJ, Ross BD, Parrish T, Merkle H, Garwood M. 3-d flash imaging using a single surface coil and a new adiabatic pulse, bir-4. Invest Radiol. 1990;25:559–567. doi: 10.1097/00004424-199005000-00015. [DOI] [PubMed] [Google Scholar]
- [3].Garwood M, Ke Y. Symmetric pulses to induce arbitrary flip angles with compensation for RF inhomogeneity and resonance offsets. J Magn Reson. 1991;94:511–525. [Google Scholar]
- [4].Johnson J, Garwood M, Ugurbil K. Slice selection with gradient modulated adiabatic excitation despite the presence of large B1 inhomogeneities. J Magn Reson. 1989;81:653–660. [Google Scholar]
- [5].de Graaf RA, Nicolay K, Garwood M. Single-shot, B1-insensitive slice selection with a gradient-modulated adiabatic pulse, BISS-8. Magn Reson Med. 1996;35:652–657. doi: 10.1002/mrm.1910350505. [DOI] [PubMed] [Google Scholar]
- [6].Hsu EW, Reeder SB, MacFall JR. Single-shot, variable flip-angle slice-selective excitation with four gradient-modulated adiabatic half-passage segments. Magn Reson Med. 1998;40(2):334–340. doi: 10.1002/mrm.1910400220. [DOI] [PubMed] [Google Scholar]
- [7].Michaeli S, Sorce DJ, Idiyatullin D, Ugurbil K, Garwood M. Transverse relaxation in the rotating frame induced by chemical exchange. J Magn Reson. 2004;169(2):293–299. doi: 10.1016/j.jmr.2004.05.010. [DOI] [PubMed] [Google Scholar]
- [8].Vaughan JT, Garwood M, Collins CM, Liu W, DelaBarre L, Adriany G, Andersen P, Merkle H, Goebel R, Smith MB, Ugurbil K. 7T vs. 4T: RF power, homogeneity, and signal-to-noise comparison in head images. Magn Reson Med. 2001;46(1):24–30. doi: 10.1002/mrm.1156. [DOI] [PubMed] [Google Scholar]
- [9].Michaeli S, Grohn H, Grohn O, Sorce DJ, Kauppinen R, Springer CS, Jr, Ugurbil K, Garwood M. Exchange-influenced T2ρ contrast in human brain images measured with adiabatic radio frequency pulses. Magn Reson Med. 2005;53(4):823–829. doi: 10.1002/mrm.20428. [DOI] [PubMed] [Google Scholar]
- [10].Wheaton AJ, Borthakur A, Corbo MT, Moonis G, Melhem E, Reddy R. T2ρ-weighted contrast in MR images of the human brain. Magn Reson Med. 2004;52(6):1223–1227. doi: 10.1002/mrm.20284. [DOI] [PubMed] [Google Scholar]


