Abstract
Non-removable navel jewelry can increase the measured bone density of the underlying vertebra. We measured lumbar spine bone mineral density (BMD) by dual energy xray absorptiometry (DXA) in an observational study of 727 adolescents and young women aged 14-30yrs. We evaluated several methods of correcting BMD: manually erasing a small area, eliminating one or two vertebrae, estimating the BMD from one or two vertebrae using data from remaining vertebrae, and estimating the BMD using T-scores of the remaining vertebrae. Ten percent (n=71) of the subjects were wearing navel jewelry. The areal BMD by DXA of L1 and L2 was similar in those with jewels as in controls without jewels, but L3-L4 showed higher bone density in those with jewelry, and the spine BMD of L1-4 was significantly higher in the bejeweled women (1.043 ± 0.011 vs. 1.006 ± 0.004 g/cm2, p = 0.01). The estimated errors in accuracy (g/cm2) were: 0.034 due to the jewels; 0.005 from erasing a small area; 0.019 from eliminating L4; 0.044 from eliminating both L3 and L4; 0.016 from predicting BMD using L1-3 and 0.028 using L1-2. The T-scores using the Hologic database were progressively lower in the caudal vertebrae, even in 96 local women aged 30-35 yrs, whose average T-score was 0.35 at L1 but -0.26 at L4. Thus, we found significant errors due to intravertebral variability. We suggest the optimal method of correcting for small artifacts is to erase the area under the artifact.
Keywords: Bone density, navel jewelry, adolescent, reference data base, body piercing, artifact
Introduction
Several artifactual factors can impair the accuracy of DXA (dual energy x-ray absorptiometry) measurements of the spine, including surgical hardware or cement, gastrointestinal barium or calcium tablets, and external objects like buttons, snaps, buckles and knives[1-3]. One unavoidable external artifact is unremovable navel jewelry. This has not received much attention because it is an infrequent artifact in the elderly, who usually receive bone densitometry.
In a national probability sample of 253 women aged 18-50, surveyed by random digit dialing technology, Laumann and colleagues [4] reported that 29 women had navel piercing. The prevalence of naval piercing jewelry among university students was 29% in 2001 [5] and 35% in 2006 [6]. We report here our experience with healthy adolescents and young women who were enrolled in prospective studies of contraceptive choices and bone health. We evaluated several methods of estimating the BMD in the vertebrae which were under the navel jewelry.
Methods
This study was conducted at Group Health Cooperative in Seattle, WA. The subjects from two studies were combined. The first study population (N=148) and recruitment methods have been published [7]. Briefly, recruitment occurred from June 1999 to December 2000. Potential participants were selected from a population-based sampling frame derived from the health plan's computerized data files. We selected samples that included 14 to 18 year old women receiving depot medroxy progesterone acetate (DMPA) injections and a random sample of age-similar comparison women. Those who were pregnant or planning pregnancy or who had diseases known to be associated with bone density were excluded. In the second study (N=579) recruitment was similar, except participants were selected on the basis of oral contraceptive use and non-use and excluding those using other hormonal contraception. The age range was 14 to 30 yrs. For these analyses, we excluded African American subjects because their bone density was significantly higher than that of other races, as well as those with abnormal spine anatomy, so the total number of subjects was 727. At the baseline (when the measurements from this report were used) there were no significant BMD differences among those who were using DMPA and controls.
All study procedures were reviewed and approved by the Group Health Human Subjects Committee and participants gave written consent. For those younger than 18 yrs, written consent was obtained from parents with assent from the subjects.
In order to determine a local reference group of women at peak bone density, we also examined bone density measurements from 96 healthy non-African-American women from a previous study [8] who were aged 30 to 35 years and who had been recruited from the same health plan population and measured in the same manner. T-scores were calculated using the mean and standard deviation for each vertebra using either our reference base or the Hologic reference base for women aged 30, using the 1991 Tom Kelly data [9]. The Hologic values all had a standard deviation of 0.11 g/cm2 and the mean values, in g/cm2, were: L1: 0.925, L2: 1.028, L3: 1.084, and L4: 1.116. Using our reference, the mean (standard deviation) results were: L1: 0.963 (0.128); L2: 1.058 (0.124); L3: 1.092 (0.124) and L4: 1.081 (0.124) g/cm2.
Bone density was measured with a Hologic QDR 4500 or QDR 2000 or Delphi densitometer (Hologic, Waltham, Mass), using manufacturer-specified positioning techniques. We measured the first through fourth lumbar vertebrae in the posterior-anterior direction using the array mode. Precision at our center was initially determined in 320 healthy elderly men and women from measurements of the total hip done twice with repositioning. The coefficient of variation was 1.5%, using the following equation [10], where a and b are the measurements and Ma and Mb are the means of the measurements:
We measured 20 women comparing the spine measurements on Hologic 2000 to 4500 with CV of 0.93% and another 20 women comparing spine measurements on the 4500 to Delphi, who also had a CV of 0.93%. We also measured the hip twice in 20 women on the Delphi, with a CV of 0.72%.
In the women who had navel jewelry overlying the lumbar vertebrae, the jewel was “erased” from the scan by tracing it and removing the area from analysis using software available on the densitometer. In another six scans randomly selected from those without navel jewelry, areas were erased from the middle and from the side of L3, from the middle and from the side of L4, and from an area over the intervertebral disc that included small areas of the bottom of L3 and top of L4, simulating positions seen with the larger styles of jewelry. This was done at 5 places in each spine. The average area erased in the random scans was 1.3 ± 0.14 cm2 from L3 or L4, and 2.5 cm2 from both L3 and L4.
Statistics
Data are reported as mean BMD g/cm2 ± standard error. The T-tests and regression analysis were done using the Statview program (SAS, N. Carolina). When predicting the total lumbar spine bone density using 2 or 3 vertebrae, we used regression analysis and report the standard error of the estimate (root mean square of the residual). We used the following equation to calculate BMD, excluding the BMC and area for the excluded vertebrae: (BMC1+BMC2+BMC3+BMC4) / (area1+area2+area3+area4), where BMC is bone mineral content and area is the projected area of the vertebra.
Errors in BMD measurements can be due to imprecision (repeatability) or accuracy. This analysis estimated the accuracy errors, but some of the equations are similar to those used to measure precision. The classic paper by Bland and Altman [11] calculates the repeatability from duplicate measurements in a group of individuals as the standard deviation of the difference between measurements. Others define precision as the root mean square (RMS) of the standard deviations of the measurements [12, 13]. The International Society for Clinical Densitometry has recommended the latter calculation [14]. In this study, we did not study repeatability, but rather the errors caused by estimating L1-4 from L1-2 or L1-3 or from erasing a small area. Therefore we calculated the root mean square of the difference between the measurements, using the equation: . This is analogous to calculating the standard error of the estimate in linear regression, except the residuals are calculated from the line of identity (y=x) instead of the line defined by the regression equation (y = intercept plus slope times x). This error, divided by the square root of 2, is the root mean squared of the standard deviation. It also is approximately the standard deviation of the difference when the mean difference is nearly zero.
Results
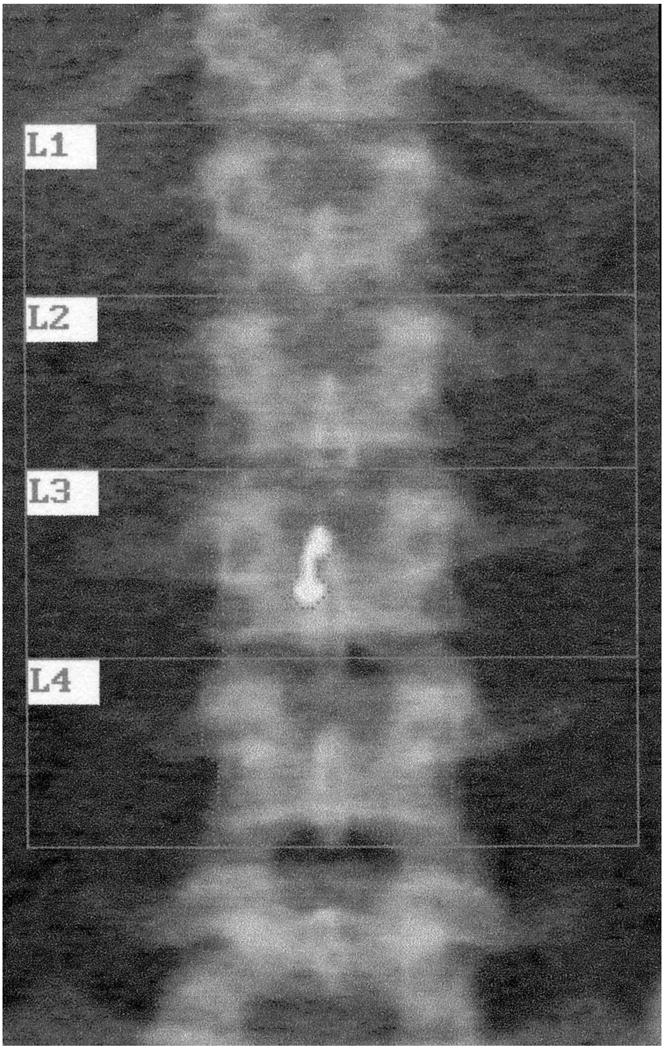
Seventy-one young women were wearing non-removable navel jewelry (10% of the study population). Scans were not available for erasing the jewels in 7 cases. In the remaining cases, the jewel was overlying L3 in seven women, L4 in 31 women, and both L3 and L4 in 26 women. An example is shown in Figure 1. The age of bejeweled women was 19.3 ± 0.5 years, which was not different from the age in the 656 women without navel jewelry (19.8 ± 0.2 years).
Figure 1.

Image from dual energy xray absorptiometry of lumbar spine in a subject wearing navel jewelry overlying the 3rd lumbar vertebra. The BMD was 0.909 g/cm2 initially. The jewel was traced and deleted from the analysis (“erased”). The area decreased by 0.66 cm2, and the new BMD was 0.887 g/cm2
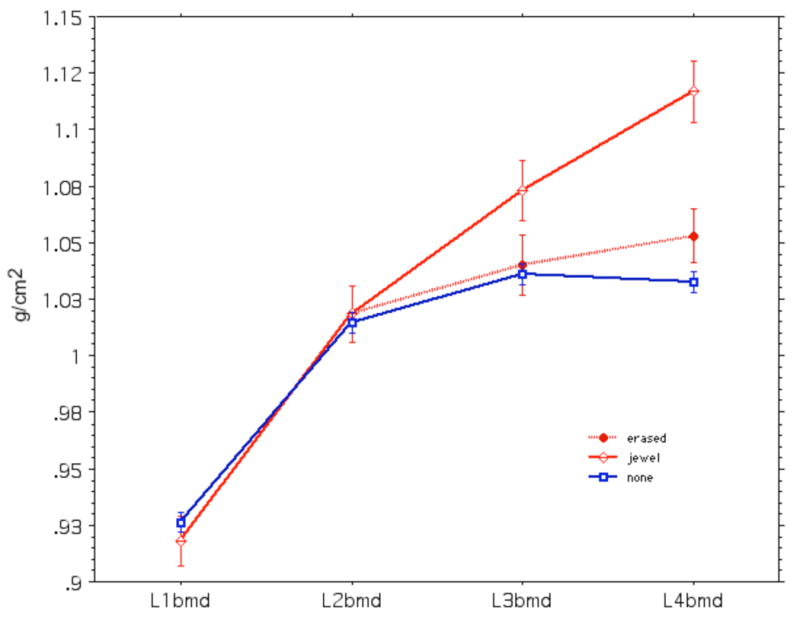
The BMD of the lumbar spine L1-4 was significantly higher in the women with jewelry than in those without (1.043 ± 0.012 vs. 1.006 ± 0.004 g/cm2, p = 0.01). However, the BMD of L1 and L2 were not different, as shown in Figure 2. L1 BMD was 0.918 ± 0.011 g/cm2 in those with jewels and 0.926 ± 0.005 in those without. The values for L2 were 1.018 ± 0.013 and 1.014 ± 0.005 g/cm2, respectively. Because the women in the group with jewels had the same bone density in L1 and L2 as the control women, we assumed that the “true” bone density of L3 and L4 would also be the same as in the control group.
Figure 2.

Bone density of lumbar vertebrae in 656 young women without navel jewelry (squares) and 64 with jewelry (diamonds). The dotted line shows values after “erasing” the jewel.
After erasing the jewels, there was no longer any significant difference in BMD at any lumbar vertebra or at L1-4 between those women with and without jewelry (1.013 ± 0.012 vs 1.006 ± 0.004 g/cm2, respectively) (Figure 2, dotted line).
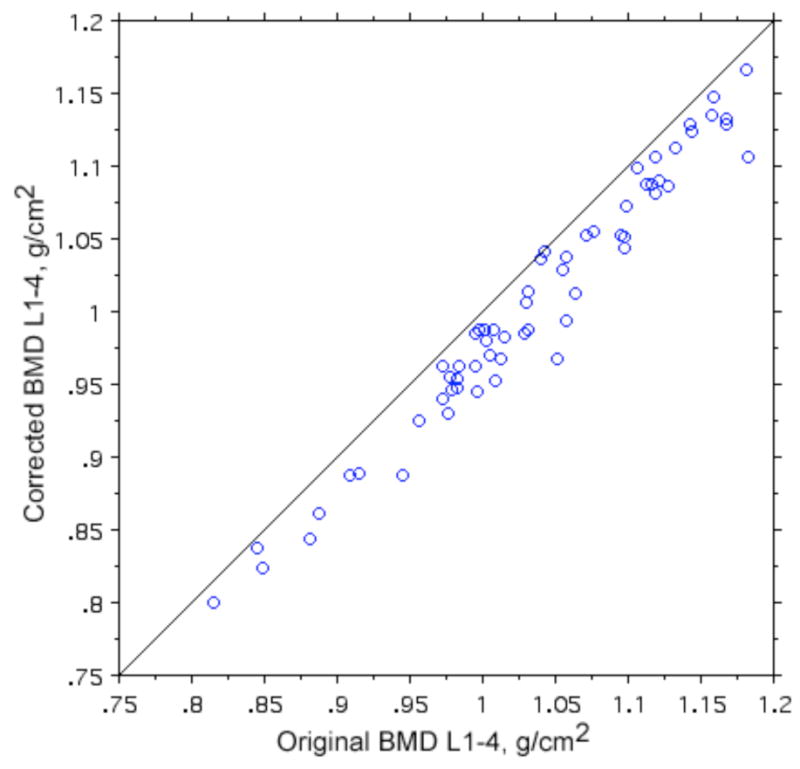
Figure 3 shows the L1-4 BMD values in the bejeweled women before and after erasing the jewels. The difference in BMD values before and after erasing ranged from 0.001 to 0.084 g/cm2, with an accuracy error (RMS) of 0.034 g/cm2. As anticipated, erasing the jewel resulted in a lower bone density in every case.
Figure 3.

Original and corrected bone density values in 64 young women with navel jewelry.
If the BMD were uniform in all vertebrae, it would be simple to merely delete one or two vertebra. We therefore also examined variation among the vertebrae. In these young women, the bone density was greater in the lower vertebrae than in the upper. In the control women (without jewels) the bone density of L4 was 1.032 ± 0.005 g/cm2, which was an average of 12% higher than L1 (0.926 ± 0.005). Therefore, simply eliminating L3 or L4, or especially both L3 and L4, results in a spine bone density that is lower than the spine density of L1-4. The error was 0.019 g/cm2 for eliminating L4 and 0.044 g/cm2 for eliminating L3 and 4.
We then tested the accuracy error in predicting the L1-4 BMD from the BMD of two or three other vertebrae. This was done in the women without jewelry, using linear regression. The standard error of the estimates (RMS residual) were: 0.028 g/cm2 for L1-2, 0.016 g/cm2 for L1-3, and 0.010 g/cm2 for L 1,2,4. These results were similar in all age groups.
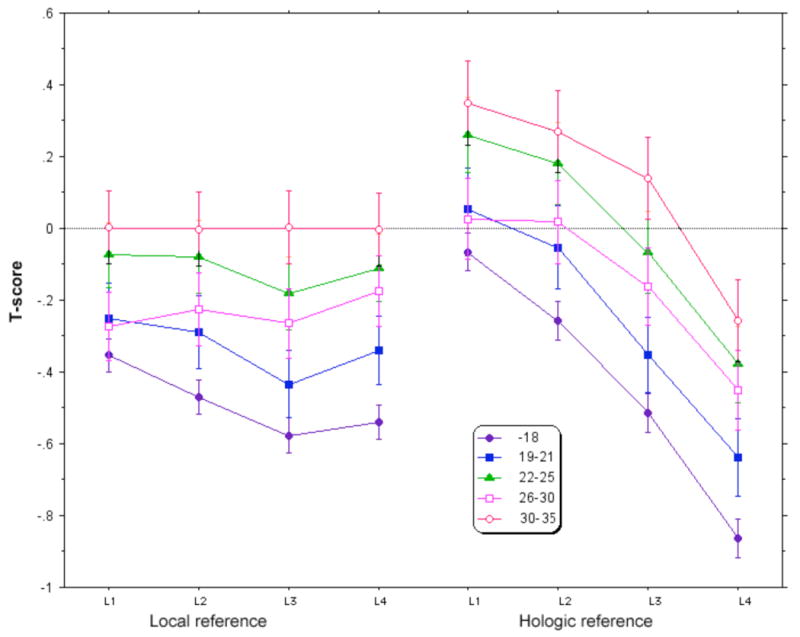
We had previously estimated the L1-4 BMD from the T-scores of the vertebrae without jewelry, but when we examined our results for T-scores of individual vertebra, we noticed that the T-scores using the manufacturer's reference data became progressively lower in caudal vertebra for all age ranges (as shown in Figure 4). The difference was greatest in the youngest subjects; for example, in those age 14-18 yrs the T-score for L4 was 0.80 SD lower than for L1. Using the local reference data of women aged 30-35, the T-score according to the manufacturer's data base was 0.61 SD lower at L4 than at L1. When we calculated T-scores using our own reference group, the younger women still showed lower values in the caudal vertebrae.
Figure 4.

Lumbar spine T-scores calculated from 96 normal women aged 30-35 from our center (left) and using the Hologic reference data-base (right).
Erasing a small area would itself cause an accuracy error. In the normal vertebrae with and without erasing a small area, the RMS error was 0.005 g/cm2. This error is an order of magnitude less than the error caused by the jewel. The areas erased in the random normal vertebra to test for accuracy error were larger than those in the subjects with jewels, to provide a conservative estimate. The actual area erased for the L3 jewels was 0.653 cm2 (range 0.35-0.92); for L4 the area erased was 0.755 cm2 (0.11-1.36). For L3-4 it was 0.369 cm2 (0-0.92) from L3 plus 0.554 cm2 (0.16-1.36) from L4.
Discussion
Navel jewelry is popular in teenagers and young women, and this can pose problems for studies that measure bone density of the lumbar spine at these ages. We found 10% of normal women in a population-based study were wearing non-removable navel jewelry. This is somewhat lower than the rate seen in one study from a college campus, which may be due in part to inclusion of removable jewelry in that study [6] and we included a broader age range. In teenagers, the volumetric bone density calculations require the bone density in units of g/cm2 as well as the area. If no adjustment is made for the jewels, measurement of this important anatomic site will be falsely elevated, by an average of 0.034g/cm2.
We did not see any difference in BMD of L1 or L2 between those women with or without jewels. Therefore, we thought it was reasonable to assume that an adequate method of correcting the BMD would result in similar values of L3 or L4 between those with and without jewels. This was the result when we “erased” the jewels. Although L4 values were not totally corrected, there was no significant difference between the corrected L4 in those with jewels and the L4 in those without jewels. The accuracy error caused by erasing a small area of bone from L3, L4 or both was small at 0.005 g/cm2.
Other approaches that we evaluated had more error. Excluding the underlying vertebrae resultes in an inaccurate underestimation, because the 3rd and 4th lumbar vertebrae (those that are beneath the jewelry) had substantially higher areal BMD than the first and second.
In our teenagers and young women, there was enough intra-vertebral variability that the L1-4 BMD could not be reliably predicted from the BMD of L1-2, L1-3, or L1,2 and 4. Despite high correlation among vertebral BMD measurements, the error was 0.01 to 0.028 g/cm2 (approximately 1 to 2.8%) using linear regression models. The errors were independent of age; therefore, we saw the same results if we used z-scores which we calculated in age groups from our own database.
Using T-scores of vertebrae without jewels to estimate the BMD of vertebrae under jewels also was problematic. In our population of adolescents without navel jewelry, the T-scores became progressively more divergent from the reference (Hologic) database in caudal vertebrae. We expected that the T-scores would be decreased in teenagers, but thought they would be equally low in all the vertebrae. Instead there was a systematic difference from the referent T-scores in the lower vertebrae, particularly in the youngest group. Even in the women who were at the age of peak bone mass for the spine (30-35yrs) the T-scores were significantly lower going from L1 to L4. There may have been a difference in the population. Our subjects were generally healthy. About 12% of the women were taking DMPA, but at the baseline their bone density was not different from non-users. When we used our own local reference data-base, the T-scores of women older than 25 were similar among all four of the lumbar vertebrae from L1 to L4. In the younger women, however, there was still a decrease in T-scores in the lower compared to the upper lumbar vertebrae. This suggests that there may be differential growth and/or mineralization in these teenagers and young women, with greater increases in the lower lumbar spine than in the upper spine. This is another reason to avoid using T-scores, and especially the lowest vertebral T-score, in young women to diagnose osteoporosis [15].
Erasing an area of bone under the jewelry causes some error--up to 0.8% for larger jewelry--but this correction usually had accuracy errors that were less than 0.5%, which is acceptably low and less than the error introduced by other strategies. Therefore, we recommend this technique. This method also would apply to any other small non-removable artifacts that overlie the lumbar vertebrae.
Finally, we note that it is important for the densitometrist to ask young female patients whether they are wearing navel jewelry, and to take this into account when analyzing and reporting the bone density values for the lumbar spine.
Acknowledgments
Funding/Support: This study was supported by grant R01 HD31165-08 from the National Institute of Child Health and Human Development, National Institutes of Health, Bethesda, MD (Dr Scholes).
Footnotes
Publisher's Disclaimer: This is a PDF file of an unedited manuscript that has been accepted for publication. As a service to our customers we are providing this early version of the manuscript. The manuscript will undergo copyediting, typesetting, and review of the resulting proof before it is published in its final citable form. Please note that during the production process errors may be discovered which could affect the content, and all legal disclaimers that apply to the journal pertain.
Literature cited
- 1.Krueger D, Checovich M, Gemar D, Wei X, Binkley N. Calcium supplement ingestion may alter lumbar spine bone mineral density measurement. J Clin Densitom. 2006;9:159–163. doi: 10.1016/j.jocd.2006.01.002. [DOI] [PubMed] [Google Scholar]
- 2.Morgan SL, Lopez-Ben R, Nunnally N, Burroughs L, Fineberg N, Tubbs RS, Yester MV. The effect of common artifacts lateral to the spine on bone mineral density in the lumbar spine. J Clin Densitom. 2008;11:243–249. doi: 10.1016/j.jocd.2007.11.004. [DOI] [PubMed] [Google Scholar]
- 3.Watts NB. Fundamentals and pitfalls of bone densitometry using dual-energy X-ray absorptiometry (DXA) Osteoporos Int. 2004;15:847–854. doi: 10.1007/s00198-004-1681-7. [DOI] [PubMed] [Google Scholar]
- 4.Laumann AE, Derick AJ. Tattoos and body piercings in the United States: a national data set. J Am Acad Dermatol. 2006;55:413–421. doi: 10.1016/j.jaad.2006.03.026. [DOI] [PubMed] [Google Scholar]
- 5.Mayers LB, Judelson DA, Moriarty BW, Rundell KW. Prevalence of body art (body piercing and tattooing) in university undergraduates and incidence of medical complications. Mayo Clin Proc. 2002;77:29–34. doi: 10.4065/77.1.29. [DOI] [PubMed] [Google Scholar]
- 6.Mayers LB, Chiffriller SH. Body art (body piercing and tattooing) among undergraduate university students: “then and now”. J Adolesc Health. 2008;42:201–203. doi: 10.1016/j.jadohealth.2007.09.014. [DOI] [PubMed] [Google Scholar]
- 7.Scholes D, LaCroix AZ, Ichikawa LE, Barlow WE, Ott SM. Change in bone mineral density among adolescent women using and discontinuing depot medroxyprogesterone acetate contraception. Arch Pediatr Adolesc Med. 2005;159:139–144. doi: 10.1001/archpedi.159.2.139. [DOI] [PubMed] [Google Scholar]
- 8.Scholes D, Lacroix AZ, Ott SM, Ichikawa LE, Barlow WE. Bone mineral density in women using depot medroxyprogesterone acetate for contraception. Obstet Gynecol. 1999;93:233–238. doi: 10.1016/s0029-7844(98)00447-5. [DOI] [PubMed] [Google Scholar]
- 9.Kelly T. Bone mineral density reference databases for American men and women. J one Miner Res. 1990;5(Suppl 2):S249. [Google Scholar]
- 10.Lodder MC, Lems WF, Ader HJ, Marthinsen AE, van Coeverden SC, Lips P, Netelenbos JC, Dijkmans BA, Roos JC. Reproducibility of bone mineral density measurement in daily practice. Ann Rheum Dis. 2004;63:285–289. doi: 10.1136/ard.2002.005678. [DOI] [PMC free article] [PubMed] [Google Scholar]
- 11.Bland JM, Altman DG. Statistical methods for assessing agreement between two methods of clinical measurement. Lancet. 1986;1:307–310. [PubMed] [Google Scholar]
- 12.Engelke K, Gluer CC. Quality and performance measures in bone densitometry: part 1: errors and diagnosis. Osteoporos Int. 2006;17:1283–1292. doi: 10.1007/s00198-005-0039-0. [DOI] [PubMed] [Google Scholar]
- 13.Gluer CC, Blake G, Lu Y, Blunt BA, Jergas M, Genant HK. Accurate assessment of precision errors: how to measure the reproducibility of bone densitometry techniques. Osteoporos Int. 1995;5:262–270. doi: 10.1007/BF01774016. [DOI] [PubMed] [Google Scholar]
- 14.Baim S, Wilson CR, Lewiecki EM, Luckey MM, Downs RW, Jr, Lentle BC. Precision assessment and radiation safety for dual-energy X-ray absorptiometry: position paper of the International Society for Clinical Densitometry. J Clin Densitom. 2005;8:371–378. doi: 10.1385/jcd:8:4:371. [DOI] [PubMed] [Google Scholar]
- 15.Hans D, Downs RW, Jr, Duboeuf F, Greenspan S, Jankowski LG, Kiebzak GM, Petak SM. Skeletal sites for osteoporosis diagnosis: the 2005 ISCD Official Positions. J Clin Densitom. 2006;9:15–21. doi: 10.1016/j.jocd.2006.05.003. [DOI] [PubMed] [Google Scholar]


