Abstract
Despite widespread interest in combining lab-on-a-chip technologies with mass spectrometry (MS)-based analyses, the coupling of microfluidics to electrospray ionization (ESI)-MS remains challenging. We report a robust, integrated poly(dimethylsiloxane) microchip interface for ESI-MS using simple and widely accessible microfabrication procedures. The interface uses an auxiliary channel to provide electrical contact for the stable cone-jet electrospray without sample loss or dilution. The electric field at the channel terminus is enhanced by two vertical cuts that cause the interface to taper to a line rather than to a point, and the formation of a small Taylor cone at the channel exit ensures sub-nL post-column dead volumes. Cone-jet mode electrospray was demonstrated for up to 90% aqueous solutions and for extended durations. Comparable ESI-MS sensitivities were achieved using both microchip and conventional fused silica capillary emitters, but stable cone-jet mode electrosprays could be established over a far broader range of flow rates (from 50-1000 nL/min) and applied potentials using the microchip emitters. This attribute of the microchip emitter should simplify electrospray optimization and make the stable electrospray more resistant to external perturbations.
INTRODUCTION
Microfluidic devices are becoming increasingly important for chemical analysis1-4. Benefits from their use include the ability to perform fast5 and efficient6 separations, and the high throughput achievable through highly parallel analyses.7,8 Another salient feature of microchips is their ability to combine multiple sample preparation steps with separation and in some cases detection onto a single, integrated platform.9-11 In time, such integration should further increase throughput, reduce costs, and enable the analysis of samples that are too small to be prepared using conventional benchtop protocols.
While a variety of detection methods have been used successfully,12 the workhorse for microfluidics has historically been laser-induced fluorescence (LIF). LIF provides excellent detection limits, extending to the single-molecule level,13 and is especially well suited to the analysis of certain classes of compounds such as DNA,14 for which complete sequencing information can be acquired using four-color fluorescence detection following a high-resolution capillary electrophoresis (CE) separation.15 However, for other applications, perhaps most notably proteomics, identification of large numbers of analytes from a complex sample using LIF detection quickly becomes impractical. In contrast, mass spectrometry (MS) has become indispensable for peptide and protein identification, structural characterization, and quantitation,16-18 making the coupling of microfluidics with MS detection especially promising.19
A number of successful microfluidic designs for direct infusion electrospray ionization (ESI)-MS have been developed, as noted in a recent review by Koster and Verpoorte.20 Of particular note, the ESI-chip™,21,22 which consists of an array of 400 emitters, enjoys widespread use as a core component in a commercially available automated platform for infusing samples or coupling capillary liquid chromatography (LC) separations with ESI-MS at nL/min flow rates.23 The development of integrated microdevices capable of on-chip separations followed by ESI has proven far more challenging. One reason for this is that the electric field enhancement provided by conventional fused silica capillary emitters is difficult to replicate in the plane of a microfluidic network. As a result, many of the designs having integrated emitters have not been shown to function at the sub-100 nL/min flow rates typical of microchip CE separations. Indeed, many researchers have used manually inserted fused silica capillary emitters to couple microfluidic separations [e.g., capillary electrophoresis (CE)] to ESI-MS.24-32 Unfortunately, combining capillary-based emitters with microchips invariably adds significant complexity to fabrication and assembly, and can result in large dead volumes that degrade performance.24
Another challenge faced when coupling microchips to ESI-MS is applying the electrical potential for the ESI, particularly when an electrophoretic separation is also performed on-chip. It is possible to connect the separation channel and the electrospray source serially on the same electrical circuit,24,27,33 but this limits the amount of current in the CE separation to that supported by ESI. Other approaches include adding a conductive coating at the terminus,32,34,35 or applying the potential across a semipermeable membrane,29,36-38 which can add to the fabrication complexity. In-channel liquid junctions and sheath flows have also been used,25,30,31,39-43 but such interfaces can add dead volumes, dilute the sample, or result in sample losses.
In this report, we present a poly(dimethylsiloxane) (PDMS) microchip ESI-MS interface that is robust and extremely simple to create and operate. The design employs an auxiliary channel to provide electrical contact to the Taylor cone of the electrospray without the use of a conductive emitter coating or intersecting channels. A similar approach for supplying the ESI potential has been reported in the patent literature for poly(methyl methacrylate) microdevices, in which channels merged in an open region just prior to the emitter, but conventional machining was used to form the tapered tip.44,45 In contrast to many chip-based ESI sources, the PDMS emitters described here demonstrate distinct advantages over state-of-the-art fused silica capillary emitters, including the ability to operate electrospray in the cone-jet mode over a broader range of flow rates (50-1000 nL/min) and applied potentials (up to ∼1200 V). While this initial characterization has used externally pumped infusion-based ESI, the simple fabrication, low dead volume, accessible nano-ESI flow rates and auxiliary channel for high-voltage application should also provide a suitable interface for microchip CE-ESI-MS.
EXPERIMENTAL SECTION
Materials and Sample Preparation
HPLC-grade methanol (MeOH) and 48% hydrofluoric acid were purchased from Fisher Scientific (Fair Lawn, NJ). Reserpine, porcine angiotensinogen 1-14, glacial acetic acid (HOAc) and ammonium acetate were from Sigma-Aldrich (St. Louis, MO). Water was purified using a Barnstead Nanopure Infinity system (Dubuque, IA). PDMS elastomer base and curing agent were purchased as Sylgard 184 from Dow Corning (Midland, MI). The chemically etched fused silica emitters were created from 360-μm-o.d./75-μm-i.d. tubing (Polymicro Technologies, Phoenix, AZ) as described previously.46
PDMS Microchip Fabrication and Operation
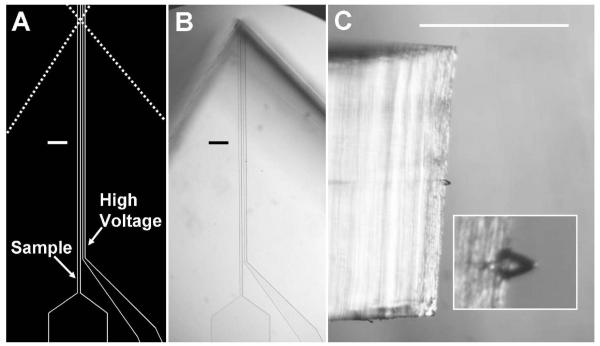
The PDMS microchips were created using established microfabrication techniques. Briefly, mylar photomasks were designed using IntelliCAD software (IntelliCAD Technology Consortium, Portland, OR) and printed at 50,000 dpi at Fineline Imaging (Colorado Springs, CO). An 8-μm-thick layer of SU-8 photoresist (Microchem, Newton, MA) was spin-coated on a silicon wafer, patterned using standard photolithography, and processed according to manufacturer instructions. PDMS base and curing agent (10:1 w/w) were mixed thoroughly, poured onto the patterned wafer to a thickness of ∼1 mm, and cured for at least 1 hr on a hot plate at 80 °C. Following curing, the patterned PDMS was removed from the template, and through-holes were created by pressing a manually sharpened syringe needle (NE-301PL-C; Small Parts, Miramar, FL) through the substrate. The PDMS was then cleaned and bonded to an unpatterned piece of ∼1-mm-thick PDMS. The irreversible seal was achieved by exposing each of the substrates to a corona surface treater47 (BD-20AC; Electro-Technic Products, Chicago, IL) for ∼20 s, bringing them into contact, and placing them on a hot plate at 70 °C for 1 hr. Individual devices were excised from the bonded assembly using a razor blade and placed on the stage of a stereomicroscope (SMZ1500; Nikon, Tokyo, Japan) equipped with a 0.5× objective and 10× eyepieces. Two vertical cuts were made as shown in Figure 1A using the stereomicroscope to aid alignment, creating a taper at the channel terminus to complete the devices.
Figure 1.
Microchip ESI device images. (A) Drawing of the microchannels used for photomask creation. Dashed lines indicate where cuts are made to create the emitter structure. (B) Top view of a completed device. (C) Side view of a microchip during ESI operation with a close-up view of the Taylor cone in the inset. Scale bars are 100 μm in (A) and (B) and 1 mm in (C).
The sample channel (Figure 1) was interfaced to a syringe pump (PHD 2000, Harvard Apparatus, Holliston, MA) via a fused silica capillary (Polymicro Technologies) transfer line. To create a robust seal at the microchip, the capillary end was inserted into a ∼2-mm-long section of Tygon tubing (TGY-010-5C; Small Parts), which was in turn inserted into the sample through-hole on the device. Electrical contact was made by filling the high-voltage channel (Figure 1) and reservoir with 1% HOAc in MeOH unless specified otherwise. A gold electrode inserted in the reservoir and connected to a high-voltage power supply (PS350; Stanford Research Systems, Sunnyvale, CA) was used to deliver the ESI potential.
Electrospray Characterization
Electrospray current measurements were made using a stainless steel charge collector as described previously.48,49 The emitter-counterelectrode distance was 2.5 mm. Optical observations of electrosprays were made using the Nikon stereomicroscope with a 1× objective. Photomicrographs were obtained using a Nikon Coolpix 8700 digital camera with an adapter (part No. S-04490; The Microscope Depot, Tracy, CA) that fit into one of the eyepieces on the stereomicroscope. Adobe (San Jose, CA) Photoshop CS3 was used to overlay the images and remove glare in Figure 5B, enabling direct visual comparison of Taylor cone dimensions. MS characterization was performed using an LCQ ion trap mass spectrometer (Thermo-Fisher, San Jose, CA) or an ion-funnel-modifed50 micromass quadrupole time-of-flight (Q-ToF) mass spectrometer (Waters, Milford, MA). For the ion trap experiments, the fused silica capillary and microchip emitters were positioned 2-3 mm from the MS heated inlet capillary, which was set at 170 °C. The maximum sample injection time was 300 ms, and 3 microscans were summed for each scan. When the Q-ToF was employed, the inlet capillary temperature was 140 °C.
Figure 5.
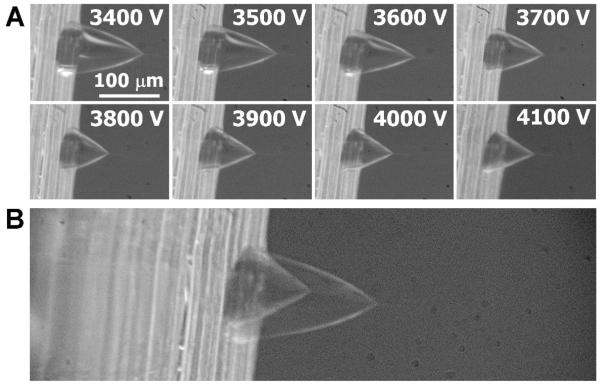
Taylor cone images from a microchip-based emitter spraying 5 mM ammonium acetate in 1:1 H2O:MeOH at 200 nL/min. (A) Series of photographs obtained at different applied potentials. The scale bar at 3400 V applies to all images in (A). (B) The images obtained at 3400 V and 4100 V were aligned and overlaid to enable clear comparison of their shapes and dimensions.
Safety Information
The hydrofluoric acid used to produce the chemically etched fused silica capillary emitters is extremely hazardous and corrosive. Care must be taken to avoid exposure to HF liquid or vapor. HF solutions should be used in a ventilated hood and appropriate protective equipment should be worn. The voltages used for electrospray can cause electric shock, so appropriate precautions, such as current limiting settings on power supplies and isolation of electrical leads, should be taken.
RESULTS AND DISCUSSION
A key strength of the PDMS microchips described here is the simplicity of the fabrication procedure. Device creation relies on standard rapid prototyping51 from SU-8 masters made from a single photomask. The photomask layout incorporates 8 infusion devices on a 100-mm-diameter wafer, in addition to two CE separation devices (to be evaluated). After the reservoir/fluid connection through-holes are made in the cured PDMS, a cover piece encloses all channels simultaneously. That is, no special alignment of substrates, complicated fabrication steps, or incorporation of separate (e.g., fused silica) emitters is necessary. Once the bonded devices are separated from one another, two vertical cuts from a razor blade form an emitter that tapers to a line rather than to a point, as shown in Figure 1. The native hydrophobicity of the PDMS material, in combination with the electric field enhancing taper, enables the formation of small Taylor cones for stable electrosprays without the need for surface treatment.
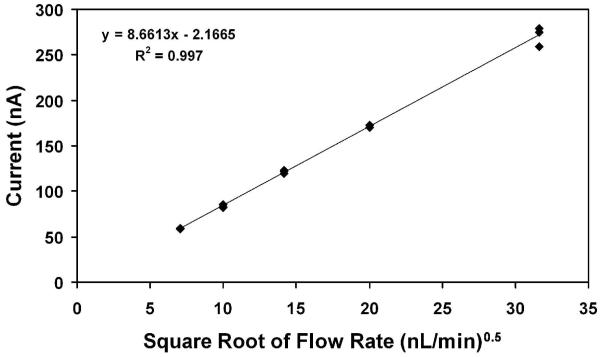
For this work, the analyte solution was driven through one microchannel using a syringe pump, while the other “high-voltage” microchannel running parallel (Figure 1A-1B) was connected to a reservoir. The channels were each 12 μm wide and 8 μm deep, and the distance between them was 12 μm. Contact between the two channels was made in the Taylor cone itself, rather than in an intersection prior to the outlet, enabling electrical contact without the risk of sample loss due to backflow into the high-voltage channel. When the emitter interface is used for microchip CE applications, the arrangement will also allow the CE circuit, which can operate at higher currents (often >10 μA), to be separate from the ESI circuit, which requires <1 μA, without the use of membranes or a conductive emitter surface. An initial experiment to determine whether the high-voltage channel introduced a significant electroosmotically-driven flow, which could potentially dilute the sample, was to measure the average ESI currents observed in cone-jet mode for three different microchips and plot the measured currents against the square root of flow rate, as shown in Figure 2. The plot shows a linear relationship, in agreement with the work of Fernández de la Mora and Loscertales,52 which would be disrupted if significant additional flow were provided by the high voltage channel. Because the linearity extends at least as low as 50 nL/min, it appears that any flow contribution from the high-voltage channel is minor. A more conclusive study to test for leakage from the high-voltage channel is discussed below (see Figure 10 and accompanying text).
Figure 2.
Linear relationship between emitted current and the square root of flow rate. Replicates were obtained using three different microchips. The emitter was positioned 2.5 mm from the counterelectrode, and the electrosprayed solution was 5 mM ammonium acetate in 1:1 H2O:MeOH.
Figure 10.
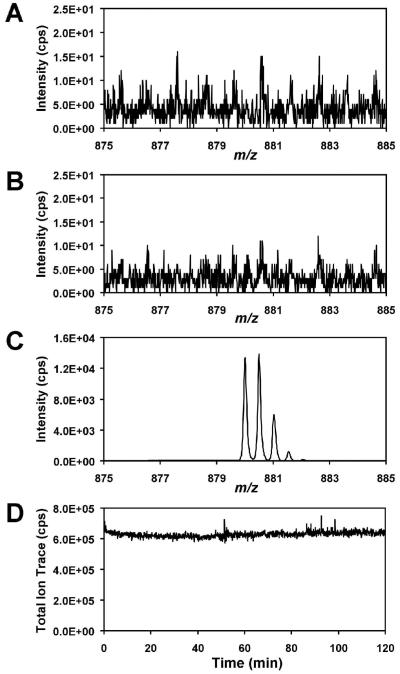
Testing for leakage from the high voltage channel. (A) Blank mass spectrum from 5 mM ammonium acetate in 1:1 H2O:MeOH in both the sample channel and the high-voltage channel. (B) Experiment repeated with the solution in the high-voltage channel replaced with a 10 μM solution of angiotensinogen 1-14. (C) Mass spectrum of angiotensinogen 1-14 [M + 2H]2+ infused through the sample channel. (D) Total ion signal from the infusion of the 10 μM angiotensinogen 1-14 solution. The sample flow rate was 200 nL/min in all cases.
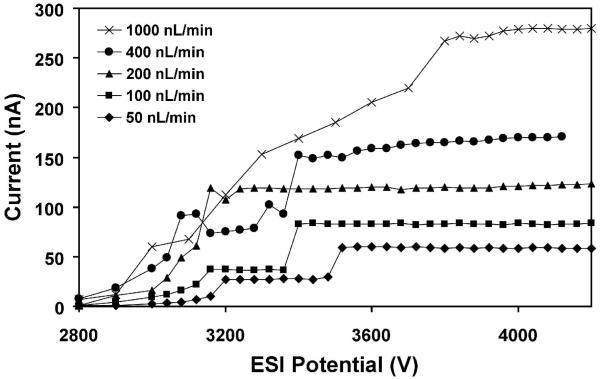
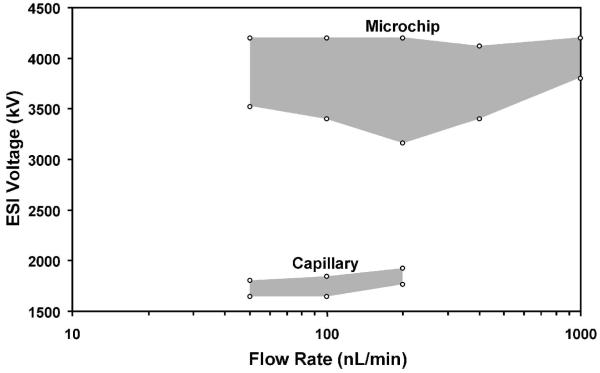
A surprising finding for the chip-based emitters is that they could maintain cone-jet mode over a far broader range of conditions than their fused silica capillary emitter counterparts. An electrospray can operate in a number of different emission modes,53-56 including dripping, pulsating, astable, cone-jet and multi-jet, depending on parameters such as solvent composition, applied potential and flow rate, and changes in spray mode can have a significant impact on ESI-MS data quality.54,57 Cone-jet mode has been found to be optimal for ion production54,57 due to the uniformity of the small (readily desolvated) droplets that are generated, and the greater excess charge per analyte molecule. Since operating parameters can change during an analysis (e.g., changing solvent composition for gradient elution LC), an emitter that can maintain cone-jet mode despite such perturbations is desirable. Figure 3 shows the electrospray characteristic current vs. voltage curves for a chip-based emitter at flow rates ranging from 50 to 1000 nL/min. In each curve, the constant-current plateau at higher voltages corresponds to the cone-jet mode electrospray operation, while the lower current-limited regime (most obvious at 50 and 100 nL/min) corresponds to pulsating mode.56 At potentials greater than ∼4200 V, electrical breakdown could occur. Cone-jet mode electrospray was attainable at all flow rates shown, indicating an operating range that spanned a factor of 20. In contrast, fused silica emitters used in the micro- and nano-flow regime typically achieve cone-jet mode for only a narrow range of flow rates and voltages.56,58,59 Figure 4 shows a stability diagram comparing the flow rate/ESI potential combinations for which cone-jet mode was accessible for both a microchip and a chemically etched fused silica capillary emitter. The stability region for the microchip emitter was obtained from the data in Figure 3, and the data for the capillary emitter were collected in a similar fashion (i.e., measuring the ESI current as the potential is increased in 40 V increments). Neither the capillary nor the microchip emitter achieved stable cone-jet electrospray operation below 50 nL/min, and flow rates greater than 1000 nL/min were not explored. With the capillary emitter, cone-jet mode was achieved only from 50-200 nL/min. At 400 and 1000 nL/min, the electrospray from the capillary transitioned directly from pulsating mode to multi-jet mode. Also, from 50 to 200 nL/min, the ESI potential range for which cone-jet mode was observed spanned just 200 V or less, while for the PDMS microchip cone-jet mode was obtained over a much broader range of voltages (e.g., 1200 V at 200 nL/min). In addition to being better able to resist external perturbations, the broader cone-jet stability of the microchip emitters should reduce the amount of fine-tuning required for electrospray optimization.
Figure 3.
Electrospray current vs. voltage curves for a microchip emitter operated at different flow rates. ESI conditions were the same as for Figure 2.
Figure 4.
Diagram indicating the ESI voltage/flow rate combinations for which cone-jet mode was accessible for the PDMS microchip emitter and a 75-μm-i.d. capillary emitter.
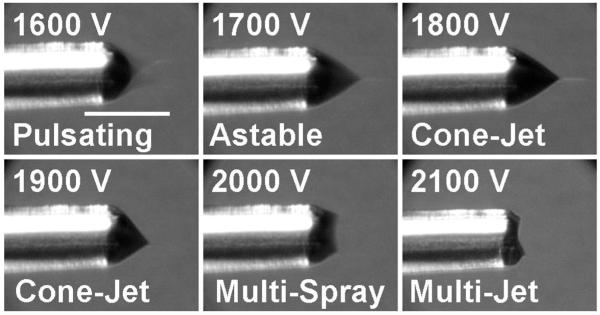
In an effort to determine the cause of the broader electrospray stability region for the PDMS microchips, photographs of the Taylor cone were obtained as the ESI potential was varied for both PDMS microchip and capillary emitters, as shown in Figures 5 and 6, respectively. Most clearly seen from the photographs in Figure 5A is that the length of the Taylor cone from base to apex decreases, but the diameter of the Taylor cone at the base decreases as well. To visualize this more clearly, the photographs obtained at 3400 and 4100 V were aligned and superimposed, and are shown in Figure 5B. The images indicate that the base diameter decreased from ∼90 μm at 3400 V to ∼70 μm at 4100 V. The lack of a fixed anchoring point at the base allowed the Taylor cone angle (measured close to the apex) to change only slightly, from ∼67° to ∼57°, as the voltage increased. These images also allow the volumes of the Taylor cones to be estimated, which were found to decrease from ∼0.3 nL at 3400 V to ∼0.1 nL at 4100 V. These negligible post-column dead volumes should prove favorable for on-chip CE-ESI-MS analyses. Figure 6 shows the corresponding images for a fused silica capillary emitter using the same solution and flow rate. Note, the image marked “astable”55 appears similar to those labeled “cone-jet” because the slow exposure time of the camera (0.5 s) averaged over the fluctuations between pulsating and cone-jet modes. The Taylor cone angle at 1800 V, measured at ∼66°, must necessarily increase as the meniscus retracts at higher voltages because the anchoring point at the base is fixed by the emitter orifice diameter. The larger angle eventually destabilizes the Taylor cone and multiple sprays anchored to the rim of the emitter are formed,60,61 resulting in a narrow voltage range for cone-jet electrospray operation.
Figure 6.
Electrospray images from a 75-μm-i.d. chemically etched fused silica capillary. The scale bar in the first panel is 100 μm and applies to all images. Additional description is in the text.
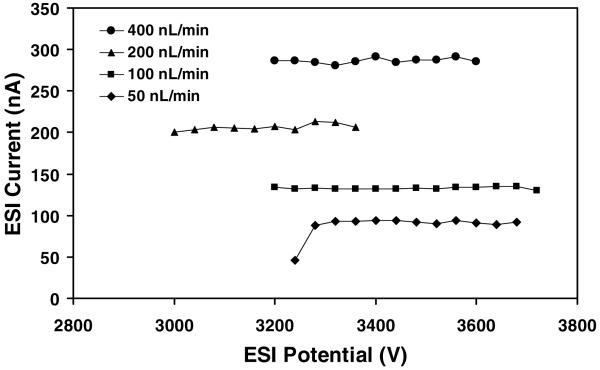
Because the above comparisons used the same 1:1 aqueous:organic solution, which is nearly ideal for generating electrosprays, it was desirable to evaluate performance using another solution composition as well. Accordingly, a 5 mM ammonium acetate solution was prepared in 9:1 H2O:MeOH and tested with the microchip ESI interface. Current vs. voltage curves for the solution at different flow rates are shown in Figure 7. Unlike the 1:1 aqueous:organic solution, in which the electrosprays transitioned from pulsating mode to cone-jet mode with increasing voltage, the threshold voltage for initiating electrospray typically corresponded to cone-jet mode when the 90% aqueous solution was employed. Pulsating mode was observed only for a single situation (3240 V, 50 nL/min in Figure 7). Operation at higher voltages than those shown in the plots resulted in electrical breakdown. The 90% aqueous solution reduced the parameter space in which cone-jet mode could be achieved relative to the 50% aqueous solution in terms of the range of accessible flow rates (stable electrospray was not achieved at 1 μL/min) and ESI potentials, but the stability window remained fairly broad. The ability to have flexibility in terms of the selected solvent is important for both direct infusion experiments and for electrophoretic applications. For example, CE can be operated using pure aqueous or organic solutions, or solutions containing mixtures of aqueous and organic solvents.62 Specific applications require optimization of organic content to alter analyte selectivity and solubility. In future work, we will pursue operation of the microchip ESI sources with other solvent systems, including pure aqueous solutions.
Figure 7.
Electrospray current vs. voltage curves for a microchip emitter spraying 5 mM ammonium acetate in 9:1 H2O:MeOH. The distance from the emitter to the counterelectrode was 2.5 mm.
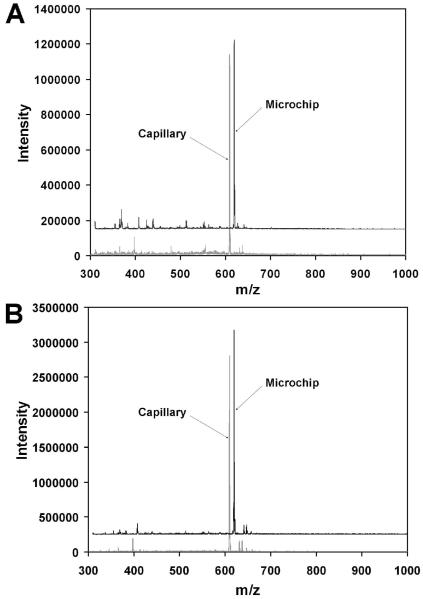
While PDMS has found widespread use as a substrate for microfluidic devices, there are significant concerns about the compatibility of its surface, particularly with respect to absorption of hydrophobic analytes63 and the leaching of uncrosslinked oligomers from the elastomer matrix.64 A variety of treatments have been developed for surface modification,65-68 but the presence contaminating species originating from the bulk substrate that could interfere with the ESI process were potentially of concern. Figure 8 compares mass spectra of a model analyte using microchip and chemically etched fused silica capillary emitters to test for the presence of contaminants not found with a conventional emitter. At 50 nL/min (Figure 8A), the signal intensity is very similar for both emitters, and the background is also largely similar. There are, however, several background peaks that are more prominent when the microchip emitter is used, but given their low intensity and small number, such minor extraneous peaks are unimportant for most applications. Additionally, the mass spectra obtained using microchip and fused silica emitters at 400 nL/min (Figure 8B) are nearly identical, suggesting that the unidentified peaks may be suppressed at higher flow rates.
Figure 8.
Comparison of mass spectra of 1 μM reserpine obtained using microchip and chemically etched fused silica emitters. The flow rate was 50 nL/min in (A) and 400 nL/min in (B). The mass spectra from the microchip emitter are offset horizontally by 10 m/z units as well as vertically for clarity.
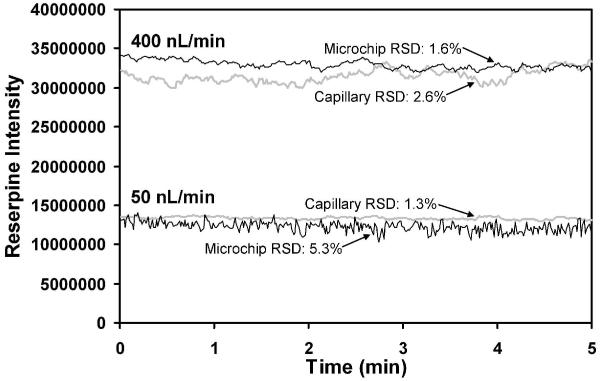
Signal stability was also compared between the PDMS microchip and etched fused silica capillary emitters, as shown in Figure 9, under the same conditions as those used to obtain Figure 8. At 400 nL/min, the relative standard deviations (RSD) provided by the microchip and capillary-based emitters were comparable at 1.6 and 2.6%, respectively, while the capillary-based emitters outperformed the microchips at 50 nL/min. However, the RSD of 5.3% at 50 nL/min for the microchip emitter is still quite reasonable. We plan to pursue alternative fabrication strategies (e.g., using more sharply tapered emitters) to improve stability at these low flow rates and to enable use of even lower flow rates.
Figure 9.
Stability comparison between microchip and capillary-based emitters. Additional description is in the text.
The linear relationship between the ESI current and the square root of the flow rate (see Figure 2), as well as the similar analyte intensities observed for the microchip ESI interface and the conventional ESI source (see Figure 8) indicate that the high-voltage channel serves as a liquid electrode without significantly diluting the sample. This was confirmed by adding a marker analyte to the high-voltage channel and testing for its presence in the mass spectrum, as shown in Figure 10. First, a “blank” mass spectrum (Figure 10A) was collected in which no analyte was added to either the sample or the high-voltage channel. The high-voltage channel and its reservoir were then filled with a 10 μM solution of the peptide angiotensinogen 1-14 (MW 1759.01), with no analyte in the sample channel and a second mass spectrum was obtained. No analyte was detected, as shown in Figure 10B. Finally, the angiotensinogin solution was infused through the sample channel, which provided the mass spectrum shown in Figure 10C. The experiment was performed a second time for verification, and although sample carryover produced a low intensity analyte signal in the blank, the signal intensity did not increase when the analyte solution was added to the high-voltage channel (not shown). These results indicate that the high-voltage channel serves as a “liquid electrode” without diluting the sample. The liquid electrode arrangement also carries the benefit of preventing gaseous electrolysis products from entering the analyte channel. There are circumstances, however, in which induced flow through the auxiliary channel could be desirable to improve electrospray conditions,69 e.g., if the solvent selected for a microchip CE separation were incompatible with ESI operation. In that case, it may be possible to use the high-voltage channel to provide a makeup liquid, supplying acid or increasing the organic solvent content for improved electrospray performance. Such flow could be provided by electroosmosis if the channel surfaces were appropriately modified, or by pressure-driven pumping. Using the same angiotensinogen solution infused through the sample channel, we tested whether the electrospray could function for extended periods. As shown in the total ion trace in Figure 10D, the microchip ESI sources are capable of continuous, stable operation for at least 2 h, provided that the electrolyte solution is periodically added to the high-voltage reservoir to compensate for evaporative losses.
CONCLUSIONS
The PDMS microchip ESI sources described here have several notable advantages over previous solutions. The fabrication procedure employed is straightforward, using only a single photomask and requiring no careful alignment of substrates or added materials to form a sharp emitter. With the exception of the two vertical cuts made to enhance the electric field at each emitter, all devices on the wafer are batch processed. An electrolyte-filled auxiliary channel provides the high voltage for ESI in the Taylor cone itself without introducing additional dead volume, diluting the sample or causing sample loss. The ability to decouple the ESI circuit from the sample channel without an in-channel liquid junction, semipermeable membrane or conductive coating should prove especially useful for electrically driven microchip separations. ESI-MS sensitivity was essentially identical for the microchip emitter compared to a fused silica capillary emitter, and the RSD of analyte intensity was 1.6% and 5.3% at 400 and 50 nL/min, respectively. Unlike traditional fused silica capillary emitters, the PDMS microchip emitters described here do not have a fixed emitter orifice, which allowed the Taylor cone to adjust to the changing operating conditions. Incorporating this interface with integrated sample preparation/CE microchips should provide an important step towards a range of important applications, such as the ultra-sensitive proteome analyses of extremely limited cell populations.
ACKNOWLEDGEMENTS
We thank Dr. Mikhail Belov, Dr. Jason Page and Dr. Ioan Marginean for helpful discussions. Portions of this research were supported by the U.S. Department of Energy (DOE) Office of Biological and Environmental Research, the NIH National Center for Research Resources (RR018522), and the National Institute of Allergy and Infectious Diseases NIH/DHHS through interagency agreement Y1-AI-4894-01NIH. Portions of the microfabrication were performed at the BioMEMS Resource Center in Charlestown, MA, supported by the National Institute of Biomedical Imaging and Bioengineering under Grant No. P41 EB002503, and the Microfabrication Laboratory in the Environmental Molecular Sciences Laboratory (EMSL). EMSL is a U.S. DOE national scientific user facility located at the Pacific Northwest National Laboratory (PNNL) in Richland, Washington. Other experimental portions of this research were also performed at EMSL. PNNL is a multiprogram national laboratory operated by Battelle for the DOE under Contract No. DE-AC05-76RLO 1830.
REFERENCES
- (1).Reyes DR, Iossifidis D, Auroux P-A, Manz A. Anal. Chem. 2002;74:2623–2636. doi: 10.1021/ac0202435. [DOI] [PubMed] [Google Scholar]
- (2).Auroux P-A, Iossifidis D, Reyes DR, Manz A. Anal. Chem. 2002;74:2637–2652. doi: 10.1021/ac020239t. [DOI] [PubMed] [Google Scholar]
- (3).Vilkner T, Janasek D, Manz A. Anal. Chem. 2004;76:3373–3386. doi: 10.1021/ac040063q. [DOI] [PubMed] [Google Scholar]
- (4).Dittrich PS, Tachikawa K, Manz A. Anal. Chem. 2006;78:3887–3907. doi: 10.1021/ac0605602. [DOI] [PubMed] [Google Scholar]
- (5).Jacobson SC, Culbertson CT, Daler JE, Ramsey JM. Anal. Chem. 1998;70:3476–3480. [Google Scholar]
- (6).Culbertson CT, Jacobson SC, Ramsey JM. Anal. Chem. 2000;72:5814–5819. doi: 10.1021/ac0006268. [DOI] [PubMed] [Google Scholar]
- (7).Paegel BM, Emrich CA, Wedemayer GJ, Scherer JR, Mathies RA. Proc. Natl. Acad. Sci. USA. 2002;99:574–579. doi: 10.1073/pnas.012608699. [DOI] [PMC free article] [PubMed] [Google Scholar]
- (8).Emrich CA, Tian H, Medintz IL, Mathies RA. Anal. Chem. 2002;74:5076–5083. doi: 10.1021/ac020236g. [DOI] [PubMed] [Google Scholar]
- (9).Cheng SB, Skinner CD, Taylor J, Attiya S, Lee WE, Picelli G, Harrison DJ. Anal. Chem. 2001;73:1472–1479. doi: 10.1021/ac0007938. [DOI] [PubMed] [Google Scholar]
- (10).Lagally ET, Scherer JR, Blazej RG, Toriello NM, Diep BA, Ramchandani M, Sensabaugh GF, Riley LW, Mathies RA. Anal. Chem. 2004;76:3162–3170. doi: 10.1021/ac035310p. [DOI] [PubMed] [Google Scholar]
- (11).Ramsey JD, Collins GE. Anal. Chem. 2005;77:6664–6670. doi: 10.1021/ac0507789. [DOI] [PubMed] [Google Scholar]
- (12).Uchiyama K, Nakajima H, Hobo T. Anal. Bioanal. Chem. 2004;379:375–382. doi: 10.1007/s00216-004-2616-z. [DOI] [PubMed] [Google Scholar]
- (13).Dittrich PS, Manz A. Anal. Bioanal. Chem. 2005;382:1771–1782. doi: 10.1007/s00216-005-3335-9. [DOI] [PubMed] [Google Scholar]
- (14).Kelly RT, Woolley AT. Anal. Chem. 2005;77:96A–102A. doi: 10.1021/ac0501083. [DOI] [PubMed] [Google Scholar]
- (15).Woolley AT, Mathies RA. Anal. Chem. 1995;67:3676–3680. doi: 10.1021/ac00116a010. [DOI] [PubMed] [Google Scholar]
- (16).Aebersold R, Mann M. Nature. 2003;422:198–207. doi: 10.1038/nature01511. [DOI] [PubMed] [Google Scholar]
- (17).Ong SE, Mann M. Nat. Chem. Biol. 2005;1:252–262. doi: 10.1038/nchembio736. [DOI] [PubMed] [Google Scholar]
- (18).Liu T, Belov ME, Jaitly N, Qian W-J, Smith RD. Chem. Rev. 2007;107:3621–3653. doi: 10.1021/cr068288j. [DOI] [PMC free article] [PubMed] [Google Scholar]
- (19).Freire SLS, Wheeler AR. Lab on a Chip. 2006;6:1415–1423. doi: 10.1039/b609871a. [DOI] [PubMed] [Google Scholar]
- (20).Koster S, Verpoorte E. Lab Chip. 2007;7:1394–1412. doi: 10.1039/b709706a. [DOI] [PubMed] [Google Scholar]
- (21).Schultz GA, Corso TN, Prosser SJ, Zhang S. Anal. Chem. 2000;72:4058–4063. doi: 10.1021/ac000325y. [DOI] [PubMed] [Google Scholar]
- (22).Moon JE, Davis TJ, Galvin GJ, Schultz GA, Corso TN, Lowes S. 6,563,111. U.S. Patent. 2000
- (23). [accessed Mar 2008];Advion TriVersa NanoMate website. http://www.advion.com/biosystems/triversananomate/triversa-mass-spectrometry.php.
- (24).Bings NH, Wang C, Skinner CD, Colyer CL, Thibault P, Harrison DJ. Anal. Chem. 1999;71:3292–3296. doi: 10.1021/ac981419z. [DOI] [PubMed] [Google Scholar]
- (25).Lazar IM, Ramsey RS, Sundberg S, Ramsey JM. Anal. Chem. 1999;71:3627–3631. doi: 10.1021/ac990373m. [DOI] [PubMed] [Google Scholar]
- (26).Zhang B, Liu H, Karger BL, Foret F. Anal. Chem. 1999;71:3258–3264. doi: 10.1021/ac990090u. [DOI] [PubMed] [Google Scholar]
- (27).Vrouwe EX, Gysler J, Tjaden UR, van der Greef J. Rapid Commun. Mass Spectrom. 2000;14:1682–1688. doi: 10.1002/1097-0231(20000930)14:18<1682::AID-RCM78>3.0.CO;2-E. [DOI] [PubMed] [Google Scholar]
- (28).Deng Y, Zhang H, Henion J. Anal. Chem. 2001;73:1432–1439. doi: 10.1021/ac0010328. [DOI] [PubMed] [Google Scholar]
- (29).Gao J, Xu J, Locascio LE, Lee CS. Anal. Chem. 2001;73:2648–2655. doi: 10.1021/ac001126h. [DOI] [PubMed] [Google Scholar]
- (30).Tachibana Y, Otsuka K, Terabe S, Arai A, Suzuki K, Nakamura S. J. Chromatogr. A. 2003;1011:181–192. doi: 10.1016/s0021-9673(03)01181-6. [DOI] [PubMed] [Google Scholar]
- (31).Sung W-C, Huang S-Y, Liao P-C, Lee G-B, Li C-W, Chen S-H. Electrophoresis. 2003;24:3648–3654. doi: 10.1002/elps.200305623. [DOI] [PubMed] [Google Scholar]
- (32).Dahlin AP, Bergström SK, Andrén PE, Markides KE, Bergquist J. Anal. Chem. 2005;77:5356–5363. doi: 10.1021/ac050495g. [DOI] [PubMed] [Google Scholar]
- (33).Hoffmann P, Häusig U, Schulze P, Belder D. Angew. Chem. Int. Ed. 2007;46:4913–4916. doi: 10.1002/anie.200605152. [DOI] [PubMed] [Google Scholar]
- (34).Li J, Wang C, Kelly JF, Harrison DJ, Thibault P. Electrophoresis. 2000;21:198–210. doi: 10.1002/(SICI)1522-2683(20000101)21:1<198::AID-ELPS198>3.0.CO;2-V. [DOI] [PubMed] [Google Scholar]
- (35).Thorslund S, Lindberg P, Andrén PE, Nikolajeff F, Bergquist J. Electrophoresis. 2005;26:4674–4683. doi: 10.1002/elps.200500338. [DOI] [PubMed] [Google Scholar]
- (36).Severs JC, Harms AC, Smith RD. Rapid Commun. Mass Spectrom. 1996;10:1175–1178. doi: 10.1002/(SICI)1097-0231(19960610)10:8<919::AID-RCM597>3.0.CO;2-8. [DOI] [PubMed] [Google Scholar]
- (37).Lazar IM, Ramsey RS, Jacobson SC, Foote RS, Ramsey JM. J. Chromatogr. A. 2000;892:195–201. doi: 10.1016/s0021-9673(00)00335-6. [DOI] [PubMed] [Google Scholar]
- (38).Yue GE, Roper MG, Jeffery ED, Easley CJ, Balchunas C, Landers JP, Ferrance JP. Lab on a Chip. 2005;5:619–627. doi: 10.1039/b502446c. [DOI] [PubMed] [Google Scholar]
- (39).Ramsey RS, Ramsey JM. Anal. Chem. 1997;69:1174–1178. doi: 10.1021/ac971475k. [DOI] [PubMed] [Google Scholar]
- (40).Zhang B, Foret F, Karger BL. Anal. Chem. 2000;72:1015–1022. doi: 10.1021/ac991150z. [DOI] [PubMed] [Google Scholar]
- (41).Deng Y, Henion J, Li J, Thibault P, Wang C, Harrison DJ. Anal. Chem. 2001;73:639–646. doi: 10.1021/ac0009346. [DOI] [PubMed] [Google Scholar]
- (42).Kameoka J, Craighead HG, Zhang H, Henion J. Anal. Chem. 2001;73:1935–1941. doi: 10.1021/ac001533t. [DOI] [PubMed] [Google Scholar]
- (43).Sikanen T, Tuomikoski S, Ketola RA, Kostiainen R, Franssila S, Kotiaho T. Anal. Chem. 2007;79:9135–9144. doi: 10.1021/ac071531+. [DOI] [PubMed] [Google Scholar]
- (44).Bousse L, Stults JT. 6,803,568. U.S. Patent. 2004
- (45).Zhao M, Blaga I, Bousse L, Stults J, Ni J. 7,105,812. U.S. Patent. 2006
- (46).Kelly RT, Page JS, Luo Q, Moore RJ, Orton DJ, Tang K, Smith RD. Anal. Chem. 2006;78:7796–7801. doi: 10.1021/ac061133r. [DOI] [PMC free article] [PubMed] [Google Scholar]
- (47).Haubert K, Drier T, Beebe D. Lab Chip. 2006;6:1548–1549. doi: 10.1039/b610567j. [DOI] [PubMed] [Google Scholar]
- (48).Kelly RT, Page JS, Tang K, Smith RD. Anal. Chem. 2007;79:4192–4198. doi: 10.1021/ac062417e. [DOI] [PubMed] [Google Scholar]
- (49).Page JS, Kelly RT, Tang K, Smith RD. J. Am. Soc. Mass Spectrom. 2007;18:1582–1590. doi: 10.1016/j.jasms.2007.05.018. [DOI] [PubMed] [Google Scholar]
- (50).Shaffer SA, Prior DC, Anderson GA, Udseth HR, Smith RD. Anal. Chem. 1998;70:4111–4119. doi: 10.1021/ac9802170. [DOI] [PubMed] [Google Scholar]
- (51).Duffy DC, McDonald JC, Schueller OJA, Whitesides GM. Anal. Chem. 1998;70:4974–4984. doi: 10.1021/ac980656z. [DOI] [PubMed] [Google Scholar]
- (52).Fernández de la Mora J, Loscertales IG. J. Fluid Mech. 1994:155–184. [Google Scholar]
- (53).Cloupeau M, Prunet-Foch B. J. Electrostatics. 1990;25:165–184. [Google Scholar]
- (54).Nemes P, Marginean I, Vertes A. Anal. Chem. 2007;79:3105–3116. doi: 10.1021/ac062382i. [DOI] [PubMed] [Google Scholar]
- (55).Marginean I, Nemes P, Vertes A. Phys. Rev. E. 2007;76:026320. doi: 10.1103/PhysRevE.76.026320. [DOI] [PubMed] [Google Scholar]
- (56).Marginean I, Kelly RT, Page JS, Tang K, Smith RD. Anal. Chem. 2007;79:8030–8036. doi: 10.1021/ac0707986. [DOI] [PMC free article] [PubMed] [Google Scholar]
- (57).Valaskovic GA, Murphy JP, Lee MS. J. Am. Soc. Mass Spectrom. 2004;15:1201–1215. doi: 10.1016/j.jasms.2004.04.033. [DOI] [PubMed] [Google Scholar]
- (58).Kriger MS, Cook KD, Ramsey RS. Anal. Chem. 1995;67:385–389. doi: 10.1021/ac00098a025. [DOI] [PubMed] [Google Scholar]
- (59).López-Herrera JM, Barrero A, Boucard A, Loscertales IG, Márquez M. J. Am. Soc. Mass Spectrom. 2004;15:253–259. doi: 10.1016/j.jasms.2003.10.018. [DOI] [PubMed] [Google Scholar]
- (60).Hayati I, Bailey AI, Tadros TF. J. Colloid Interface Sci. 1987;117:205–221. [Google Scholar]
- (61).Hayati I, Bailey A, Tadros TF. J. Colloid Interface Sci. 1987;117:222–230. [Google Scholar]
- (62).Huie CW. Electrophoresis. 2003;24:1508–1529. doi: 10.1002/elps.200305396. [DOI] [PubMed] [Google Scholar]
- (63).Mukhopadhyay R. Anal. Chem. 2007;79:3248–3253. doi: 10.1021/ac071903e. [DOI] [PubMed] [Google Scholar]
- (64).Lee JN, Park C, Whitesides GM. Anal. Chem. 2003;75:6544–6554. doi: 10.1021/ac0346712. [DOI] [PubMed] [Google Scholar]
- (65).Hu SW, Ren XQ, Bachman M, Sims CE, Li GP, Allbritton N. Anal. Chem. 2002;74:4117–4123. doi: 10.1021/ac025700w. [DOI] [PubMed] [Google Scholar]
- (66).Xiao DQ, Van Le T, Wirth MJ. Anal. Chem. 2004;76:2055–2061. doi: 10.1021/ac035254s. [DOI] [PubMed] [Google Scholar]
- (67).Roman GT, Hlaus T, Bass KJ, Seelhammer TG, Culbertson CT. Anal. Chem. 2005;77:1414–1422. doi: 10.1021/ac048811z. [DOI] [PubMed] [Google Scholar]
- (68).Vickers JA, Caulum MM, Henry CS. Anal. Chem. 2006;78:7446–7452. doi: 10.1021/ac0609632. [DOI] [PubMed] [Google Scholar]
- (69).Smith RD, Barinaga CJ, Udseth HR. Anal. Chem. 1988;60:1948–1952. [Google Scholar]


