

Abstract
The plasma proteome is a complex mixture of over 3000 proteins that has been routinely exploited by physicians for clinical diagnostic assays. More recently, the low abundance region of the proteome has been examined for potential biomarkers of disease. A novel calorimetric assay has been developed that exploits a new physical basis with which to interrogate the plasma proteome. This section provides a brief overview of the use of the plasma proteome in clinical diagnosis and biomarker discovery and then introduces the new calorimetric assay. Some initial results are reported that indicate the potential clinical utility of the assay.
Keywords: Plasma proteome, thermal stability, differential scanning calorimetry, clinical diagnosis, biomarker
Introduction
The human plasma proteome is routinely exploited by clinicians as an indicator of patient health. Measurement of plasma protein concentrations by FDA approved diagnostic assays, including serum protein electrophoresis and a number of immunochemical assays, are considered to be an important clinical assessment tool since the interrelationship between these proteins can be an indicator of infection, inflammation or the progression of diseases and pathophysiological processes [1, 2]. These assays monitor concentrations of the most abundant, and most readily detectable, plasma proteins. It is current opinion that the plasma proteome contains over 3000 individual proteins and peptides ranging in concentration from picograms to tens of milligrams per milliliter [3-5]. However, very few proteins dominate the plasma proteome: ten proteins constitute 90 % of the mass of plasma (by weight), with another 12 accounting for a further 9 %. It is therefore apparent that considerable information exists in the remaining 1 % and there has been much effort directed towards the study of these low abundance plasma components.
Mass spectrometry [6-10] and 2-D electrophoresis methods [11, 12] have been successfully applied to identify less abundant, low molecular weight proteins and peptides in plasma that seem to correlate with particular diseases. The low molecular weight region of plasma, dubbed the “peptidome”, is of interest as a potentially rich source of unexploited diagnostic information [13, 14]. However, it has become apparent that proteomic studies of the peptidome are complicated by the concept of the “interactome”, where many components of the peptidome, including potential biomarkers, are found to be complexed with the more abundant plasma proteins [15]. In this section we will introduce a novel calorimetric assay that provides a new window through which to study the properties of the plasma/serum proteome. Calorimetry offers a new physical basis with which to view the proteome, one based on thermal stability. It is hoped that our calorimetric approach can complement existing electrophoresis and mass spectrometry approaches that separate plasma based on protein size and charge. Calorimetry not only provides a unique thermodynamic signature for an individual protein but is also exquisitely sensitive to binding interactions, being particularly amenable to the study of protein-protein and protein-peptide interactions of the “interactome”.
The Plasma Proteome
Normal ranges of the major plasma proteins are well known and frequently used for routine clinical diagnostic tests. The protein mass of plasma is dominated by a small number of proteins. Albumin constitutes approximately half of plasma, with IgG contributing another 10 %. In total, ten proteins contribute 90 % of the mass of plasma and a further 12 proteins account for an additional 9 %. FDA approved serum protein electrophoresis, SPE, is commonly used in the initial evaluation for numerous clinical conditions [1, 2]. SPE separates the proteins in plasma on the basis of their net charge, size and shape into five distinct bands representing albumin, alpha1, alpha2, beta and gamma globulins. The positions of the major plasma proteins and the effects of various maladies are well known and SPE can be an informative initial clinical assay. For example, albumin is decreased under conditions causing a loss of circulating albumin or a decrease in its production by the liver: examples include liver disease, malnutrition, pregnancy or renal loss resulting from nephrotic syndrome. The level of immunoglobulins, generally observed in the gamma region, is of much clinical interest as an indicator of disease. A number of conditions can cause an increase in the gamma region but some diseases are characterized by the appearance of a distinctive spike in this region corresponding to the presence of a monoclonal immunoglobulin, or M protein, and can be indicative of potential malignancies [2]. SPE information can be coupled with immunochemical assays to determine levels of a specific protein observed within a population of proteins in a given electrophoresis band. The specificity of antibody-antigen interactions underpin the use of immunochemical assays as another FDA approved clinical diagnostic assay, but it is important to be aware that differences in the microheterogeneity of samples and calibrators can sometimes contribute to inaccuracies in immunochemical data.
Both SPE and immunochemical assays offer low-to-moderate resolution of the plasma/serum proteome. In order to dig deeper and shift the focus towards detecting changes earlier in the course of the progress of a disease it is necessary to develop new methods to look at the plasma proteome. Efforts to this end have been ongoing in the guise of 2-D electrophoresis [1, 2] and mass spectrometry [6-10] methods that have focussed on interrogating the 1 % of the plasma proteome that hold the low abundance proteins. If the current estimate that plasma contains over 3000 proteins is accurate then this 1 % holds a great deal of information. Encouragingly, these studies have shown that changes in the composition of the low abundant proteins and peptides in plasma appear to correlate with particular diseases. The changes observed typically seem to involve numerous proteins; particular diseases appeared to be characterized by differences in the patterns of panels of low abundance proteins or peptides with no single protein identified as a reliable biomarker for a specific disease. Much work has focussed on the low molecular weight region of the plasma proteome, the peptidome, which has been touted as a “treasure trove of diagnostic information that has largely been ignored…” [13, 14]. These studies have also revealed that many components of the peptidome are complexed with higher abundance proteins, such as albumin and the immunoglobulins. It is clear that protein-protein and protein-peptide interactions, the “interactome”, will have much importance alongside studies exploring the nature of the peptidome [15]. A further complexity of studying the low abundance region of the plasma proteome lies in the need to invoke prefractionation protocols to remove the high abundance proteins from plasma/serum, commonly employing immunoaffinity columns. A concern with this approach is the potential to remove low molecular weight proteins or peptides that are bound to high abundance carrier proteins, such as HSA, an undesirable consequence of the interactome concept in action. We have developed a novel calorimetric assay to explore a different physical basis of the plasma proteome. The assay examines changes in the higher abundance proteins, removing the complication of prefractionation protocols, and is exquisitely sensitive to binding interactions. Initial results have demonstrated that the assay provides a unique signature for a number of disease states.
Biological Calorimetry
Calorimetry directly measures the heat changes accompanying chemical reactions or physical changes. In studying the plasma proteome we are specifically applying the method of differential scanning calorimetry [16-20] to monitor the heat changes as a function of temperature that are associated with the thermally-induced denaturation of the proteins in plasma. A schematic of a differential scanning calorimeter (DSC) is shown in Figure 1.
Figure 1.
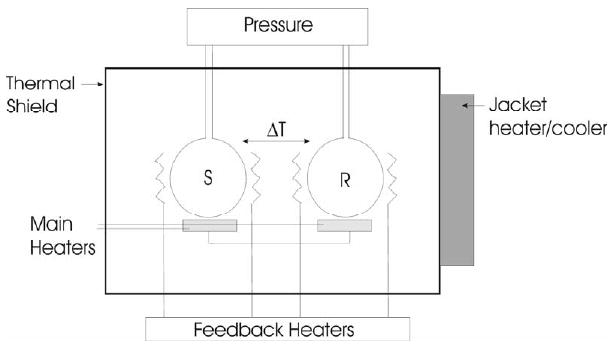
Schematic of a typical DSC. The sample (S) and reference (R) cells are kept in thermal balance by heaters controlled by feedback electronics as both cells are heated at a precisely controlled rate.
During a DSC experiment the thermal balance between two cells containing an aqueous solution of a sample of interest and a reference buffer are monitored as both are heated at a constant rate. Any processes that occur in the sample cell that absorb or release heat will result in a thermal imbalance between the cells that requires compensation by electrically powered feedback heaters attached to the cells. This power signal provides a direct measurement of the heat capacity changes accompanying thermally-induced processes. The output of a DSC experiment is in the form of a thermogram which reflects the fundamental physical properties of a sample.
Every protein has, under a given set of solution conditions, a characteristic denaturation thermogram which provides a unique signature for that protein. A thermogram is very informative. There may be a single “peak” essentially Gaussian in shape reflecting a simple two-state melting (Figure 2A). Actual thermograms are not necessarily as simple and might exhibit an asymmetric, skewed profile reflecting a more complex multimodal melting (Figure 2B – HSA) or multiple peaks corresponding to the melting of individual structural domains within the tertiary structure of a structurally complex protein (Figure 2B – Fibrinogen). The area under the thermogram directly yields the denaturation enthalpy and its midpoint indicates the melting temperature, unique properties for a given protein. A thermogram can be integrated to yield a transition (or melting) curve from which the fractions of folded and unfolded forms can be calculated.
Figure 2.
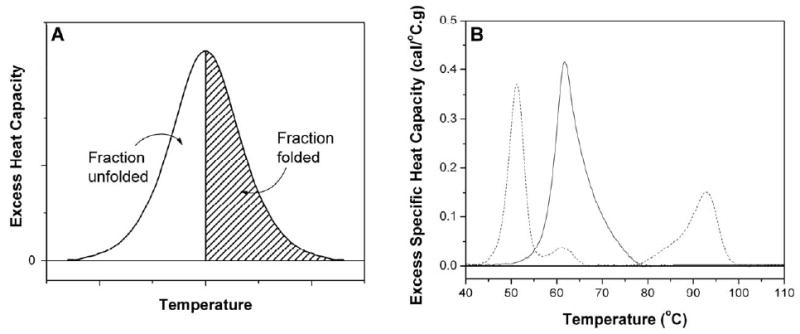
(Panel A) A typical thermogram seen for the two-state denaturation of a protein. The area under the thermogram directly yields the denaturation enthalpy and its midpoint indicates the melting temperature. Integration yields a transition curve from which the fractions of folded and unfolded forms can be calculated. (Panel B) Experimental thermograms for HSA (solid line) and fibrinogen (dashed line).
A strength of the calorimetric method is the ability to use unlabeled, underivatized and unfractionated samples. Only limited sample handling is necessary. Small volumes of serum/plasma (100 microliters or less) are dialyzed at 4 °C against a standard phosphate buffer in order to ensure complete solvent exchange, then diluted 25-fold to obtain a suitable sample concentration for analysis. Samples are then run in the DSC to obtain a thermogram, which is normalized to a g/L protein scale after determining the total protein concentration using standard colorimetric methods.
The physical principle on which DSC is based makes it extremely sensitive to binding interactions. When a ligand recognizes and binds to a site on a native protein it will stabilize it towards denaturation, resulting in an increase in the melting temperature. Conversely, if a ligand has a greater affinity for the denatured form of the protein a decrease in melting temperature will be observed. Methods exist for the determination of quantitative binding interactions from DSC data [17, 21]. The ability to precisely define binding interactions is critical in investigating the “interactome” concept. The basis of the interactome concept is the increase in concentration of low molecular weight proteins or peptides in plasma or serum in response to a disease state, which then bind to high abundance carrier proteins, such as albumin or the immunoglobulins. These binding interactions would have a profound effect on the thermal denaturation of these high abundance carrier proteins. The effect of ligand binding on the denaturation thermogram of a protein can have dramatic effects, shifts of tens of degrees in melting temperature, is likely to be much more significant than the small changes in size, shape or charge resulting from the binding of a small ligand to a large receptor observed by electrophoresis or mass spectrometry methods.
The calorimetric assay is fundamentally interesting as it provides a monitor of a different physical property of the proteome. The other techniques of electrophoresis and mass spectrometry that have seen much application in the study of the plasma proteome are based on charge, size and shape; calorimetry monitors thermal stability, an entirely different and unique physical property of a protein. It is our belief that our novel calorimetric approach can prove to be a useful tool to characterize the plasma proteome, providing a new analysis window and a useful complement to existing techniques.
A Calorimetric Assay for Clinical Diagnosis
The calorimetric assay described in this section has the potential to be useful as a clinical diagnostic. The assay is quantitative and sensitive both to changes in concentration and binding interactions involving the major plasma proteins. Changes in concentration of plasma proteins are an important clinical diagnostic, being routinely monitored by serum protein electrophoresis. Initial results from the calorimetric assay suggest that calorimetry might provide a more sensitive examination of the plasma proteome than the standard FDA approved SPE assay. Although the calorimetric assay does not directly observe the denaturation of low abundance, low molecular weight biomarkers, it does observe the consequence of their interactions with the major plasma proteins through modification of the denaturation properties of these abundant proteins.
As a first step in the application of the calorimetric assay in defining the nature of the plasma proteome for diseased states, it is necessary to determine the nature of a “normal” thermogram. To this end we obtained thermograms from 15 normal individuals following the procedure described above. The results are shown in Figure 3.
Figure 3.
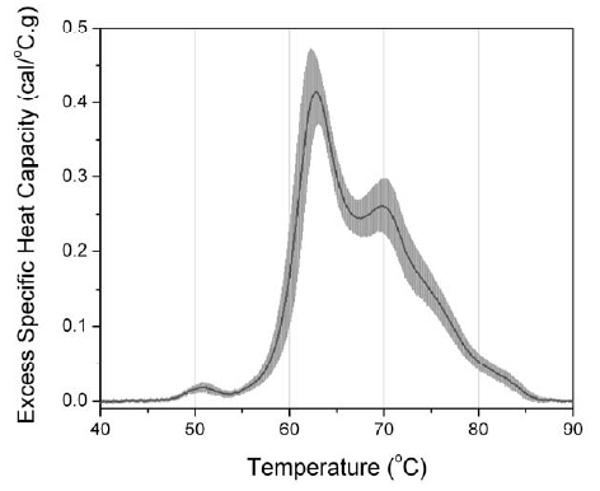
Average thermogram of plasma calculated from samples obtained from 15 normal individuals. The average thermogram is the black solid line, and the standard deviation at each temperature is indicated by the gray shading.
The black trace depicts the average thermogram and the standard deviation from the mean is shown by the gray shaded region. These results are important in establishing the reproducibility and uncertainty in the plasma thermogram. Thermograms from normal individuals appear to be highly reproducible with a range of normal values that compare well to existing clinical assays such as SPE or immunochemical analyses. These data also clearly indicate the range of normal values that are important for defining particular diseased states.
Plasma and serum from individuals suffering from a number of different diseases, including cervical cancer, ovarian and endometrial cancers, melanoma, Lyme disease, systemic lupus erythematosus and rheumatoid arthritis, have been analyzed using the calorimetric assay (data not shown; manuscript in preparation). The resulting thermograms all differ from “normal” and, in the cases examined so far, yield a thermogram that is distinct for each disease. These preliminary results indicate that this assay has potential clinical utility. To illustrate this utility, results from the calorimetric assay will be shown here for four serum samples taken from a study examining biomarker peptides associated with coronary artery disease in diabetic hemodialysis patients (Merchant, ML and Klein J, unpublished results). The samples were from two diabetic patients with minimal coronary artery disease (CAD-) and two with severe coronary artery disease (CAD+). The status of the patients' coronary arteries hade been defined during screening cardiac catheterization as part of their kidney transplant evaluation. The samples were run blind after being supplied to us having been de-identified. Thermograms for all four samples are shown in Figure 4.
Figure 4.
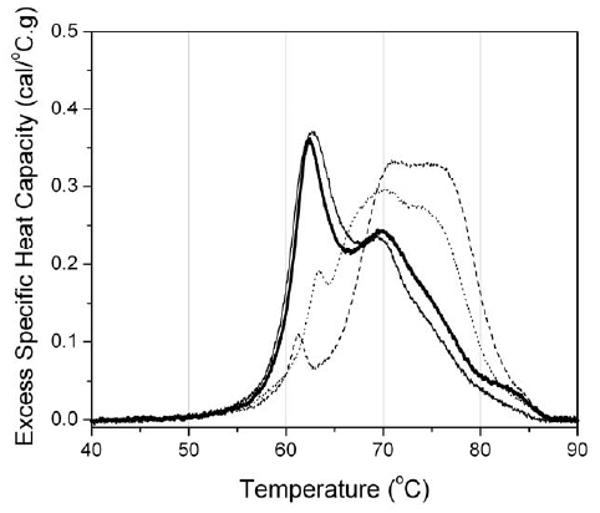
Thermograms determined from serum samples obtained from diabetic patients with either minimal (CAD-) or severe (CAD+) coronary artery disease. The black and heavy black lines correspond to CAD- patients and the dashed and dotted lines to CAD+ patients.
The results clearly show two distinct shapes of thermogram. The black and heavy black traces have shapes similar to the “normal” thermogram shown in Figure 3 and were subsequently identified as being from CAD- patients. The dashed and dotted traces were from CAD+ patients. Similarly distinct deviations from the “normal” thermogram have been obtained for a number of other disease states and we are in the process of compiling a disease thermogram database. In many cases the results from the calorimetric assay have been compared with the FDA approved SPE assay. For these samples, there are either little or no detectable changes in the SPE pattern for the diseased sample compared to the SPE pattern for a normal individual. The calorimetric assay appears to provide significantly greater sensitivity. The results obtained so far indicate that the calorimetric assay has utility as a clinical diagnostic and efforts to develop the assay are ongoing.
Summary and Future Direction
The plasma proteome is being intensively examined for indicators of disease. Currently, much interest is focussed on mining the mostly un-probed population of low abundance proteins and peptides in plasma with the prospect of identifying changes in this population or biomarkers that correlate with the progress of disease. We have explored an alternative approach, developing a novel calorimetric assay to examine the high abundance population of the plasma proteome. Initial results from the calorimetric assay are very encouraging, with patterns identified for different disease states that are both distinct from normal individuals and, so far, unique for each disease state. The thermograms are qualitatively dramatic, but in order to provide more detailed information about the changes in the plasma proteome it is necessary to attempt a deconvolution of the thermogram in terms of both changes in the concentration of the major proteins and the effect of binding interactions. Work has already begun to address this issue as well as to expand the taxonomy of diseases, in particular early stage disease, to investigate the range of clinical utility of the calorimetric assay.
Acknowledgments
This work was supported by grant R44 CA103437 from the National Cancer Institute to J. B. C. We would like to thank Dr. Jon Klein and Dr. Mike Merchant for generously providing the coronary artery disease samples.
Footnotes
Publisher's Disclaimer: This is a PDF file of an unedited manuscript that has been accepted for publication. As a service to our customers we are providing this early version of the manuscript. The manuscript will undergo copyediting, typesetting, and review of the resulting proof before it is published in its final citable form. Please note that during the production process errors may be discovered which could affect the content, and all legal disclaimers that apply to the journal pertain.
References
- 1.Craig W, Ledue T, Ritchie R. Plasma Proteins: Clinical Utility and Interpretation. Scarborough, ME, Foundation for Blood Research. 2004 [Google Scholar]
- 2.O'Connell TX, Horita TJ, Kasravi B. Understanding and interpreting serum protein electrophoresis. Am Fam Physician. 2005;71:105–112. [PubMed] [Google Scholar]
- 3.Anderson NL, Anderson NG. The human plasma proteome: history, character, and diagnostic prospects. Mol Cell Proteomics. 2002;1:845–867. doi: 10.1074/mcp.r200007-mcp200. [DOI] [PubMed] [Google Scholar]
- 4.Anderson NL, Polanski M, Pieper R, et al. The human plasma proteome: a nonredundant list developed by combination of four separate sources. Mol Cell Proteomics. 2004;3:311–326. doi: 10.1074/mcp.M300127-MCP200. [DOI] [PubMed] [Google Scholar]
- 5.Omenn GS, States DJ, Adamski M, et al. Overview of the HUPO Plasma Proteome Project: results from the pilot phase with 35 collaborating laboratories and multiple analytical groups, generating a core dataset of 3020 proteins and a publicly-available database. Proteomics. 2005;5:3226–3245. doi: 10.1002/pmic.200500358. [DOI] [PubMed] [Google Scholar]
- 6.Anderson NL. The roles of multiple proteomic platforms in a pipeline for new diagnostics. Mol Cell Proteomics. 2005;4:1441–1444. doi: 10.1074/mcp.I500001-MCP200. [DOI] [PubMed] [Google Scholar]
- 7.Gygi SP, Aebersold R. Mass spectrometry and proteomics. Curr Opin Chem Biol. 2000;4:489–494. doi: 10.1016/s1367-5931(00)00121-6. [DOI] [PubMed] [Google Scholar]
- 8.Liotta LA, Kohn EC, Petricoin EF. Clinical proteomics: personalized molecular medicine. JAMA. 2001;286:2211–2214. doi: 10.1001/jama.286.18.2211. [DOI] [PubMed] [Google Scholar]
- 9.Yates IJR. Mass spectrometry. From genomics to proteomics. Trends Genet. 2000;16:5–8. doi: 10.1016/s0168-9525(99)01879-x. [DOI] [PubMed] [Google Scholar]
- 10.Adkins JN, Varnum SM, Auberry KJ, et al. Toward a human blood serum proteome: analysis by multidimensional separation coupled with mass spectrometry. Mol Cell Proteomics. 2002;1:947–955. doi: 10.1074/mcp.m200066-mcp200. [DOI] [PubMed] [Google Scholar]
- 11.Anderson L, Anderson NG. High resolution two-dimensional electrophoresis of human plasma proteins. Proc Natl Acad Sci USA. 1977;74:5421–5425. doi: 10.1073/pnas.74.12.5421. [DOI] [PMC free article] [PubMed] [Google Scholar]
- 12.Anderson NL, Anderson NG. A two-dimensional gel database of human plasma proteins. Electrophoresis. 1991;12:883–906. doi: 10.1002/elps.1150121108. [DOI] [PubMed] [Google Scholar]
- 13.Liotta LA, Petricoin EF. Serum peptidome for cancer detection: spinning biologic trash into diagnostic gold. J Clin Invest. 2006;116:26–30. doi: 10.1172/JCI27467. [DOI] [PMC free article] [PubMed] [Google Scholar]
- 14.Liotta LA, Ferrari M, Petricoin E. Clinical proteomics: written in blood. Nature. 2003;425:905. doi: 10.1038/425905a. [DOI] [PubMed] [Google Scholar]
- 15.Zhou M, Lucas DA, Chan KC, et al. An investigation into the human serum “interactome”. Electrophoresis. 2004;25:1289–1298. doi: 10.1002/elps.200405866. [DOI] [PubMed] [Google Scholar]
- 16.Biltonen RL, Freire E. Thermodynamic characterization of conformational states of biological macromolecules using differential scanning calorimetry. CRC Crit Rev Biochem. 1978;5:85–124. doi: 10.3109/10409237809177141. [DOI] [PubMed] [Google Scholar]
- 17.Brandts JF, Lin LN. Study of Strong to Ultratight Protein Interactions Using Differential Scanning Calorimetry. Biochemistry. 1990;29:6927–6940. doi: 10.1021/bi00481a024. [DOI] [PubMed] [Google Scholar]
- 18.Bruylants G, Wouters J, Michaux C. Differential scanning calorimetry in life science: thermodynamics, stability, molecular recognition and application in drug design. Curr Med Chem. 2005;12:2011–2020. doi: 10.2174/0929867054546564. [DOI] [PubMed] [Google Scholar]
- 19.Freire E. Differential scanning calorimetry. Methods Mol Biol. 1995;40:191–218. doi: 10.1385/0-89603-301-5:191. [DOI] [PubMed] [Google Scholar]
- 20.Sanchez-Ruiz JM. Differential scanning calorimetry of proteins. Subcell Biochem. 1995;24:133–176. doi: 10.1007/978-1-4899-1727-0_6. [DOI] [PubMed] [Google Scholar]
- 21.Schellman JA. The factors affecting the stability of hydrogen-bonded polypeptide structures in solution. J Phys Chem. 1958;62:1485–1494. [Google Scholar]