

Abstract
Background and rationale:
Glutathione (GSH) provides important anti-oxidant defense and regulates multiple critical processes including fibrogenesis. There is conflicting literature regarding changes in GSH during cholestasis. Here we examined changes in GSH synthetic enzymes during bile duct ligation (BDL) in mice and how treatment with ursodeoxycholic acid (UDCA) and/or S-adenosylmethionine (SAMe) affects the expression of these enzymes and liver injury.
Results:
The hepatic expression of glutamate-cysteine ligase (GCL) subunits and GSH synthase (GS) increased transiently after BDL but fell to 50% of baseline by 2 weeks. Nuclear factor-erythroid 2 related factor 2 (Nrf2) trans-activates gene expression via the antioxidant response element (ARE), which controls the expression of all three genes. Despite increased Nrf2 nuclear levels, Nrf2 nuclear binding to ARE fell 2 weeks after BDL. Nuclear levels of c-Maf and MafG, which can negatively regulate ARE, were persistently induced during BDL and the dominant proteins bound to ARE on day 14. UDCA and SAMe induced the expression of GCL subunits and raised GSH levels. They increased nuclear Nrf2 levels, prevented c-Maf and MafG induction and prevented the fall in Nrf2 nuclear binding to ARE. Combined treatment had additive effects, reduced liver cell death and prevented fibrosis.
Conclusions:
GSH synthesis falls during later stages of BDL due to lower expression of GSH synthetic enzymes. UDCA and SAMe treatment prevented this fall and combined therapy was more effective on preserving GSH levels and preventing liver injury.
Keywords: Bile duct ligation, glutamate-cysteine ligase, anti-oxidant response element, ursodeoxycholic acid, S-adenosylmethionine
INTRODUCTION
Glutathione (GSH) is the main non-protein thiol in mammalian cells that has many critical cellular functions, including defending against oxidative stress and modulating cell growth and death (1). GSH synthesis occurs in the cytosol of all mammalian cells via two enzymatic steps: the formation of γ-glutamylcysteine from glutamate and cysteine catalyzed by glutamate-cysteine ligase (GCL); and the formation of GSH from γ-glutamylcysteine and glycine catalyzed by GSH synthase (GS) (1). GCL, the rate-limiting enzyme, is made up of a catalytic (GCLC) and a modifier (GCLM) subunit (1). Oxidative stress induces a defensive coordinated up-regulation of the GCL subunits and GS (1). Transcription factors that positively regulate the expression of GCL subunits and GS in human and mouse include activator protein-1 (AP-1) and nuclear factor-erythroid 2 related factor 2 (Nrf2) (1). Dysregulation of GSH synthesis has been reported to occur during aging, in diabetes mellitus, drug resistant tumors, and endotoxemia (1,2). Given the importance of GSH in maintaining normal cell function, dysregulation in its synthesis generally worsen the disease process.
Cholestatic liver injury is a major cause of chronic liver disease, which is one of the top 15 causes of death in the United States (3). Chronic retention of toxic bile acids is a major mechanism for cell toxicity by inducing oxidative stress, apoptosis and fibrosis leading to cirrhosis (3-5). Although there is conflicting data, many groups showed a fall in GSH level in either livers of animals subjected to experimental cholestasis or hepatocytes treated with toxic bile acids (1,6-8). This further jeopardizes antioxidant defense and contributes to injury. Some (6,7) but not others (8) showed a fall in GCL activity. One paper reported a fall in both GCLC and GCLM mRNA levels (7). Interestingly, ursodeoxycholic acid (UDCA), the only medication approved by the FDA for the treatment of primary biliary cirrhosis (9), a chronic cholestatic disorder, was shown to prevent the fall in GCL expression during chronic cholestasis (7) and increase GCL expression in cultured rat hepatocytes (10). The molecular mechanism(s) for changes in GCL expression during cholestasis or in response to UDCA treatment remain unknown. Our current investigation examined changes in the expression of the GSH synthetic enzymes during experimental cholestasis induced by bile duct ligation (BDL). We uncovered a transient increase early on, followed by a dramatic fall in the expression of GSH synthetic enzymes at later stages of cholestasis. We also elucidated the molecular mechanism(s) for the fall in expression of these enzymes and provided new information on improving the treatment of cholestatic liver injury.
MATERIALS AND METHODS
Materials
UDCA was obtained from Sigma-Aldrich (St. Louis, MO). S-adenosylmethionine (SAMe) in the form of disulfate p-toluenesulfonate dried powder was generously provided by Gnosis SRL (Cairate, Italy). α-32P-dCTP and γ-32P ATP (3,000 Ci/mmol) was purchased from PerkinElmer (Boston, MA). All other reagents were of analytical grade and obtained from commercial sources.
BDL in mice
Three-month old male C57/B6 mice were fed chow ad libitum, and housed at constant temperature (22°C) with alternating 12 hours of light and darkness. The mouse procedure protocols, use and the care of the animals were reviewed and approved by the Institutional Animal Care and Use Committee at the University of Southern California. Following intraperitoneal injection of ketamine (80mg/kg) and xylazine (10mg/kg), the common bile duct was exposed through a midline abdominal incision, ligated in two places with a silk thread and sectioned between the ligatures. Sham operated mice had anesthesia and laparotomy only. Mice were sacrificed on day 0, 1, 3, 7, 10, 14, 21 or 28 days post surgery and livers were harvested for studies described below.
UDCA and SAMe treatment in BDL mice
UDCA (10 to 200mg/kg/day in 0.1ml 2.5% sodium bicarbonate, pH 7.4) was given by gavage once per day. SAMe was given at the dose of 100mg/kg/day (in 0.1ml Tris buffer, pH 7.4) by gavage once per day. This dose was chosen as we showed 50mg/kg of SAMe given intraperitoneally every 12 hours for 3 doses protected against the lipopolysaccharide-induced fall in GCLC and GCLM expression (2). Following BDL, mice received either vehicle, UDCA, SAMe or UDCA plus SAMe for up to 28 days.
Necrosis, apoptosis, and fibrosis determination in liver specimens
Formalin-fixed liver tissues embedded in paraffin were cut and stained with hematoxylin and eosin (H&E) for the evaluation of necrosis. The percentage of necrosis was estimated by counting the number of microscopic fields with necrosis compared to the entire section in 15 different sections at 100X magnification. For apoptosis, tissue sections were stained with Terminal deoxynucleotidyl transferase (TdT)-mediated dUTP-digoxigenin nick-end labeling (TUNEL) according to the manufacturer's (In situ cell death detection kit, Roche) suggested protocol. Five random fields containing an average of 250 nuclei were counted for each TUNEL-stained tissue sample. The apoptotic index (percentage of apoptotic nuclei) of hepatocytes was calculated as (apoptotic nuclei/total nuclei) ×100%. Samples from at least three mice per treatment condition were scored. Fibrosis was determined by staining with 0.1% Sirius red (Sigma, St. Louis, MO) and quantified using a computer-assisted image analysis system (MetaMorph imaging system; Universal Imaging Corporation, Downingtown, PA) and expressed as stained area per total examined area (11).
Mouse hepatocyte isolation and apoptosis determination
Mouse hepatocytes were isolated by the Cell Culture Core of the USC Research Center for Liver Diseases. Hepatocytes were centrifuged and purified through Percoll, as previously described (12). Hepatocyte viability was detected by trypan blue exclusion. Apoptosis was determined in hepatocytes isolated from various days following BDL by DNA fragmentation as we described (13).
RNA isolation and gene expression analysis
Total RNA was isolated by the TRIzol reagent (Invitrogen) from liver tissues. Northern blot analysis, autoradiography and densitometry were done as previous described (14-16). The mouse specific cDNA probes for Northern blot include: GCLC - nucleotides 120-610 (NM_010295); GCLM - nucleotides 411-905 (NM_008129); GS - nucleotides 181-695 (NM_008131); c-Fos - nucleotides 243-791(NM_010234); c-Jun-nucleotide 957-1441 (NM_010591); p50 - nucleotide 541-981 (NM_008689); p65 - nucleotide 541-1051 (NM_009045); Nrf1 – nucleotides 301-847 (NM_010938); and Nrf2- nucleotides 251-1020 (NM_010902). Specific GCLC, GCLM, GS, c-Fos, c-Jun, p50, p65, Nrf1, Nrf2 and β-actin probes were labeled with [32P]dCTP using a random-primer kit (RediPrime DNA Labeling System; Amersham Pharmacia Biotech) as described (14-16). Results of Northern blot analysis were normalized to β-actin.
Quantitative real-time polymerase chain reaction (PCR) was used to measure collagen type I, alpha 2 (Col1A2) mRNA levels as described (2). The primers and TaqMan probes for Col1A2 and Universal PCR Master Mix were purchased from ABI (Foster City, CA). 18SrRNA was used as housekeeping genes as described (2). The delta Ct obtained was used to find the relative expression of Col1A2 according to the formula: relative expression=2−DDCt, where DDCt= DCt of Col1A2 in experimental groups − DCt of Col1A2 in control group.
Western blot analysis of liver tissues and hepatocytes from BDL mice
Liver tissues and hepatocytes isolated from BDL mice were subjected to Western blot analysis as described (15,16). Nuclear protein was isolated from liver tissues as described (16,17). Equal amounts of total protein extracts (15 μg/well) were resolved on 12.5% SDS–polyacrylamide gels. Membranes were probed with antibodies to GCLC, GCLM (Novus Biologicals, Littleton, CO), GS, c-Jun, c-Fos, p50, p65, Nrf1, Nrf2, c-Myc, c-Maf, MafB, MafF, Bach1 (Santa Cruz Biotechnology, Santa Cruz, CA), MafK, and MafG (R&D Systems, Minneapolis, MN). To ensure equal loading, membranes were stripped and re-probed with anti-actin or anti-Histone 3 antibodies (Santa Cruz Biotechnology, Santa Cruz, CA) for total versus nuclear protein levels, respectively. Blots were developed by enhanced chemiluminescence (Millipore Corporation, Billerica, MA).
Electrophoretic mobility shift assay and supershift assay
EMSAs were done as described previously (16). The probe was 32P-end-labeled double-stranded ARE DNA fragment (CTGGAAGACAATGACTAAGCAGAAA), corresponding to −315 to −339 bp relative to the translation start codon of mouse GCLM (NM_008129), with the core ARE sequence underlined. Supershift assays confirmed the identity of the binding proteins using antibodies to Nrf1, Nrf2, c-Maf, MafK, MafF, MafB, MafG, or Bach1 (Santa Cruz Biotechnology Inc., Santa Cruz, CA or R&D Systems, Minneapolis, MN) as we described (16).
Hepatic GSH levels
Serum alkaline phosphatase (ALP), bilirubin and Alanine Transaminase (ALT) levels
Serum ALP, bilirubin (Thermo Electron Corp., Waltham, MA) and ALT (RAICHEM, San Marcos, CA) levels were measured following manufacturers' instruction.
Statistical Analysis
Data are given as mean ± standard error of the mean (SEM). Statistical analysis was performed using analysis of variance followed by Fisher's test for multiple comparisons. For changes in mRNA and protein levels, ratios of genes or proteins to housekeeping genes or proteins densitometric values were compared. Significance was defined by p<0.05.
RESULTS
Changes in the expression of GSH synthetic enzymes during BDL
The mRNA (Fig. 1A) and protein (Fig. 1B) levels of hepatic GCLC, GCLM and GS exhibited a transient increase from day 1 to 7 after BDL, followed by a fall to below baseline by day 14 that persist to day 28. To see if the change in liver expression of these genes is occurring in hepatocytes, hepatocytes were isolated after BDL and purified by centrifugation through Percoll. After Percoll purification, 75-95% of the isolated hepatocytes were viable as estimated by trypan blue staining. Figure 1C shows that the protein levels of GCLC, GCLM and GS in hepatocytes exhibit a very similar pattern as whole liver with an early increase followed by a fall to 50% of baseline or lower.
Figure 1.
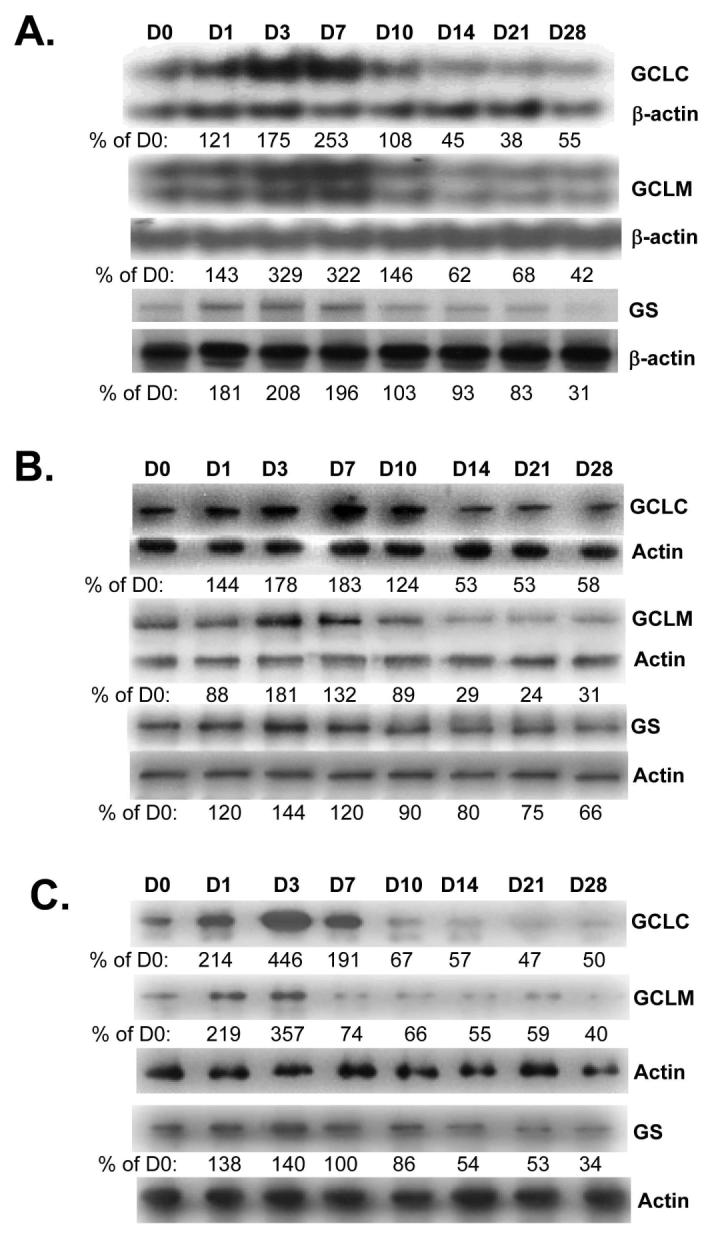
Effect of BDL on mRNA (part A) and protein (part B) levels of GCLC, GCLM and GS in liver tissues. RNA and protein were isolated from liver tissues of BDL mice from day 0 to day 28 for Northern or Western blot analyses (15 μg RNA or protein/lane). Membranes were stripped and re-probed with β-actin for Northern or actin for Western to ensure equal loading. Part C) Effects of BDL on protein levels of GCLC, GCLM and GS in hepatocytes isolated from BDL mice from day 0 to 28 post operation. Membranes were stripped and re-probed with actin to ensure equal loading. Representative blots from at least 3 mice for each time point are shown for all and the values below the blots are densitometric values expressed as % of day 0 for these blots. See Supplemental Table 1 for summary of densitometric values from all blots.
Expression of transcription factors important for expression of GSH synthetic enzymes during BDL
We next examined changes in the expression of transcription factors important in the regulation of GCLC, GCLM and GS, namely Nrf1, Nrf2, AP-1, NFκB and c-Myc (1,14-17). Figure 2A shows that c-Fos and c-Jun mRNA levels increased rapidly but returned toward baseline by day 14. NFκB family members p50 and p65 mRNA levels also increased following BDL but peaked later and remained elevated. Nrf1 mRNA levels remained unchanged throughout BDL time course whereas Nrf2 mRNA levels increased later around day 7 but was back to baseline by day 10. Although Nrf1 and Nrf2 showed little change in mRNA levels, the nuclear protein levels were increased from day 1 to day 14 and fell back to baseline from day 21 to 28 (Fig. 2B). c-Myc protein levels increased by day 3 and remained elevated throughout the 28 days. Protein levels of c-Fos, c-Jun, p50 and p65 largely changed in parallel to their mRNA levels (Fig. 2B).
Figure 2.
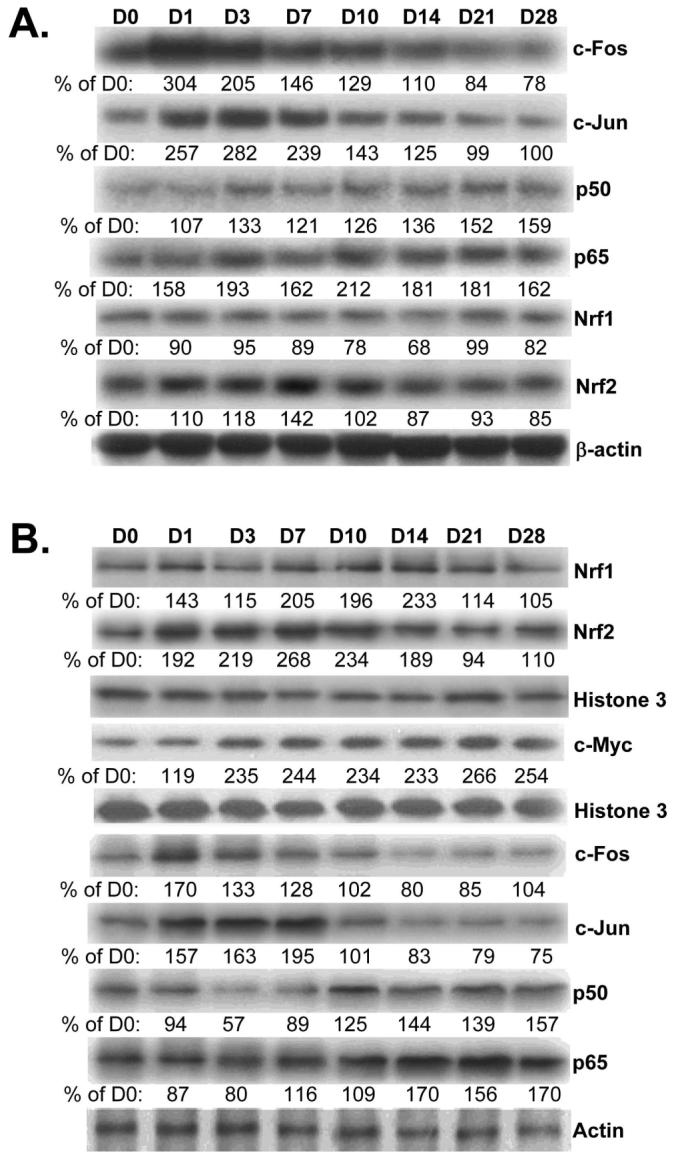
Effect of BDL on mRNA (part A) and protein (part B) levels of transcription factors important for GSH synthetic enzymes in liver tissues. RNA, total or nuclear protein were isolated from liver tissues of BDL mice from day 0 to day 28 for Northern (15μg/lane) or Western blot analyses (15μg/lane). Membranes were stripped and re-probed with β-actin (for Northern), Histone 3 (for nuclear protein Western) or actin (for total protein Western) to ensure equal loading. Representative blots from at least 3 mice for each time point are shown for all and the values below the blots are densitometric values expressed as % of day 0 for these blots. See Supplemental Table 2 for summary of densitometric values from all blots.
ARE binding activity during BDL
One of the most important cis-acting elements present in the promoter of all three genes is ARE (1). Figure 3A shows that nuclear binding activity to ARE increased rapidly from day 1 to day 7. However, it fell back to baseline by day 10 and was below baseline from day 14 to day 28. At day 3, both Nrf1 and Nrf2 binding to the ARE increased (Fig. 3B) but Nrf2 binding in particular fell markedly by day 14 (Fig. 3C).
Figure 3.

A) Changes in nuclear ARE binding during BDL. EMSA analysis was performed using the mouse GLCM ARE probe as described in Methods and nuclear protein obtained from livers of mice subjected to BDL for 0 to 28 days (15μg nuclear protein/lane). B) Supershift analysis using antibodies against Nrf1 and Nrf2 shows increase in nuclear binding of both (particularly Nrf2) to ARE on day 3 of BDL. C) EMSA and supershift analysis of ARE comparing samples from day 3 and 14 BDL show a fall in ARE nuclear binding activity on day 14, particularly the amount of Nrf2 bound.
Expression and ARE nuclear binding activity of Mafs and Bach1
Nrf2 positively regulates ARE-mediated gene expression (18). However, the effect of its binding partner has been controversial. Both activation and repression of ARE-mediated gene expression have been reported with heterodimers of Nrf2 and small Maf proteins (MafG, MafK, and MafF) (18). Furthermore, homodimers of these small Mafs have also been shown to repress ARE-mediated gene expression (18). In addition, c-Maf, a large Maf protein, and Bach1, a transcription factor that belongs to the cap ‘n’ collar (CNC), b-Zip family, can also repress ARE-mediated gene expression (19,20). We next examined the expression of these proteins and Figure 4A shows that the nuclear protein levels of c-Maf, MafK and MafG increased from day 1 and reached 3- to 4-fold of baseline by day 14 and remained elevated up to day 28. Nuclear protein levels of MafF and Bach1 were essentially unchanged during BDL (Fig. 4A). In terms of proteins that bind to ARE, on day 3 after BDL, while small Mafs, c-Maf and Bach1 were all binding to ARE, the dominant protein bound was Nrf2 (Fig. 4B). On day 14 after BDL, this picture changed so that Nrf2 was a relatively minor protein bound to ARE, while the relative abundance of c-Maf and MafG bound to ARE increased (Fig. 4C).
Figure 4.

A) Effect of BDL on hepatic nuclear protein levels of Maf proteins and Bach1. Nuclear protein were isolated from liver tissues of BDL mice from day 0 to day 28 for Western blot analyses (15μg/lane). Membranes were stripped and re-probed with Histone 3 to ensure equal loading. Representative blots from at least 3 mice for each time point are shown and the values below the blots are densitometric values expressed as % of day 0 for these blots. See Supplemental Table 3 for summary of densitometric values from all blots. B) ARE nuclear binding activity of Nrf2, Maf proteins and Bach 1 on day 3 (15μg nuclear protein per lane) and C), day 14 after BDL. EMSA and supershift analyses of ARE were done as described in Methods using 15 to 25μg of nuclear protein per lane and antibodies against various proteins as indicated. Arrows point to supershifted bands.
Effects of UDCA and SAMe treatment on expression of GSH enzymes and GSH levels during BDL
Apoptosis occurs during BDL (21) and UDCA is known to protect against apoptosis induced by toxic bile acids (22). We verified that this occurs in our model as Figure 5A shows that apoptosis occurs by day 3 in hepatocytes isolated from BDL mice and UDCA administration exerted a dose-dependent protection against apoptosis so that no apoptosis was evident as measured by DNA fragmentation at 100mg/kg/d dose and this was the dose used for all subsequent studies. UDCA administration increased the baseline GCLC and GCLM mRNA levels (compare sham groups in Fig. 5B) and prevented the fall during BDL (Fig. 5B). The ability of UDCA to enhance the expression of GSH synthetic enzymes may or may not have anything to do with its anti-apoptotic effect noted on day 3. Recently we reported that SAMe administration prevented the fall in GCLC and GCLM mRNA levels during endotoxemia (2). We next compared administration of UDCA or SAMe alone or together during BDL. At 14 days after BDL, the protein levels of GCLC and GCLM were about 50% of baseline. Both UDCA and SAMe prevented the fall in GCLC and GCLM protein levels (in fact, they were higher than sham control group) but together exerted additional effect (more than 300% of control) (Fig. 5C). Hepatic GSH levels changed in parallel to changes in GCL. Hepatic GSH levels fell to 50% and 22% of baseline at 14 and 28 days after BDL, respectively, and either UDCA or SAMe treatment alone raised the GSH level above baseline while combination treatment raised the level even higher (Fig. 5D).
Figure 5.

A) Hepatocyte apoptosis following BDL in mice is prevented by UDCA in a dose-dependent manner. Hepatocytes were isolated from mice subjected to BDL at various days and DNA fragmentation was analyzed (left). UDCA (0 to 200mg/kg) was given daily and apoptosis examined at day 3 after BDL (right). B) Effect of UDCA on hepatic GCLC and GCLM protein levels during BDL. Mice were subjected to BDL or sham surgery and received either vehicle or UDCA (100mg/kg/day) for 14 days. GCLC and GCLM protein levels were determined by Western blot analysis. C) Effect of UDCA or SAMe treatment given alone or together on hepatic GCLC and GCLM protein levels during BDL. Mice were subjected to BDL or sham surgery and received either vehicle, UDCA (100mg/kg/day), SAMe (100mg/kg/day), or UDCA plus SAMe (same doses) for 14 days. Hepatic GCLC and GCLM protein levels were determined by Western blot analysis. The graph on the right summarizes changes in densitometric values expressed as mean±SEM from 4 mice per group. *p<0.05 vs. sham group, †p<0.05 vs. BDL group, ††p<0.05 vs. BDL+UDCA or BDL+SAMe groups. D) Effect of UDCA or SAMe treatment on hepatic GSH levels during BDL. Hepatic GSH levels were determined from sham controls and BDL mice treated with UDCA or SAMe or both for 14 or 28 days and expressed as mean±SEM from 8 to 12 mice per group. *p<0.005 vs. sham group, †p<0.05 vs. BDL group, ††p<0.05 vs. BDL+UDCA or BDL+SAMe groups.
Effects of UDCA and SAMe treatment on expression of Mafs, Nrf2 and ARE binding
To see if UDCA and SAMe affect the expression GSH synthetic enzymes via ARE binding, we examined the nuclear protein levels of Mafs and Nrf2 on day 28 of BDL. Figure 6A shows that BDL with or without UDCA or SAMe treatment alone or in combination had little effect on the expression of MafF, MafB or Bach1. However, the induction of c-Maf, MafG and MafK following BDL was suppressed by treatment with UDCA or SAMe. For all three, UDCA or SAMe treatment alone suppressed partially, but combined therapy completely prevented induction (Fig. 6A). Interestingly, while BDL had no effect on the nuclear level of Nrf2 on day 28, UDCA or SAMe treatment alone raised its level by about 60-70% and when combined, raised its level by over 200%. These changes impacted on nuclear binding activity to ARE such that ARE binding did not fall during BDL during UDCA or SAMe treatment and most importantly, the fall in Nrf2 binding to ARE during the later stage of BDL was completely prevented (Figs. 6B and C).
Figure 6.
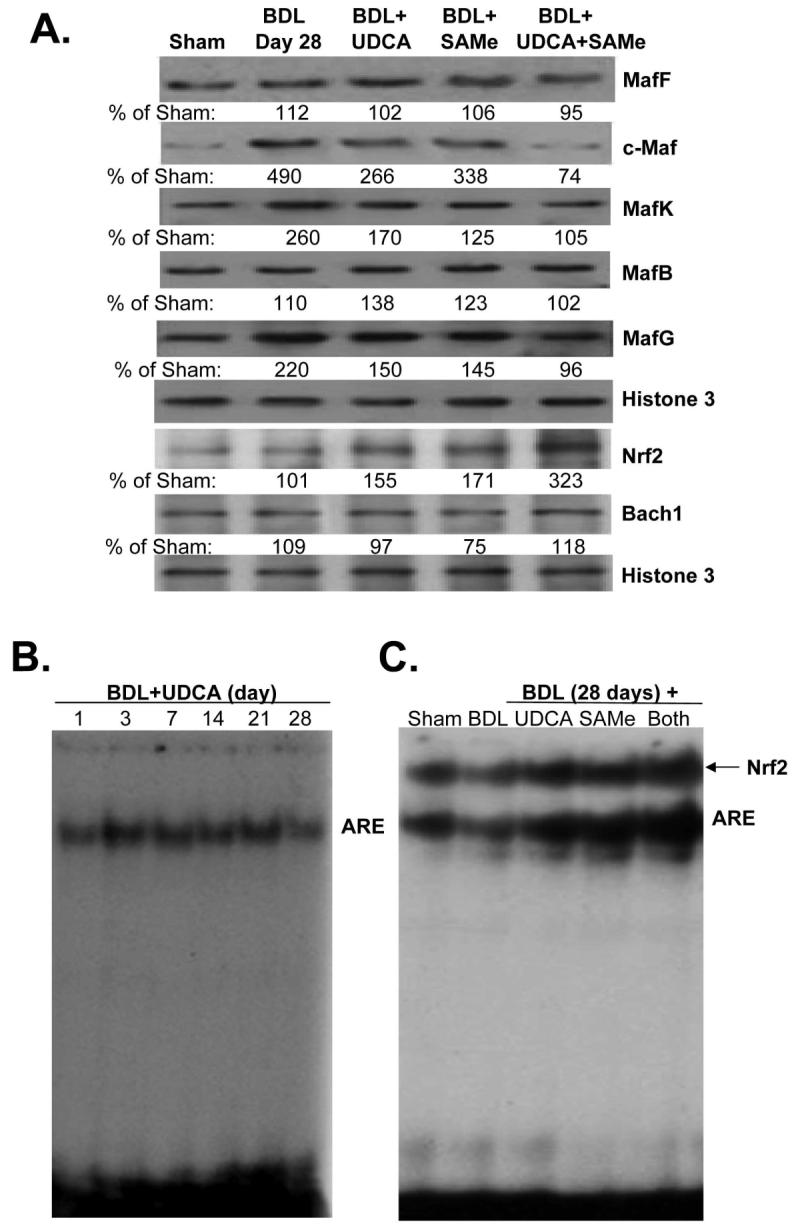
A) Effect of UDCA and SAMe treatment during BDL on hepatic nuclear protein levels of Maf proteins, Nrf2, and Bach1. Mice were subjected to BDL or sham surgery and received either vehicle, UDCA (100mg/kg/day), SAMe (100mg/kg/day), or UDCA plus SAMe for 28 days. Nuclear protein were isolated for Western blot analyses (15μg/lane). Membranes were stripped and re-probed with Histone 3 to ensure equal loading. Representative blots from at least 3 mice for each time point are shown and the values below the blots are densitometric values expressed as % of sham controls for these blots. See Supplemental Table 4 for summary of densitometric values from all blots. B) UDCA treatment prevents the fall in ARE nuclear binding during BDL. EMSA for ARE nuclear binding was done as described in Methods in mice subjected to BDL that received UDCA for up to 28 days. C) Effect of UDCA and SAMe treatments on nuclear binding activity of Nrf2 to ARE on day 28 after BDL. EMSA and supershift analysis of ARE were done as described in Methods using 25μg of nuclear protein per lane in the presence of anti-Nrf2 antibodies.
Effects of UDCA and SAMe treatment on liver injury, hepatic cell death and fibrosis
To see how UDCA and SAMe treatment during BDL affect liver injury, serum biochemical profiles and liver immunohistochemistry were examined on day 28. UDCA or SAMe treatment alone did not significantly lower serum ALT levels but the combination significantly lowered the ALT levels (Table I). Similarly, either treatment did not significantly lower serum ALP or bilirubin levels but combined treatment did significantly lower both as compared to BDL group (Table I). UDCA and combined treatment significantly lowered necrosis, while all treatments lowered apoptosis and the amount of liver fibrosis as determined by Sirius red stain (Fig. 7 and Table I). Still, for each of these variables, combined treatment tended to be more effective than either treatment alone. Consistently, hepatic Col1A2 mRNA levels in the combined treatment group showed no increase when compared to sham control group (Table I).
Table 1.
Effects of UDCA and SAMe Treatment on Hepatic Injury and Fibrosis 28 Days After BDL
| Sham | BDL | UDCA | SAMe | UDCA+SAMe | |
|---|---|---|---|---|---|
| Serum levels: | |||||
| ALT (Units/L) | 38±2 | 239±25* | 194±14* | 217±15* | 179±13** |
| ALP (Units/L) | 95±16 | 728±22* | 619±69* | 639±59* | 426±35** |
| Bilirubin (μmol/L) | 15±2 | 219±19* | 173±17* | 185±14* | 152±16** |
| Liver Immunohistochemistry: | |||||
| Necrosis (% of total) | 0±0 | 33.3±1.2* | 27.0±2.4** | 29.9±2.0* | 21.9±1.3**† |
| Apoptosis (% of total) | 0.9±0.1 | 15.1±1.6* | 6.8±1.1** | 7.9±0.9** | 5.3±1.0** |
| Sirius Red (% of total) | 0.5±0.04 | 7.2±0.3* | 5.1±0.5** | 5.3±0.4** | 4.3±0.3** |
| Liver mRNA level: | |||||
| Col1A2 (% of sham) | 100±0 | 551±163‡ | 264±55‡ | 127±18** | 94±21** |
Results are mean±SEM from 4 to 8 mice for each group. UDCA and SAMe were given by gavage at the dose of 100mg/kg/d in 0.1ml volume. See Methods for details.
p<0.001 vs. sham group
p<0.05 vs. BDL group
p<0.05 vs. BDL+SAMe and p=0.07 vs. BDL+UDCA
p<0.05 vs. sham group.
Figure 7.
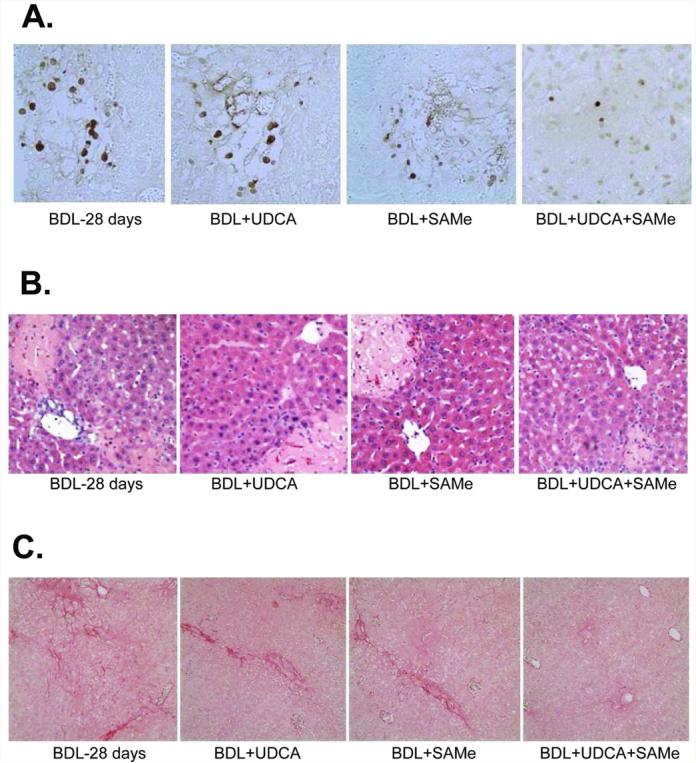
Effects of UDCA and SAMe treatment, alone or together, on hepatic apoptosis (part A), necrosis (part B), and fibrosis (part C) on day 28 after BDL. Representative liver sections stained with TUNEL, H&E, or Sirius red from BDL mice treated with vehicle, UDCA (100mg/kg/day), SAMe (100mg/kg/day) or UDCA plus SAMe for 28 days are shown (200X for A and B, 100X for C). See Methods for details.
DISCUSSION
Although all mammalian cells synthesize GSH, the liver has one of the highest organ contents of GSH and plays a central role in the interorgan homeostasis of GSH (23). In addition to its important roles in antioxidant defense and detoxification, GSH also modulates cell death, growth, inflammatory response and even hepatic fibrogenesis (reviewed in 1). Regarding fibrogenesis, recent studies show that transforming growth factor-β1, a potent profibrogenic factor, suppressed the expression of GCLC and lowered GSH levels in rat hepatic stellate cells (HSCs), key effectors in hepatic fibrogenesis (24). Epigallocatechin-3-gallate and curcumin were shown to block activation of HSCs by a mechanism that required raising GSH levels (24,25). Depletion in hepatic GSH levels is well recognized in patients with liver disease and has been largely attributed to nutritional deficiency and oxidative stress. Our current work shows that GSH synthesis becomes dysregulated and impaired during chronic cholestasis. This realization has important implications for designing therapy in chronic cholestatic disorders such as primary biliary cirrhosis, which at present is limited to UDCA (9). UDCA's efficacy in other cholestatic disorders remains unproven and whether other agents can enhance the efficacy is unclear (26). The goals for this work were two-folds, to elucidate the molecular mechanisms responsible for the impairment in GSH synthesis and to see how treatment may be improved.
During BDL, hepatic GCLC, GCLM and GS mRNA and protein levels were transiently increased early on, followed by a fall to about 50% of baseline levels. This pattern may explain why there are conflicting data regarding hepatic GSH levels and expression of GSH synthetic enzymes during experimental cholestasis (1,6-8). Given the fact that the magnitude of change in mRNA levels and protein levels are so similar, we reasoned that the changes are occurring at the mRNA level, either transcriptional or post-transcriptional. GCL subunits and GS are mainly regulated transcriptionally particularly in response to oxidative stress (1). We therefore examined the expression of transcription factors that are known to regulate their expression. In human and rodents, the most important factor is Nrf2, via trans-activation of the ARE (1). In addition, AP-1, NFκB and c-Myc have also been shown to positively regulate the coordinated expression of these genes (1,14-16,27). In the first 3 days after BDL, the nuclear protein levels of c-Fos, c-Jun, Nrf1, Nrf2 and c-Myc increased. These are likely to contribute to the up-regulation of all three genes. NFκB subunit protein levels increased later during BDL, thus are unlikely to participate in the early increase in gene expression. The induction in GSH synthetic enzymes at the early time point represents an adaptive defense response to oxidative stress that is well characterized at this time point (5,7,22). Indeed, Nrf2 activation and induction of GCLC and GCLM expression occurred in vitro in hepatocytes treated with toxic bile acids (28).
Later in the course of BDL (day 28), the hepatic mRNA and protein levels of GCLC, GCLM and GS fell to 50% of baseline, despite the fact that the nuclear protein levels of the transcription factors important in maintaining their expression, namely Nrf1, Nrf2, NFκB, AP-1, and c-Myc, were essentially unchanged (Nrf1, Nrf2, c-Fos, c-Jun) or increased (c-Myc, p50 and p65). Since all three genes have functional AREs (1), we next investigated nuclear ARE binding and found a transient increase in ARE nuclear binding activity followed by a fall to below baseline by day 14 after BDL, paralleling changes in the expression of the GSH synthetic enzymes. Despite increased nuclear Nrf2 levels (189% of baseline) on day 14 after BDL, the binding activity of Nrf2 to ARE was markedly impaired. This prompted us to examine factors known to influence Nrf2 binding activity to the ARE.
Nrf1 and Nrf2 are members of the CNC-bZIPs that can trans-activate ARE (18). Nrf2 is kept in the cytosol by Keap1 under non-stressful conditions and undergoes proteosomal degradation (29). Upon recognition of signals imparted by oxidative and electrophilic molecules, Nrf2 is released from Keap1, escapes proteosomal degradation and translocates to the nucleus to induce genes involved in defense and survival (29). Although Nrf1 is similar to Nrf2 structurally, Nrf1's activity is not controlled by Keap1 (30). Instead, Nrf1 is primarily localized to the membrane of the endoplasmic reticulum and is released and translocates to the nucleus during endoplasmic reticulum stress (30). Nrf1 and Nrf2 bind to ARE but not as homodimers or heterodimers with each other (18). Instead they require another bZIP protein to heterodimerize for binding to ARE. June (c-Jun, Jun-D, and Jun-B) and small Maf (MafG, MafK, and MafF) proteins have been shown to heterodimerize with both Nrf1 and Nrf2 and activate ARE-mediated gene expression (18). However, there is controversy as both activation and repression have been reported with heterodimers of Nrf2 and small Maf proteins (18). Interestingly, small Mafs can form homodimers, which can repress ARE-mediated gene expression (18,31). Overexpression of MafG and MafK were shown to negatively regulate ARE-mediated gene expression (31). Although the small Mafs do not have transcriptional activation domain, they have emerged as crucial regulators of mammalian gene expression (32). These genes are under complex control, both transcriptional and post-translational and are responsive in particular to stressful stimuli (32). In addition to the small Maf proteins, another subgroup of Maf proteins are the large Mafs, including c-Maf, and MafB (32). The large Mafs are major regulators of tissue-specific gene expression and cellular differentiation in mammals (32). Interestingly, c-Maf can bind to ARE as homodimers and heterodimers with small Maf, but not with Nrf2, to repress ARE-mediated gene expression (19). Another protein that can negatively regulate ARE is Bach1, which also belongs to the CNC, b-ZIP family of proteins (20). Overexpression of Bach1 was shown to compete with Nrf2 for heterodimerization with small Mafs and repress ARE-mediated gene expression (20). It is clear that ARE binding and trans-activation is under a complex regulatory control that involves Nrfs, Mafs and Bach1 so that the functional outcome depends on the balance of these proteins. To understand what is responsible for the fall in Nrf2 nuclear binding to ARE then requires knowing what happens to these proteins during BDL.
The hepatic nuclear protein levels of c-Maf, MafK and MafG are markedly increased, from day 14 on to day 28 of BDL. This led to a relative switch in abundance of proteins bound to ARE so that early on (day 3), Nrf2 dominated but later (14 days), c-Maf and MafG dominated over Nrf2. Nuclear protein levels and ARE binding activity of MafF and Bach1 remained essentially unchanged during BDL. Taken together, these results suggest that the high expression of c-Maf and MafG competed against Nrf2 for ARE binding and is at least partially responsible for the down-regulation in GCLC, GCLM and GS.
Treatment of cholestatic liver injury has remained very limited and there is clearly room for improvement. UDCA is the mainstay of therapy and consistent with previous report (7), it is able to prevent the fall in GCLC and GCLM expression. SAMe is a nutritional supplement widely available in the United States but is used therapeutically elsewhere in the world to treat acute cholestatic liver disorders (33). Individually, each agent prevented the fall in GCLC and GCLM expression during BDL. However, most importantly, combination of UDCA and SAMe exerted an additive effect on GCLC and GCLM expression and GSH levels. This suggests that these agents work by different mechanisms. This is further reinforced when ARE nuclear binding activity was examined with these treatments. UDCA and SAMe either partially or completely prevented the increase in c-Maf and MafG protein levels during BDL and when combined, the effect was even better. Interestingly, UDCA and SAMe treatment individually also raised Nrf2 nuclear levels and exerted an additive effect when combined. These changes also translated to ARE nuclear binding activity so that individually, each prevented the fall in Nrf2 binding to ARE but when combined, raised Nrf2 binding to ARE further. Taken together, these results support an important role of the changes in Mafs and Nrf2 expression and ARE binding as the cause of changes in the expression of GSH synthetic enzymes during BDL and in the therapeutic effects of UDCA and SAMe.
GSH participates in the regulation of cell death by apoptosis and necrosis as well as fibrosis. In support of this, combined treatment lowered apoptosis, necrosis and completely prevented fibrosis. Biochemical parameters of injury were also lower with combined treatment. Although both agents exert multiple other effects besides raising GSH levels, it is more than likely that raising the GSH levels can play an important contributory role to these actions. Much more work will be required to elucidate how toxic bile acids, UDCA and SAMe influence the expression of Mafs and Nrf2.
In conclusion, our study revealed a previously unrecognized impairment in the expression of GSH synthetic enzymes during late stages of cholestasis. This is due to a dramatic fall in Nrf2 nuclear binding activity to ARE, which positively controls all three genes. UDCA and SAMe prevent this fall by inducing the expression of Nrf2 and suppressing the expression of Maf proteins that can repress ARE. They do so by different mechanisms so that when combined, exerted additional protective effects on GSH as well as on liver cell death and fibrosis.
Supplementary Material
Acknowledgments
Financial support.
This work was supported by NIH grants DK45334 and AT1576 (to S. C. Lu and H. Yang). Mouse hepatocytes were isolated by the Cell Culture Core and pathological sections & staining were done by the Imaging Core of the USC Research Center for Liver Diseases (P30DK48522).
List of abbreviations
- ALP
alkaline phosphatase
- ALT
alanine transaminase
- AP-1
activator protein-1
- ARE
antioxidant response element
- BDL
bile duct ligation
- CNC
cap ‘n’ collar
- EMSA
electrophoretic mobility shift assay
- GCL
glutamate-cysteine ligase
- GCLC
GCL-catalytic subunit
- GCLM
GCL-modifier subunit
- GSH
reduced glutathione
- GS
GSH synthase
- H&E
hematoxylin and eosin
- HSCs
hepatic stellate cells
- NFκB
nuclear factor kappa B
- Nrf1
nuclear factor-erythroid 2 related factor 1
- Nrf2
nuclear factor-erythroid 2 related factor 2
- SAMe
S-adenosylmethionine
- TUNEL
terminal deoxynucleotidyl transferase (TdT)-mediated dUTP-digoxigenin nick-end labeling
- UDCA
ursodeoxycholic acid
REFERENCES
- 1.Lu SC. Regulation of glutathione synthesis. Mol Asp Med. 2008 doi: 10.1016/j.mam.2008.05.005. in press. [DOI] [PMC free article] [PubMed] [Google Scholar]
- 2.Ko KS, Yang HP, Noureddin M, Iglesia-Ara A, Xia M, Wagner C, et al. Changes in S-adenosylmethionine and glutathione homeostasis during endotoxemia in mice. Lab Invest. 2008;88:1121–1129. doi: 10.1038/labinvest.2008.69. [DOI] [PMC free article] [PubMed] [Google Scholar]
- 3.Centers for Disease Control National Vital Statistics Reports. 2004;53:5. [Google Scholar]
- 4.Trauner M, Meier PJ, Boyer JL. Molecular pathogenesis of cholestasis. N Engl J Med. 1998;339:1217–1227. doi: 10.1056/NEJM199810223391707. [DOI] [PubMed] [Google Scholar]
- 5.Guicciardi ME, Gores GJ. Bile acid-mediated hepatocyte apoptosis and cholestatic liver disease. Dig Liver Dis. 2002;34:387–392. doi: 10.1016/s1590-8658(02)80033-0. [DOI] [PubMed] [Google Scholar]
- 6.Neuschwander-Tetri BA, Nicholson C, Wells LD, Tracy TF., Jr. Cholestatic liver injury down-regulates hepatic GSH synthesis. J. Surg. Res. 1996;63:447–451. doi: 10.1006/jsre.1996.0290. [DOI] [PubMed] [Google Scholar]
- 7.Serviddio G, Pereda J, Pallardó FV, Carretero J, Borras C, Cutrin J, et al. Ursodeoxycholic acid protects against secondary biliary cirrhosis in rats by preventing mitochondrial oxidative stress. Hepatoloy. 2004;39:711–720. doi: 10.1002/hep.20101. [DOI] [PubMed] [Google Scholar]
- 8.Gumpricht E, Devereaux MW, Dahl RH, Sokol RJ. Glutathione status of isolated rat hepatocytes affects bile acid-induced cellular necrosis but not apoptosis. Toxicol Appl Pharmacol. 2000;164:102–111. doi: 10.1006/taap.2000.8894. [DOI] [PubMed] [Google Scholar]
- 9.Kumar D, Tandon RK. Use of ursodeoxycholic acid in liver disease. J. Gastro and Hepatol. 2001;16:3–14. doi: 10.1046/j.1440-1746.2001.02376.x. [DOI] [PubMed] [Google Scholar]
- 10.Mitsuyoshi H, Nakashima T, Sumida Y, Yoh T, Nakajima Y, Ishikawa H, et al. Ursodeoxycholic acid protects hepatocytes against oxidative injury via induction of antioxidants. Biochem. Biophys. Res. Commun. 1999;263:537–542. doi: 10.1006/bbrc.1999.1403. [DOI] [PubMed] [Google Scholar]
- 11.Lugea A, Nan L, French SW, Bezerra JA, Gukovskaya AS, Pandol SJ. Pancreas recovery following cerulein-induced pancreatitis is impaired in plasminogen-deficient mice. Gastroenterology. 2006;131:885–899. doi: 10.1053/j.gastro.2006.06.023. [DOI] [PMC free article] [PubMed] [Google Scholar]
- 12.Kreamer BL, Staecker JL, Sawada N, Sattler GL, Hsia MT, Pitot HC. Use of a low-speed, iso-density percoll centrifugation method to increase the viability of isolated rat hepatocyte preparations. In Vitro Cell Dev. Biol. 1986;22:201–211. doi: 10.1007/BF02623304. [DOI] [PubMed] [Google Scholar]
- 13.Yang HP, Sadda MR, Yu V, Zeng Y, Lee TD, Ou XP, et al. Induction of human methionine adenosyltransferase 2A expression by tumor necrosis factor alpha: Role of NF-κB and AP-1. J. Biol. Chem. 2003;278:50887–50896. doi: 10.1074/jbc.M307600200. [DOI] [PubMed] [Google Scholar]
- 14.Yang HP, Zeng Y, Lee TD, Yang Y, Ou XP, Chen LX, et al. Role of AP-1 in the co-ordinate induction of rat glutamate-cysteine ligase and glutathione synthetase by tert-butylhydroquinone. J. Biol. Chem. 2002;277:35232–35239. doi: 10.1074/jbc.M203812200. [DOI] [PubMed] [Google Scholar]
- 15.Yang HP, Magilnick N, Lee C, Kalmaz D, Ou XP, Chan JY, et al. Nrf1 and Nrf2 regulate rat glutamate-cysteine ligase catalytic subunit transcription indirectly via AP-1 and NFκB. Mol. Cell Biol. 2005;25:5933–5946. doi: 10.1128/MCB.25.14.5933-5946.2005. [DOI] [PMC free article] [PubMed] [Google Scholar]
- 16.Yang HP, Magilnick N, Ou XP, Lu SC. Tumor necrosis alpha induces coordinated activation of rat GSH synthetic enzymes via NFκB and AP-1. Biochem. J. 2005;391:399–408. doi: 10.1042/BJ20050795. [DOI] [PMC free article] [PubMed] [Google Scholar]
- 17.Lee TD, Yang HP, Whang J, Lu SC. Cloning and characterization of the human glutathione synthetase 5′-flanking region. Biochem. J. 2005;390:521–528. doi: 10.1042/BJ20050439. [DOI] [PMC free article] [PubMed] [Google Scholar]
- 18.Jaiswal AK. Nrf2 signaling in coordinated activation of antioxidant gene expression. Free Radical Biol. & Med. 2004;36:1199–1207. doi: 10.1016/j.freeradbiomed.2004.02.074. [DOI] [PubMed] [Google Scholar]
- 19.Dhakshinamoorthy S, Jaiswal AK. C-Maf negatively regulates ARE-mediated detoxifying enzyme genes expression and anti-oxidant induction. Oncogene. 2002;21:5301–5312. doi: 10.1038/sj.onc.1205642. [DOI] [PubMed] [Google Scholar]
- 20.Dhakshinamoorthy S, Jain AK, Bloom DA, Jaiswal AK. Bach1 competes with Nrf2 leading to negative regulation of the antioxidant response element (ARE)-mediated NAD(P)H:Quinone oxidoreductase 1 gene expression and induction in response to antioxidants. J. Biol. Chem. 2005;280:16891–16900. doi: 10.1074/jbc.M500166200. [DOI] [PubMed] [Google Scholar]
- 21.Miyoshi H, Rust C, Roberts PJ, Burgart LJ, Gores GJ. Hepatocyte apoptosis after bile duct ligation in the mouse involves Fas. Gastroenterology. 1999;117:669–677. doi: 10.1016/s0016-5085(99)70461-0. [DOI] [PubMed] [Google Scholar]
- 22.Rodrigues CM, Steer CJ. Bile acids and hepatocyte apoptosis: living/leaving life in the Fas lane. Gastroenterology. 1999;117:732–736. doi: 10.1016/s0016-5085(99)70469-5. [DOI] [PubMed] [Google Scholar]
- 23.Ookhtens M, Kaplowitz N. Role of the liver in interorgan homeostasis of glutathione and cyst(e)ine. Sem. Liv. Dis. 1998;18:313–329. doi: 10.1055/s-2007-1007167. [DOI] [PubMed] [Google Scholar]
- 24.Fu Y, Zhou YJ, Lu SC, Chen AP. Epigallocatechin-3-gallate inhibits growth of activated hepatic stellate cells by enhancing the capacity of glutathione synthesis. Mol. Pharmacol. 2008;73:1465–73. doi: 10.1124/mol.107.040634. [DOI] [PMC free article] [PubMed] [Google Scholar]
- 25.Zheng S, Yumei F, Chen AP. De novo synthesis of glutathione is a prerequisite for curcumin to inhibit hepatic stellate cell (HSC) activation. Free Rad Biol Med. 2007;43:444–453. doi: 10.1016/j.freeradbiomed.2007.04.016. [DOI] [PMC free article] [PubMed] [Google Scholar]
- 26.Smith T, Befeler AS. High-dose ursodeoxycholic acid for the treatment of primary sclerosing cholangitis. Curr Gastro Reprts. 2007;9:54–59. doi: 10.1007/s11894-008-0021-z. [DOI] [PubMed] [Google Scholar]
- 27.Benassi B, Fanciulli M, Fiorentino F, Porrello A, Chiorino G, Loda M, et al. c-Myc phosphorylation is required for cellular response to oxidative stress. Mol. Cell. 2006;21:509–519. doi: 10.1016/j.molcel.2006.01.009. [DOI] [PubMed] [Google Scholar]
- 28.Tan KP, Yang M, Ito SA. Activation of nuclear factor (Erythroid-2 Like) factor 2 by toxic bile acids provokes adaptive defense responses to enhance cell survival at the emergence of oxidative stress. Mol. Pharmacol. 2007;72:1380–1390. doi: 10.1124/mol.107.039370. [DOI] [PubMed] [Google Scholar]
- 29.Kensler TW, Wakabayashi N, Biswal S. Cell survival responses to environmental stresses via the Keap1-Nrf2-ARE pathway. Annu. Rev. Pharmacol, Toxicol. 2007;47:89–116. doi: 10.1146/annurev.pharmtox.46.120604.141046. [DOI] [PubMed] [Google Scholar]
- 30.Wang W, Chan JY. Nrf1 is targeted to the endoplasmic reticulum membrane by an N-terminal transmembrane domain. J. Biol. Chem. 2006;281:19676–19687. doi: 10.1074/jbc.M602802200. [DOI] [PubMed] [Google Scholar]
- 31.Dhakshinamoorthy S, Jaiswal AK. Small Maf (MafG and MafK) proteins negatively regulate antioxidant response element-mediated expression and antioxidant induction of the NAD(P)H:Quinone oxidoreductase 1 gene. J. Biol. Chem. 2000;275:40134–40141. doi: 10.1074/jbc.M003531200. [DOI] [PubMed] [Google Scholar]
- 32.Blank V. Small Maf proteins in mammalian gene control: mere dimerization partners or dynamic transcriptional regulators? J. Mol. Biol. 2008;376:913–925. doi: 10.1016/j.jmb.2007.11.074. [DOI] [PubMed] [Google Scholar]
- 33.Mato JM, Lu SC. Role of S-adenosyl-L-methionine in liver health and injury. Hepatology. 2007;45:1306–1312. doi: 10.1002/hep.21650. [DOI] [PubMed] [Google Scholar]
Associated Data
This section collects any data citations, data availability statements, or supplementary materials included in this article.