Abstract
With a combinatorial library of bioimaging probes, it is now possible to use machine vision to analyze the contribution of different building blocks of the molecules to their cell-associated visual signals. For athis purpose, cell-permeant, fluorescent styryl molecules were synthesized by condensation of 168 aldehyde with 8 pyridinium/quinolinium building blocks. Images of cells incubated with fluorescent molecules were acquired with a high content screening instrument. Chemical and image feature analysis revealed how variation in one or the other building block of the styryl molecules led to variations in the molecules' visual signals. Across each pair of probes in the library, chemical similarity was significantly associated with spectral and total signal intensity similarity. However, chemical similarity was much less associated with similarity in subcellular probe fluorescence patterns. Quantitative analysis and visual inspection of pairs of images acquired from pairs of styryl isomers confirm that many closely-related probes exhibit different subcellular localization patterns. Therefore, idiosyncratic interactions between styryl molecules and specific cellular components greatly contribute to the subcellular distribution of the styryl probes' fluorescence signal. These results demonstrate how machine vision and cheminformatics can be combined to analyze the targeting properties of bioimaging probes, using large image data sets acquired with automated screening systems.
Keywords: Cheminformatics, machine vision, bioimaging, fluorescence, styryl, high content screening, image cytometry, combinatorial chemistry
INTRODUCTION
Quantitative structure-property or structure-activity relationship (QSAR) analyses are commonly used to objectively assess how the chemical structures of molecules are related to their physiochemical properties or pharmacological activities (1-11). In contrast, quantitative structure-localization relationship (QSLR) analysis (12-19) remains relatively underdeveloped as a tool for bioimaging probe development. For bioimaging applications, one would want to be able to objectively optimize the structure or physicochemical properties of a molecule in relation to a molecule's visual signal as captured by an imaging instrument. Nevertheless, unlike bioactivity assay data, image data is inherently multidimensional (20-25), so QSLR analysis poses a significant challenge. Parallel development and integration of machine vision and cheminformatic analysis techniques is essential to further progress in QSLR analysis and bioimage probe development (26,27).
Styryl dyes are fluorescent, lipophilic cations that have been used as specific labeling probes for mitochondria, RNA, DNA, amyloid plaques, plasma membrane, endocytic vesicles and other structures in live cells (28-36). Different styryl molecules absorb and emit light at various different wavelengths (37). Styryl molecules can be synthesized from two basic building blocks —an aldehyde moiety and a pyridinium or quinolinium moiety— that react together through a condensation reaction that forms the central carbon-carbon double bond of the molecule (28,29). In this manner, combinatorial libraries of prospective bioimaging probes can be readily synthesized by combining different aldehyde and pyridinium or quinolinium building blocks. Such libraries have been used as a starting point to search or develop specific fluorescent organelle markers as well as in vivo bioimaging probes (28,29,36). Incorporation of positron emitting isotopes in styryl molecules may allow for these molecules to be used as whole-organism imaging probes in live animals and potentially in humans (38).
For assessing the structure-localization properties of styryl molecules, image analysis algorithms can be used to automatically analyze the subcellular distribution of cell-associated signals in images acquired using automated microscope instruments (“high content screening systems ”) (39-44). As a hypothesis, fluorescence signals and their subcellular localization can be mostly determined by generic transport mechanisms governing the intracellular transport of the styryl molecules. These generic transport mechanisms are mostly influenced by non-specific physicochemical properties of the probes such as lipophilicity, charge, or pKas of ionizable functional groups (45-47). Alternatively, spectral signals and subcellular localization may be mostly determined by specific binding interactions between styryl molecules and specific cellular macromolecules localized at different subcellular compartments (28,29). By studying the extent that variations in chemical structure leads to variations in fluorescence signal, it may be possible to determine whether specific chemical features or generic physicochemical properties are the key determinants of the localization of the fluorescence signal.
Here, we analyzed a data set of images of HeLa cells incubated with a combinatorial library of styryl molecules (26), with over 15,000 images obtained in six different acquisition channels (FITC, TRITC and Cy5 channels at 1sec and 200 msec exposure times). An orthogonal nuclear marker (Hoechst™ 33342) was used to identify each cell in an image, and using this marker as a reference, image analysis was performed to extract the individual cell associated features. To relate the chemical structure of the styryl molecules to their visual signal, the Tanimoto similarity coefficient of each pair of styryl molecules in the database was computed using a chemical fragment-based descriptor of each molecule. In turn, a similarity vector of the cell associated fluorescence signal was calculated based on the relative cytoplasmic and nuclear intensity of probe fluorescence (indicative of probe distribution between these two compartments), and the coefficient of variation (CV) of pixel intensities (indicative of homogenous or heterogeneous staining patterns associated with probe accumulation in discrete organelles) of the individual cells in the images. By studying the relationship between chemical similarities and signal similarities for individual pairs of probes, we quantitatively analyzed the molecules' cell-associated fluorescence signal in relation to the molecules' chemical building blocks.
MATERIALS AND METHODS
Data acquisition
Styryl probes belong to a combinatorial library in which each compound consists of one of 8 pyridinium or quinolinium groups (A-H) conjugated to one of 168 aldehyde groups (1-168), with all 8 × 168 combinations (1344 compounds) considered (26,29). The chemical synthesis and structures of this styryl library has been previously published (29). A Kineticscan™ high content screening instrument (39) (Cellomics, Inc., Pittsburgh, PA) was used to obtain images of HeLa cells incubated with fluorescent styryl probes in phenol red-free RPMI 1640 medium (Invitrogen, Inc.). Probes were diluted to 50 μM concentration from a 10 mM stock dissolved in DMSO. The compounds were imaged on 96-well plates using the four channels of the XF93 filter set (Omega Optical, Brattleboro, VT), as follows (48):
Excitation: 365 ± 25 nm; and emission: 515 ± 10 nm (Hoescht channel 1).
Excitation: 475 ± 20 nm; and emission: 515 ± 10 nm (FITC channel 2).
Excitation: 549 ± 40 nm; and emission: 600 ± 12.5 nm (TRITC channel 3).
Excitation: 655 ± 15 nm; and emission: 730 ± 25 nm (Cy5 channel 4).
As a control compound, we used Mitofluor™ Green (Invitrogen, Inc.) localizing to mitochondria. Hoechst™ 33342 (Invitrogen, Inc.) was added to every well of each plate (diluted to 5 μgs/ml from a 10 mgs/ml stock solution) to allow identification of cell nuclei. Image acquisition was performed with the 20X magnification objective of the Kineticscan™ instrument, under influx conditions (with styryl probe in the medium) and under efflux conditions (after washing and replacing with fresh RPMI 1640 medium). A total of twelve images were acquired for each well in each plate, with six images obtained under influx and efflux conditions. These six images were: Hoechst™ channel at 1s exposure; TRITC, FITC, and Cy5 channels at 1s exposure; and TRITC and FITC channels at 200ms exposure. The raw images produced by the instrument are 512 × 512 pixels in size, with intensity values ranging from 0 to 4095. The images from this study are available using a data access tool that is available from http://1cellpk.wikispaces.com/DeepBlue-Tools.
Image segmentation
Nuclear regions were identified by adaptively thresholding the Hoechst™ channel images. We did this by numerically optimizing a thresholding performance measure defined as the number of distinct objects in the thresholded image between 100 and 800 pixels in size, determined to be a range covering most cell nuclei in the images. The thresholding performance measure is denoted N(T) for threshold T. For optimization, we started with three points N(800*0.8), N(800), N(800*1.2) centered around a threshold of T=800, which was determined to be a good threshold for most images, by visual inspection. This set was then extended to either higher or lower threshold values by multiplying either the largest threshold by 1.2 or the smallest threshold by 0.8. This process was iterated until a bracket of values was found in which an interior point was the maximum among all values tested. This interior maximum was used as the threshold for the image under consideration. The algorithm was run independently on each Hoechst™ channel image in the data set. After identifying the nuclear regions, all distinct, connected objects in the thresholded image were identified using a labeling algorithm, and were henceforth referred to as the nuclear regions. A nuclear region was retained for further consideration if it was between 100 and 800 pixels in size. This range is specific to the magnification and resolution of our data, and was empirically determined through visual inspection of numerous images, based on correspondence of the segmented nuclear regions to the individual, single nuclei in the images. Regions of bright Hoechst™ channel pixel intensity smaller than 100 pixels or larger than 800 pixels tended to be artifacts of various types. With this method, the mean number of nuclei per image was 55 with a standard deviation of 26. Out of all experimental and control images analyzed, 31 images had no nuclei detected by the algorithm and were therefore not included in subsequent analysis.
Background subtraction
For every set of six images acquired per well, the Hoechst™ image was segmented as described above, and the resulting binary nuclear masks were dilated by 10 pixels. This is sufficient to cover most of the pixels inside cells. The complement of this dilated region was used to measure the background pixel intensity of the other five images acquired through the FITC, TRITC and Cy5 channels. The median intensity value of the background pixels of each image was subtracted from intensity value of every pixel in that image, and these adjusted intensity values were then truncated at zero.
Selection of images for further processing
To avoid artifacts that complicate analysis of subcellular fluorescence (such as extracellular dye precipitates), images were selected based on the premise that in an ideal image, the fluorescence signal would concentrate much more around the nuclei, rather than being randomly distributed in the image. For this purpose, we dilated each nuclear region by 10 pixels and defined the “inside intensity” (II) as the median intensity of all pixels in the dilated nuclear region. Next we dilated each nuclear region by 10 more pixels (20 pixel dilation in total), and defined the “outside intensity” (OI) as the median intensity of all pixels in the complement of this region. Let D=II-OI and let R=II/OI, and let S be the proportion of pixels in the 20 pixel dilated regions that are at the peak level (4095), which is a measure of saturation. An image was selected if D>300, R>1.2, and S<0.05. These values were defined based on inspection of a sample of images that were manually classified according to whether they were useful for analysis.
Cell-associated image features
A whole cell mask was constructed by dilating the nuclear masks by 5 pixels. The complement of each nuclear mask in its whole cell mask was taken as the cytoplasmic region mask, or “cytoring.” We next calculated four numerical features for each image based on the intensity values in the nuclear and/or cytoring regions. These four features are: (1) Logarithm of cytoplasm-to-nucleus intensity ratio, calculated as the median of log(1+x) where x ranges over all cytoring pixels in the image, minus the median of log(1+x) where x ranges over all nuclear pixels in the image; (2) Total signal intensity, calculated as the median of all nuclear and cytoring pixels in the image, summed over the three channels with 1s exposure times; (3) Spectral distribution of the fluorescence signal, calculated as a triple of non-negative values summing to 1, where the three values represent the median pixel intensity over all nuclear and cytoring pixels in the image in the 1s TRITC, FITC, and Cy5 channels, normalized to the sum of these three values; (4) Coefficient of variation (CV), calculated as the usual coefficient of variation (ratio of standard deviation to mean value) over all nuclear and cytoring pixels in the image. All image and statistical analysis were done in Python using the numpy and ndimage packages.
For inclusion in subsequent, quantitative analysis of image features, a given image had to pass the following additional criteria: (1) for the nuclear-to-cytoplasmic ratio analysis, either the nuclear or cytoplasmic median intensity (or both) had to be at least 100 units (with 1530 styryl image sets passing this criterion); (2) for the total cellular intensity analysis, the image was required to have at least one region (with 2626 styryl image sets passing this criterion); (3) for the analysis of spectral distribution, at least one of the three spectral channels was required to have a median intensity value within each cell region of at least 100 units (with 675 styryl image sets passing this criterion); and (4) for the coefficient of variation (CV) analysis, the mean of all within-cell pixels was required to be at least 100 units (with 1730 styryl image sets passing this criterion). Every image passing the aforementioned criteria was visually inspected for evidence of probe toxicity or the presence of insoluble dye complexes in the extracellular medium. Images with >20% rounded cells with blebs or condensed nuclei (morphological features indicative of probe toxicity) or with evidence of dye precipitates, aggregates or crystals interfering with cell feature measurements were manually excluded from analysis.
Marginal and pairwise analysis
Marginal analysis of image features was carried out by estimating the distributions (using kernel density estimators) of a particular image feature for selected classes of compounds (Mitofluor™ Green control or styryl). These distributions were then superimposed in graphs, and specific images from points along the distribution were visually inspected to assess whether the image feature being measured actually corresponds to the visual interpretation of the probe's fluorescence distribution. Differences between marginal distributions for different classes of compounds indicate that at least for subsets of the compounds, there are distinct localization patterns.
To determine if compounds that are structurally more similar also tend to produce similar images, we performed pairwise image analysis as follows: For each pair of probes, we measured their chemical similarity in terms of Tanimoto similarity based on the Cactvs 881 key fingerprint set (49). Tanimoto similarities were linearly transformed to have mean zero and standard deviation 1 across the entire library. Image feature dissimilarity was assessed using the L1 distance (sum of absolute differences) for the components of a particular image feature (e.g. the three components of spectral distribution of probe fluorescence). Scatter plots of image feature dissimilarity against Tanimoto similarity were generated by selecting 30,000 compound pairs at random. We then calculated running medians and 75th percentiles within intervals along the horizontal axis containing 200 points. These raw percentiles were then LOWESS smoothed and superimposed on the scatter plot. Correlation coefficients between image feature dissimilarity and Tanimoto similarity and two-sided p-values for a null hypothesis of no correlation were calculated to summarize the trends (Table I).
Table 1.
Correlation coefficients between image feature dissimilarity and chemical structure similarity. Results are shown for each of four image features (total intensity, spectral distribution, CV and cytoplasmic-to-nuclear ratio). Statistical significance of the correlations is shown in parenthesis.
| Same pyridinium or quinolinium | Different pyridinium or quinolinium | |
|---|---|---|
| Total Intensity | -0.05(<0.01) | -0.10(<0.01) |
| Spectral distribution | -0.06(<0.01) | -0.14(<0.01) |
| CV | -0.07(<0.01) | 0.00(0.50) |
| cyto/nuc ratio | -0.04(<0.01) | -0.01(<0.01) |
RESULTS
1. Styryl molecules exhibit a range of cell-associated fluorescence patterns
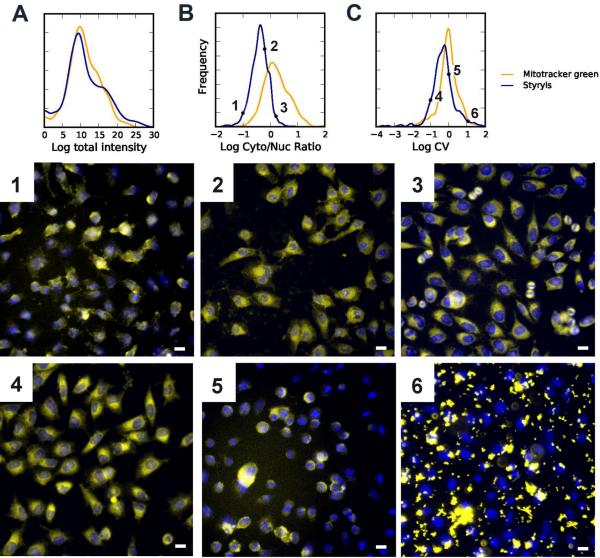
We began by assessing how variation in chemical structure of styryl molecules influenced the intracellular intensity and distribution of the molecules' fluorescence signal in relation to Mitofluor™ Green —a lipophilic cation used as a mitochondria-specific fluorescent marker (50). At the total intensity level, the distribution of fluorescence signal acquired from the styryl molecules was similar to that of Mitofluor™ Green controls (Figure 1A). However, the ratio of cytoplasmic-to-nuclear fluorescence of styryl molecules was considerably lower than that of Mitofluor™ Green (Figure 1B), consistent with fluorescence signals being more nuclear, more diffuse and coming from sites other than mitochondria. Also, the coefficient of variation (CV) of intracellular fluorescence of styryl molecules was lower than that of Mitofluor™ Green (Figure 1C), indicative of a more homogenous, intracellular fluorescence localization.
Figure 1.
The distributions of whole cell intensity (A), cytoplasmic to nuclear ratio (B), and whole cell coefficient of variation (C), along with representative images (1-6) from various points along each distribution. All images are composites acquired from the Hoechst™ (blue) and TRITC channel (yellow, 1s exposure in the presence of extracellular dye). Scale bar = 10 μm.
Upon visual inspection, images of cells incubated with different styryl molecules revealed different patterns of intracellular fluorescence signal intensity and localization consistent with the measured image features (Figure 1). Those images of cells with low cytoplasmic to nuclear ratio (Figure 1B, image 1) generally had a diffuse cellular staining pattern that appeared in both nuclear and cytoplasmic regions. Images of cells with intermediate cytoplasmic-to-nuclear ratio (Figure 1B, image 2) often had strong cytplasmic fluorescence suggestive of mitochondrial or some other cyplasmic organelle accumulation, and often exhibited some punctate nuclear (nucleolar) fluorescence. Images of cells with high cytoplasmic-to-nuclear ratios (Figure 1B, image 3) most closely resembled Mitofluor™ Green staining, in terms of the preferential localization of probe fluorescence in the cytoplasmic compartment and visual resemblance to the typical, perinuclear localization pattern of mitochondrial-specific fluorescent dyes.
A high value for the CV feature is an indicator of heterogenous staining patterns associated with vesicular or organellar dye sequestration (26,40). Yet, a significant number of styryl molecules exhibited lower CV values than Mitofluor™ Green indicative of diffuse staining. Images at the extreme, low end of the CV values often had cells with diffuse, cytoplasmic fluorescence (Figure 1C, image 4). Images of cells with intermediate CVs exhibited various localization patterns, from membrane-associated (Figure 1C, image 5) to more punctate or vesicular staining patterns typical of mitochondrial or lysosomal staining. Images with the highest CVs of cell-associated fluorescence signals corresponded to cells with small dye crystals in the perinuclear region (Figure 1C, image 6).
We noted that the variance of cytoplasmic-to-nuclear ratios (Figure 1B) obtained from the Mitofluor™ green controls was greater than the distribution observed for styryl compounds. This result was paradoxical at first, since the styryl molecules correspond to a diverse collection of compounds that should label cells differently, while Mitofluor™ Green is a single compound that should label all cells the same. However, we found that because the total nuclear signal of Mitofluor™ Green was very low, small variations in nuclear intensity could lead to large differences in the calculated cytoplasmic-to-nuclear ratio. In the case of styryl molecules, the nuclear and cytoplasmic signals are more similar to each other, so larger variations in nuclear signal of styryl molecules have a smaller effect on the cytoplasmic-to-nuclear ratio.
2. Phenotypic effects that confound analysis of subcellular localization features are associated with specific molecules
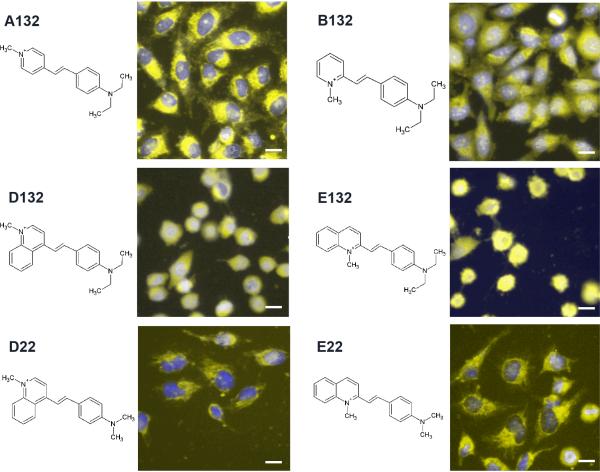
In any collection of prospective bioimaging agents, some phenotypic effects resulting from probe accumulation inside cells and non-intended interaction with cellular components can be expected. Because toxic effects generally become apparent after prolongued incubation with probes, we kept incubation times at the minimum. However, some styryl molecules did cause cell shape changes which may be indicative of probe toxicity (Figure 1, image 4). Cell rounding and blebbing was specifically observed with particular aldehydepyridinium building block combinations. For example, cell incubated with probes D132 and E132 were rounded, with E132 showing signs of blebbing. Yet, many cells incubated with the closely-related probes A132, B132, D22 and E22 showed no signs of cell rounding or blebbing (Figure 2). For quantitative structure-localization relationships, images of cell populations exhibiting signs of toxicity were excluded from analysis.
Figure 2.
Images of cells incubated with a group of related styryl probes, exhibiting normal (A132, B132, D22 and E22) and rounded (D132, E132) cell shape phenotypes. All images are composites acquired from the Hoechst™ (blue) and TRITC channel (yellow, 1s exposure with extracellular dye). Scale bar = 10 μm.
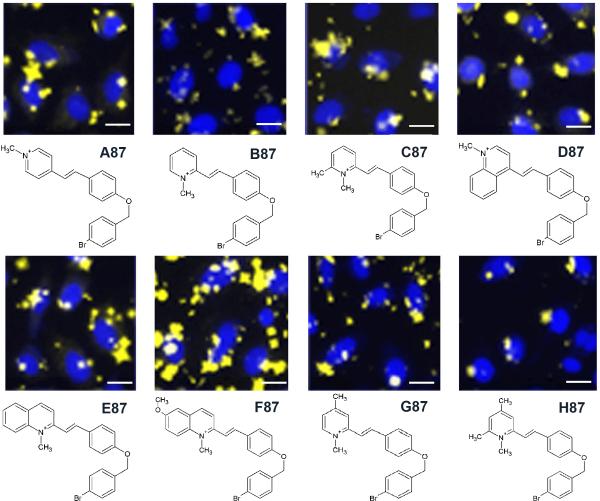
A different kind of phenotypic effect was associated with the appearance of cell-associated dye precipitates or crystals (Figure 1, image 6). Crystals could be identified based on their extremely punctate and bright signal, as well as the rod-, star- or rhombus-shape of the particles (Figure 3). Some of these crystals could be observed in cell-free, extracellular regions of the images. Yet, in many cases these crystals were closely associated with the individual cell nuclei and led to very high CV values as artifact (Figure 1C, image 6). We found that these insoluble styryl molecules were mostly associated with specific aldehyde groups, independently from the pyridinium or quinolinium group. These aldehydes were 87, 88, 124 and 127. As with dye-induced cell rounding, images with evidence of dye crystals in the immediate nuclear periphery (as in Figure 3) were excluded from further analysis.
Figure 3.
Images of cells exhibiting cell associated insoluble dye aggregates or crystals, in the presence of styryl molecules possessing the same aldehyde (87) but different pyridinium or quinolinium building blocks (A-H). All images are composites acquired from the Hoechst™ (blue) and TRITC channel (yellow, 200ms exposure after extracellular dye washout). Scale bar = 10 μm.
To test the stability of the probe fluorescence pattern, the cytoplasmic-to-nuclear ratio and CV was compared in the presence and in the absence of extracellular probe (following prior incubation of cells with probes). Comparing these two conditions, the correlation for cytoplasmic-to-nuclear ratio was 0.64 and the correlation for CV was 0.92. Therefore, the staining patterns observed for most probes appeared quite stable, in steady state vs. efflux conditions. These trends were confirmed by visual inspection of the corresponding images (data not shown).
3. Different isomers of the pyridinium or quinolinium building block yield different subcellular fluorescence localization patterns
Because the chemical fingerprint used to calculate the Tanimoto coefficient is only sensitive to the presence or absence of a particular functional group in a molecule, many isomers of molecules possess a Tanimoto coefficient of 1.0 and therefore represent the most structurally similar pairs of molecules in a library. If subcellular localization of a molecule is governed by non-specific physicochemical properties of the probes (like probe radius, lipophilicity, number of hydrogen bonds, etc.), then subcellular probe signal should show minimal variation among isomers, compared to modifications that alter the chemical structure of the molecules by adding or subtracting atoms or functional groups.
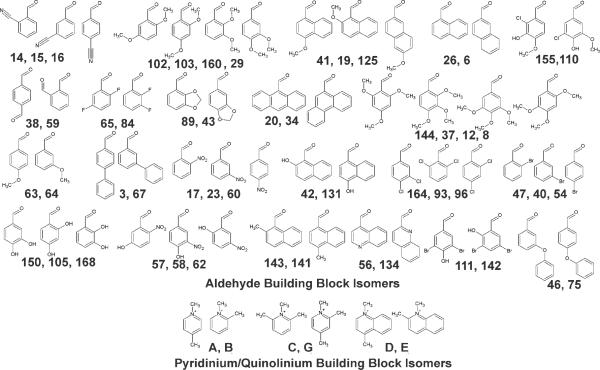
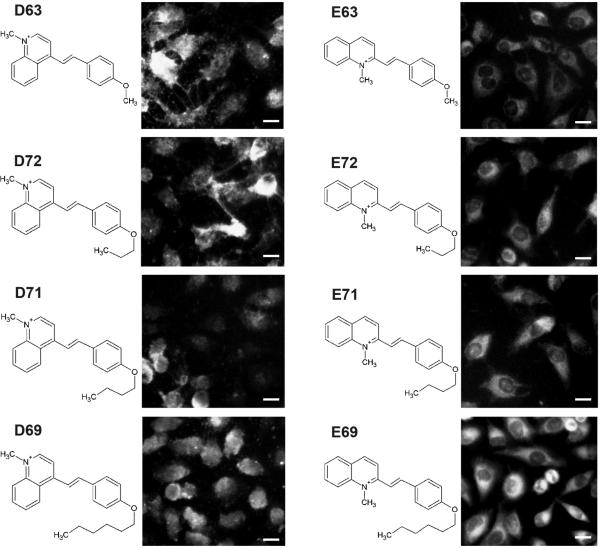
In the styryl library, 6 out of the 8 pyridinium or quinolinium building blocks, and 55 out of 168 aldehyde building blocks possess structural isomers (Figure 4). Unexpectedly, different isomers of the quinolinium building blocks often possessed different subcellular localization patterns (Figure 5). These patterns were consistent and associated with a specific isomer. For example, the fluorescence signal of molecules D63, D72, D71 and D69 is present over the nuclear and cytoplasmic regions of the cell to similar extent, and they all exhibit a similar, heterogenous membrane-staining pattern. In contrast, the corresponding isomers E63, E72, E71, and E69 exhibit a distinctly bright and diffuse cytoplasmic staining with much darker nuclei. We note that varying the length of the hydrocarbon chain associated with aldheyde building block 63, 72, 71, to 69 is expected to increase the lipophilicity of the molecules by more than two orders of magnitude (data not shown). This suggests that the quinolinium D and E building block isomers exerts a far more prominent effect on subcellular localization than a 100-fold change in lipophilicity. Frequency histogram plots of CV and nuclear-to-cytoplasmic ratio features support this observation: group D produced far more compounds with high CV compared to group E, whereas groups D and E were very similar in terms of their cytoplasmic-to-nuclear ratios (data not shown).
Figure 4.
Isomers of aldheyde building blocks (indicated by numbers separated by commas) and pyridinium or quinolinium building blocks (indicated by letters separated by commas) in the styryl library. Note that some aldheydes have two or three related isomers. The full collection of compounds screened in this study has been previously described (29).
Figure 5.
Image pairs of cells incubated with styryl molecules synthesized with the same aldehyde building block (63, 72, 71 and 68) but different quinolinium building blocks (D and E). All images are from the TRITC channel (1s exposure with extracellular dye). Scale bar = 10 μm.
4. Different isomers of the aldehyde building block yield different subcellular fluorescence localization patterns
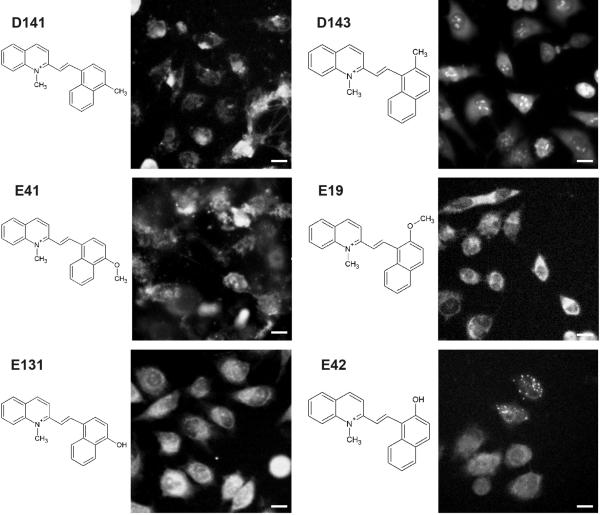
Like the isomers of the pyridinium or quinolinium building block, isomers of the aldehyde building block (Figure 4) that shared the same pyridinium or quinolinium building block often exhibited different patterns of cell-associated fluorescence (Figure 6). For example, in molecule D141 the methyl group on the aldehyde building block is in the ortho position while in the in molecule D143 it is in the para position. Yet, the signal of molecule D141 is associated with the heterogeneous, staining across the whole cell, while that of the molecule D143 is located in nucleoli as well as being diffusely localized in the rest of the cell (Figure 6).
Figure 6.
Image pairs of cells incubated with styryl molecules synthesized with the same quinolinium building blocks (D or E) but different aldheyde building blocks (141, 143, 31, 19, 131, 42). All images are from the TRITC channel (1s exposure with extracellular dye). Scale bar = 10 μm.
In another example of aldehyde building block isomers (Figure 6), molecules E19 and E41 posses a methoxy group in ortho and para positions respectively, while molecules E42 and E131 possess a hydroxy group at the corresponding positions. In molecule E19 and E131 the fluorescence exhibits mitochondrial/cytoplasmic localization. However, in molecule E42 the fluorescence shows a punctate, cytoplasmic localization in some cells while in E41 the localization is in both nuclear or cytoplasmic region (Figure 6). Thus very small variations in the structure of the aldehyde building block can lead to significant changes in the subcellular distribution of probe fluorescence.
5. Similar pairs of styryl probes generally yield similar spectral and intensity signals but dissimilar fluorescence localization patterns
Paired cheminformatic-machine vision analysis was performed to study how variation in fluorescence signals acquired from pairs of styryl probes was related to variation in their chemical structure. Three different analysis were performed: (1) total intensity analysis, which involved comparing the total signal in FITC, TRITC or Cy5 channels; (2) spectral analysis, which involved comparing the fraction of the total fluorescence signal that is obtained from each channel; (3) spatial analysis, which involved comparing the cytoplasmic-to-nuclear ratio and coefficient of variation of fluorescence signal in each channel.
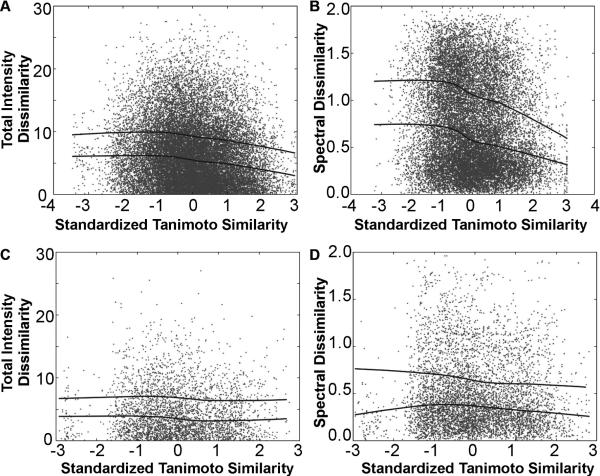
As expected, a clear relationship between chemical similarity between each pair of probes in the library and their relative fluorescence in FITC, TRITC and Cy5 channels was observed. For pairs of styryl probes sharing the same aldehyde building block but different pyridinium or quinolinium building blocks, the more similar the molecules (higher Tanimoto coefficient) the more similar the fraction of total signal acquired in each of the three fluorescence channels (Figure 7A). A similar trend was observed in terms of the relative signals obtained in each of the three channels (Figure 7B). However, for pairs of probes sharing the same pyridinium or quinolinium groups but different aldehydes, the trend was not as prominent, either for the total signal intensity (Figure 7C) or for the spectral analysis (Figure 7D). This indicates that variation in the pyridinium or quinolinium building blocks exerts a stronger effect on the fluorescence of the styryl molecules in FITC, TRITC and Cy5 channel than variation of the aldehyde, with the more similar building blocks leading to more similar intensity and spectral signals. The calculated correlation coefficients between image features similarity and chemical feature similarity support these trends (Table I).
Figure 7.
The pairwise dissimilarity in the total signal intensity (A, C) or the spectral distribution of signal intensity (B, D) plotted against standardized Tanimoto similarity between each pair of chemical structures in the styryl library. Pairwise comparisons were made for molecules possessing different pyrdinium or quinolinium groups (A, B) or the same pyridinium or quinolinium groups (C, D). The total signal intensity was calculated as the sum of intensities for 1 second exposures for FITC, TRITC and CY5 channels.
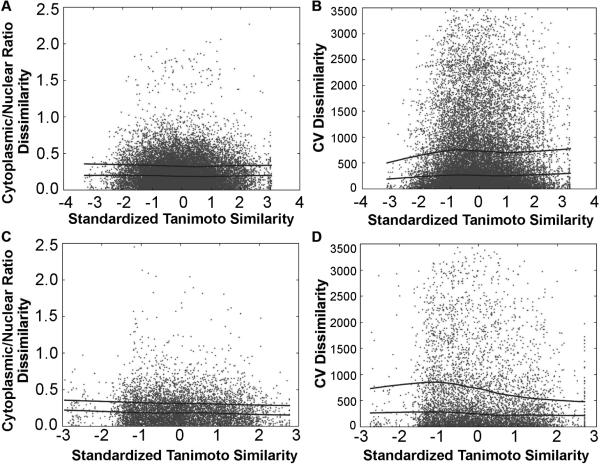
In contrast, image feature analysis of cell-associated fluorescence signals revealed no visually obvious trend relationship between similarities in the chemical structure of each pair of probes, and the cytoplasmic-to-nuclear ratio (Figure 8A, C) or CV (Figure 8B, D) of cell-associated probe fluorescence. Thus, for every pair of molecules in the library, pairs of molecules that are similar to each other (based on their Tanimoto coefficient) did not necessarily exhibit similar localization of fluorescence signal compared to less similar pairs of probes, independent of whether the pairwise analysis was done across different pyridinium or quinolinium (Figure 8 A, B) or different aldehyde (Figure 8 C, D) building blocks. This result indicates that the mechanism leading to differences in nuclear-to-cytoplasmic probe distribution or CV values is less dependent on structural features captured by the chemical fingerprint of the molecules, compared to the mechanism leading to differences in the spectral distributions or total fluorescence intensity in the FITC, TRITC and Cy5 channels. This is consistent with our other observations (Figure 5 and 6) that small changes in the structure of the molecules - such as ortho vs. para isomers- exert a major effect on their subcellular localization features. Again, these observations correspond to the correlation coefficients between image features similarity and chemical feature similarity (Table I).
Figure 8.
The pairwise dissimilarity in the log cytoplasm-to-nucleus ratio (A, C) or the CV of cell-associated fluorescence intensity (B, D) plotted against standardized Tanimoto similarity between each pair of chemical structures in the styryl library. Pairwise comparisons were made for molecules possessing different pyridinium or quinolinium groups (A, B) or the same pyridinium or quinolinium groups (C, D).
DISCUSSION
The present study demonstrates how quantitative cytometric analysis can assist the primary screening of a combinatorial library of prospective bioimaging probes. In the past, the use of high content screening instruments to search for new bioimaging probes within large libraries of fluorescent compounds had been limited by the complicated, image analysis task. In this study, for the actual screening run the total number of experimental images were 6 images per well x 2 conditions x 1344 compounds = 16128 experimental images. In addition, there were 16 controls wells per plate x 6 image acquisitions x 2 conditions x 17 plates = 3264 control images. In addition, over a thousand additional images were acquired and analyzed in preliminary experiments (data not shown), to determine optimal assay parameters and instrument settings (for example, to establish the optimal cell seeding density, camera integration time for the acquisitions, and fine-tuning the various instrument and experimental parameters). Although machine vision algorithms to facilitate the discovery of bioimaging probes in large image data sets acquired with high content screening systems are only beginning to be developed, their application in this area is feasible and timely.
Like many other lipophilic cations, styryl molecules can accumulate in mitochondria attracted by the negative electrical potential of the mitochondrial inner membrane (31,34,37,51) Nevertheless, styryl molecules can also interact with other cellular components (28,32,33,36,37). In order to tailor styryl molecules to specific bioimaging applications, understanding whether generic transport mechanisms vs. specific molecular interactions determine the localization of the molecules is important. If generic transport mechanisms were primarily involved in determining the subcellular distribution of styryl molecules, it may be possible to use physiologically-based modeling approaches to predict the subcellular distribution of these molecules in specific organelles (45-47,52). However, in the combinatorial library of styryl molecules analyzed in this study, specific interactions seem to be a key determinant of nuclear-to-cytoplasmic probe distribution and the heterogeneity of probe distribution captured by the CV feature.
In the case of the styryl molecules' fluorescence signal, the mechanisms determining the total intensity of signal acquired in different fluorescence channels are more dependent on generic chemical features of the probes captured by the chemical fragment-based Cactvs fingerprint. The results indicate that variations in the quinolinium building block had greater effect on total intensity and spectral signals than variation in the aldheyde building block (Figures 7, 8). In a previous study, we found that the quinolinium building blocks in combination with any aldehyde building block are excited and emit at the wavelengths corresponding to the standard FITC, TRITC and CY5 channels of the high content screening instrument, while pyridinium building blocks in combination with the same aldehyde are excited and emit at shorter wavelengths (37). Thus, it is possible that variation in the aldehyde building block may exert a more pronounced effect on probe signal if optical filters for detecting fluorescence at shorter excitation and emission wavelengths were used.
An important question that will be addressed in future studies is how variations in chemical structure of the probes is related to differences in the patterns of subcellular fluorescence observed at different times after probe addition to the cell, and at different extracellular probe concentrations. In planned, follow up studies, more thorough exploration of the effect of probe concentration and incubation time will be performed. We expect such variations to have a significant effect on probe distribution based on (1) the concentration-dependent effect of the specific binding affinity of the probes for different cellular components; (2) the concentration and time-dependent effects of the probes on cell structure and function including cytotoxicity; and (3) the relationship between the measured, quantitative image parameters and the actual subcellular probe distribution patterns. Multivariate regression techniques applied to large image datasets still remain to be explored as a way to study how probe chemical structure is related to probe fluorescence distribution and kinetics at different doses and time points. Indeed, the results of the present study points us to a much broader, emerging research area at the intersection of cheminformatics and machine vision.
In the emerging field of location proteomics, machine vision techniques have been developed to analyze the subcellular distribution of proteins inside cells (20-22,24,25,53-55). The present study builds on these advances, combining machine vision with cheminformatic analysis, to establish links between specific subcellular localization features to the chemical structure of the probes. Based on previous studies, styryl molecules are expected to concentrate in the nuclei, mitochondria, plasma membrane or nucleoli, or be diffusely localized in the cytoplasm (26,28-30,36,37,56). Thus, while the subcellular localization features analyzed in this study —namely the cytoplasmic-to-nuclear ratio and coefficient of variation— are only two of many possible subcellular localization features that could have been analyzed, these two features are very informative in terms of capturing the expected subcellular localization patterns exhibited by the styryl probes. As a caveat, it is possible that other visual features yet to be analyzed may reveal a more significant relationship to generic chemical features of the probes. Thus, we are currently performing a more exhaustive search for cell-associated visual features whose similarity may show a stronger correlation with the Tanimoto similarity of the styryl probes.
In summary, high content screening and image cytometry are now poised to advance the methods used for screening prospective bioimaging probes. Traditionally, this has involved the subjective evaluation of stained samples, relying on qualitative calls made after visual inspection by human experts. While manual, visual screening can easily overlook issues such as probe toxicity or insolubility, in an automated screen such issues constitute important confounding factors that must be dealt with explicitly, in order to perform a meaningful analysis. We found that, by excluding images with rounded cells or with cell-associated dye aggregates, precipitates or crystals, it is possible to minimize these confounding factors. In turn, using combinatorial libraries of bioimaging probes permitted analysis of probe signal and distribution in relation to chemical structure. By varying one building block of the molecule while keeping the others constant, we determined the effects of chemical variations on image features. To conclude, after a candidate bioimaging probe is identified for a specific application, more sensitive and specific analysis including toxicity assays can be performed in follow up studies, as was already done with a family of RNA-selective probes identified in this library (29). Nevertheless, results from this library-wide QSLR study prompt us to revise our original hypothesis, in favor of a more prominent role for specific, idiosyncratic interactions in determining the spatial distribution of fluorescence signals obtained from styryl molecules.
ACKNOWLEDGEMENTS
This work was funded by NIH grant RO1GM078200 to G.R.R. and P20 HG003890 to KS. We also thank P. Matsudaira and J. Evans at the Whitehead Institute Bioimaging Facility for access to the Kineticscan™ instrument.
References
- 1.Blake JF. Chemoinformatics - predicting the physicochemical properties of `drug-like' molecules. Curr Opin Biotechnol. 2000;11(1):104–7. doi: 10.1016/s0958-1669(99)00062-2. [DOI] [PubMed] [Google Scholar]
- 2.Ghose AK, Crippen GM. Quantitative structure-activity relationship by distance geometry: quinazolines as dihydrofolate reductase inhibitors. J Med Chem. 1982;25(8):892–9. doi: 10.1021/jm00350a003. [DOI] [PubMed] [Google Scholar]
- 3.Ghose AK, Crippen GM. Use of physicochemical parameters in distance geometry and related three-dimensional quantitative structure-activity relationships: a demonstration using Escherichia coli dihydrofolate reductase inhibitors. J Med Chem. 1985;28(3):333–46. doi: 10.1021/jm00381a013. [DOI] [PubMed] [Google Scholar]
- 4.Ghose AK, Crippen GM. Modeling the benzodiazepine receptor binding site by the general three-dimensional structure-directed quantitative structure-activity relationship method REMOTEDISC. Mol Pharmacol. 1990;37(5):725–34. [PubMed] [Google Scholar]
- 5.Marrero Ponce Y, Cabrera Perez MA, Romero Zaldivar V, Gonzalez Diaz H, Torrens F. A new topological descriptors based model for predicting intestinal epithelial transport of drugs in Caco-2 cell culture. J Pharm Pharm Sci. 2004;7(2):186–99. [PubMed] [Google Scholar]
- 6.McFarland JW, Berger CM, Froshauer SA, Hayashi SF, Hecker SJ, Jaynes BH, Jefson MR, Kamicker BJ, Lipinski CA, Lundy KM. Quantitative structure-activity relationships among macrolide antibacterial agents: in vitro and in vivo potency against Pasteurella multocida. J Med Chem. 1997;40(9):1340–6. doi: 10.1021/jm960436i. [DOI] [PubMed] [Google Scholar]
- 7.Svetnik V, Liaw A, Tong C, Culberson JC, Sheridan RP, Feuston BP. Random forest: a classification and regression tool for compound classification and QSAR modeling. J Chem Inf Comput Sci. 2003;43(6):1947–58. doi: 10.1021/ci034160g. [DOI] [PubMed] [Google Scholar]
- 8.Wildman SA, Crippen GM. Three-dimensional molecular descriptors and a novel QSAR method. J Mol Graph Model. 2002;21(3):161–70. doi: 10.1016/s1093-3263(02)00147-x. [DOI] [PubMed] [Google Scholar]
- 9.Hansch C. The QSAR paradigm in the design of less toxic molecules. Drug Metab Rev. 1984;15(7):1279–94. doi: 10.3109/03602538409029960. [DOI] [PubMed] [Google Scholar]
- 10.Hansch C, Leo A. Exploring QSAR: fundamentals and applications in chemistry and biology. American Chemical Society; Washington DC: 1995. [Google Scholar]
- 11.Leo A, Hansch C, Church C. Comparison of parameters currently used in the study of structure-activity relationships. J Med Chem. 1969;12(5):766–71. doi: 10.1021/jm00305a010. [DOI] [PubMed] [Google Scholar]
- 12.Colston J, Horobin RW, Rashid-Doubell F, Pediani J, Johal KK. Why fluorescent probes for endoplasmic reticulum are selective: an experimental and QSAR-modelling study. Biotech Histochem. 2003;78(6):323–32. doi: 10.1080/10520290310001646659. [DOI] [PubMed] [Google Scholar]
- 13.Horobin RW. Structure-staining relationships in histochemistry and biological staining. Part 3. Some comments on the intentional and artifactual staining of lipids. Acta Histochem Suppl. 1981;24:237–46. [PubMed] [Google Scholar]
- 14.Horobin RW. Structure-staining relationships in histochemistry and biological staining. I. Theoretical background and a general account of correlation of histochemical staining with the chemical structure of the reagents used. J Microsc. 1980;119(3):345–55. doi: 10.1111/j.1365-2818.1980.tb04106.x. [DOI] [PubMed] [Google Scholar]
- 15.Horobin RW, Flemming L. Structure-staining relationships in histochemistry and biological staining. II. Mechanistic and practical aspects of the staining of elastic fibres. J Microsc. 1980;119(3):357–72. doi: 10.1111/j.1365-2818.1980.tb04107.x. [DOI] [PubMed] [Google Scholar]
- 16.Horobin RW, Rashid F. Interactions of molecular probes with living cells and tissues. Part 1. Some general mechanistic proposals, making use of a simplistic Chinese box model. Histochemistry. 1990;94(2):205–9. doi: 10.1007/BF02440189. [DOI] [PubMed] [Google Scholar]
- 17.Rashid F, Horobin RW. Accumulation of fluorescent non-cationic probes in mitochondria of cultured cells: observations, a proposed mechanism, and some implications. J Microsc. 1991;163(Pt 2):233–41. doi: 10.1111/j.1365-2818.1991.tb03175.x. [DOI] [PubMed] [Google Scholar]
- 18.Rashid F, Horobin RW. Interaction of molecular probes with living cells and tissues. Part 2. A structure-activity analysis of mitochondrial staining by cationic probes, and a discussion of the synergistic nature of image-based and biochemical approaches. Histochemistry. 1990;94(3):303–8. doi: 10.1007/BF00266632. [DOI] [PubMed] [Google Scholar]
- 19.Rashid F, Horobin RW, Williams MA. Predicting the behaviour and selectivity of fluorescent probes for lysosomes and related structures by means of structure-activity models. Histochem J. 1991;23(10):450–9. doi: 10.1007/BF01041375. [DOI] [PubMed] [Google Scholar]
- 20.Boland MV, Murphy RF. A neural network classifier capable of recognizing the patterns of all major subcellular structures in fluorescence microscope images of HeLa cells. Bioinformatics. 2001;17(12):1213–23. doi: 10.1093/bioinformatics/17.12.1213. [DOI] [PubMed] [Google Scholar]
- 21.Chen X, Murphy RF. Objective clustering of proteins based on subcellular location patterns. J Biomed Biotechnol. 2005;2005(2):87–95. doi: 10.1155/JBB.2005.87. [DOI] [PMC free article] [PubMed] [Google Scholar]
- 22.Hu Y, Murphy RF. Automated interpretation of subcellular patterns from immunofluorescence microscopy. J Immunol Methods. 2004;290(12):93–105. doi: 10.1016/j.jim.2004.04.011. [DOI] [PubMed] [Google Scholar]
- 23.Murphy RF. Automated interpretation of protein subcellular location patterns: implications for early cancer detection and assessment. Ann N Y Acad Sci. 2004;1020:124–31. doi: 10.1196/annals.1310.013. [DOI] [PubMed] [Google Scholar]
- 24.Murphy RF, Boland MV, Velliste M. Towards a systematics for protein subcelluar location: quantitative description of protein localization patterns and automated analysis of fluorescence microscope images. Proc Int Conf Intell Syst Mol Biol. 2000;8:251–9. [PubMed] [Google Scholar]
- 25.Roques EJ, Murphy RF. Objective evaluation of differences in protein subcellular distribution. Traffic. 2002;3(1):61–5. doi: 10.1034/j.1600-0854.2002.30108.x. [DOI] [PubMed] [Google Scholar]
- 26.Posada MM, Shedden K, Chang YT, Li Q, Rosania GR. Prospecting for Live Cell Bioimaging Probes with Cheminformatic Assisted Image Arrays. 2007:1108–1111. doi: 10.1109/ISBI.2007.357050. [DOI] [PMC free article] [PubMed] [Google Scholar]
- 27.Blake RA. Cellular screening assays using fluorescence microscopy. Curr Opin Pharmacol. 2001;1(5):533–9. doi: 10.1016/s1471-4892(01)00092-3. [DOI] [PubMed] [Google Scholar]
- 28.Lee JW, Jung M, Rosania GR, Chang YT. Development of novel cell-permeable DNA sensitive dyes using combinatorial synthesis and cell-based screening. Chem Commun (Camb) 2003;15:1852–3. doi: 10.1039/b303960a. [DOI] [PubMed] [Google Scholar]
- 29.Li Q, Kim Y, Namm J, Kulkarni A, Rosania GR, Ahn YH, Chang YT. RNA-selective, live cell imaging probes for studying nuclear structure and function. Chem Biol. 2006;13(6):615–23. doi: 10.1016/j.chembiol.2006.04.007. [DOI] [PubMed] [Google Scholar]
- 30.Shedden K, Xie XT, Chandaroy P, Chang YT, Rosania GR. Expulsion of small molecules in vesicles shed by cancer cells: association with gene expression and chemosensitivity profiles. Cancer Res. 2003;63(15):4331–7. [PubMed] [Google Scholar]
- 31.Bereiter-Hahn J. Dimethylaminostyrylmethylpyridiniumiodine (daspmi) as a fluorescent probe for mitochondria in situ. Biochim Biophys Acta. 1976;423(1):1–14. doi: 10.1016/0005-2728(76)90096-7. [DOI] [PubMed] [Google Scholar]
- 32.Li Q, Lee JS, Ha C, Park CB, Yang G, Gan WB, Chang YT. Solid-phase synthesis of styryl dyes and their application as amyloid sensors. Angew Chem Int Ed Engl. 2004;43(46):6331–5. doi: 10.1002/anie.200461600. [DOI] [PubMed] [Google Scholar]
- 33.Li Q, Min J, Ahn YH, Namm J, Kim EM, Lui R, Kim HY, Ji Y, Wu H, Wisniewski T. Styryl-based compounds as potential in vivo imaging agents for beta-amyloid plaques. Chembiochem. 2007;8(14):1679–87. doi: 10.1002/cbic.200700154. [DOI] [PubMed] [Google Scholar]
- 34.Mewes HW, Rafael J. The 2-(dimethylaminostyryl)-1-methylpyridinium cation as indicator of the mitochondrial membrane potential. FEBS Lett. 1981;131(1):7–10. doi: 10.1016/0014-5793(81)80875-7. [DOI] [PubMed] [Google Scholar]
- 35.Vida TA, Emr SD. A new vital stain for visualizing vacuolar membrane dynamics and endocytosis in yeast. J Cell Biol. 1995;128(5):779–92. doi: 10.1083/jcb.128.5.779. [DOI] [PMC free article] [PubMed] [Google Scholar]
- 36.Rosania GR, Lee JW, Ding L, Yoon HS, Chang YT. Combinatorial approach to organelle-targeted fluorescent library based on the styryl scaffold. J Am Chem Soc. 2003;125(5):1130–1. doi: 10.1021/ja027587x. [DOI] [PubMed] [Google Scholar]
- 37.Shedden K, Brumer J, Chang YT, Rosania GR. Chemoinformatic analysis of a supertargeted combinatorial library of styryl molecules. J Chem Inf Comput Sci. 2003;43(6):2068–80. doi: 10.1021/ci0341215. [DOI] [PubMed] [Google Scholar]
- 38.Wang M, Gao M, Miller KD, Sledge GW, Hutchins GD, Zheng QH. Simple synthesis of carbon-11 labeled styryl dyes as new potential PET RNA-specific, living cell imaging probes. Eur J Med Chem. 2008 doi: 10.1016/j.ejmech.2008.02.033. [DOI] [PubMed] [Google Scholar]
- 39.Abraham VC, Taylor DL, Haskins JR. High content screening applied to large-scale cell biology. Trends Biotechnol. 2004;22(1):15–22. doi: 10.1016/j.tibtech.2003.10.012. [DOI] [PubMed] [Google Scholar]
- 40.Chen VY, Khersonsky SM, Shedden K, Chang YT, Rosania GR. System dynamics of subcellular transport. Mol Pharm. 2004;1(6):414–25. doi: 10.1021/mp049916t. [DOI] [PubMed] [Google Scholar]
- 41.Conway BR, Minor LK, Xu JZ, Gunnet JW, DeBiasio R, D'Andrea MR, Rubin R, DeBiasio R, Giuliano K, DeBiasio L. Quantification of G-Protein Coupled Receptor Internatilization Using G-Protein Coupled Receptor-Green Fluorescent Protein Conjugates with the ArrayScantrade mark High-Content Screening System. J Biomol Screen. 1999;4(2):75–86. doi: 10.1177/108705719900400207. [DOI] [PubMed] [Google Scholar]
- 42.Giuliano KA. High-content profiling of drug-drug interactions: cellular targets involved in the modulation of microtubule drug action by the antifungal ketoconazole. J Biomol Screen. 2003;8(2):125–35. doi: 10.1177/1087057103252616. [DOI] [PubMed] [Google Scholar]
- 43.Giuliano KA, Chen YT, Taylor DL. High-content screening with siRNA optimizes a cell biological approach to drug discovery: defining the role of P53 activation in the cellular response to anticancer drugs. J Biomol Screen. 2004;9(7):557–68. doi: 10.1177/1087057104265387. [DOI] [PubMed] [Google Scholar]
- 44.Giuliano KA, Haskins JR, Taylor DL. Advances in high content screening for drug discovery. Assay Drug Dev Technol. 2003;1(4):565–77. doi: 10.1089/154065803322302826. [DOI] [PubMed] [Google Scholar]
- 45.Trapp S, Rosania GR, Horobin RW, Kornhuber J. Quantitative modeling of selective lysosomal targeting for drug design. Eur Biophys J. 2008;37(8):1317–28. doi: 10.1007/s00249-008-0338-4. [DOI] [PMC free article] [PubMed] [Google Scholar]
- 46.Zhang X, Shedden K, Rosania GR. A cell-based molecular transport simulator for pharmacokinetic prediction and cheminformatic exploration. Mol Pharm. 2006;3(6):704–16. doi: 10.1021/mp060046k. [DOI] [PMC free article] [PubMed] [Google Scholar]
- 47.Trapp S, Horobin RW. A predictive model for the selective accumulation of chemicals in tumor cells. Eur Biophys J. 2005 doi: 10.1007/s00249-005-0472-1. [DOI] [PubMed] [Google Scholar]
- 48.Xu JJ, Henstock PV, Dunn MC, Smith AR, Chabot JR, de Graaf D. Cellular imaging predictions of clinical drug-induced liver injury. Toxicol Sci. 2008;105(1):97–105. doi: 10.1093/toxsci/kfn109. [DOI] [PubMed] [Google Scholar]
- 49.Ihlenfeldt WD, Voigt JH, Bienfait B, Oellien F, Nicklaus MC. Enhanced CACTVS browser of the Open NCI Database. J Chem Inf Comput Sci. 2002;42(1):46–57. doi: 10.1021/ci010056s. [DOI] [PubMed] [Google Scholar]
- 50.Keij JF, Bell-Prince C, Steinkamp JA. Staining of mitochondrial membranes with 10-nonyl acridine orange, MitoFluor Green, and MitoTracker Green is affected by mitochondrial membrane potential altering drugs. Cytometry. 2000;39(3):203–10. doi: 10.1002/(sici)1097-0320(20000301)39:3<203::aid-cyto5>3.0.co;2-z. [DOI] [PubMed] [Google Scholar]
- 51.Rosania GR, Ding L, Yoon HS, Chang YT. Combinatorial approach to organelle-targeted fluorescent library based on the styryl scaffold. Journal of the American Chemical Society. 2002 doi: 10.1021/ja027587x. (Submitted) [DOI] [PubMed] [Google Scholar]
- 52.Chang YT, Gray NS, Rosania GR, Sutherlin DP, Kwon S, Norman TC, Sarohia R, Leost M, Meijer L, Schultz PG. Synthesis and application of functionally diverse 2,6,9-trisubstituted purine libraries as CDK inhibitors. Chem Biol. 1999;6(6):361–75. doi: 10.1016/S1074-5521(99)80048-9. [DOI] [PubMed] [Google Scholar]
- 53.Huang K, Murphy RF. From quantitative microscopy to automated image understanding. J Biomed Opt. 2004;9(5):893–912. doi: 10.1117/1.1779233. [DOI] [PMC free article] [PubMed] [Google Scholar]
- 54.Murphy RF. Cytomics and location proteomics: Automated interpretation of subcellular patterns in fluorescence microscope images. Cytometry A. 2005 doi: 10.1002/cyto.a.20179. [DOI] [PubMed] [Google Scholar]
- 55.Murphy RF. Location proteomics: a systems approach to subcellular location. Biochem Soc Trans. 2005;33(Pt 3):535–8. doi: 10.1042/BST0330535. [DOI] [PubMed] [Google Scholar]
- 56.Rosania GR. Supertargeted Chemistry: Identifying Relationships Between Molecular Structures and their Sub-Cellular Distribution. Curr Top Med Chem. 2003;3(6):659–85. doi: 10.2174/1568026033452410. [DOI] [PubMed] [Google Scholar]


