

Abstract
We have developed a new DNA microarray-based technology, termed protein binding microarrays (PBMs), that allows rapid, high-throughput characterization of the in vitro DNA binding site sequence specificities of transcription factors in a single day. Using PBMs, we identified the DNA binding site sequence specificities of the yeast transcription factors Abf1, Rap1, and Mig1. Comparison of these proteins' in vitro binding sites versus their in vivo binding sites indicates that PBM-derived sequence specificities can accurately reflect in vivo DNA sequence specificities. In addition to previously identified targets, Abf1, Rap1, and Mig1 bound to 107, 90, and 75 putative new target intergenic regions, respectively, many of which were upstream of previously uncharacterized open reading frames (ORFs). Comparative sequence analysis indicates that many of these newly identified sites are highly conserved across five sequenced sensu stricto yeast species and thus are likely to be functional in vivo binding sites that potentially are utilized in a condition-specific manner. Similar PBM experiments will likely be useful in identifying novel cis regulatory elements and transcriptional regulatory networks in various genomes.
The interactions between transcription factors (TFs) and their DNA binding sites are an integral part of transcriptional regulatory networks. They control the coordinated expression of thousands of genes during normal growth and in response to external stimuli. Significant progress has been made recently in the accumulation and analysis of mRNA transcript profiles1,2, locations of in vivo binding sites of TFs3-6, and protein-protein interactions7-10. However, many TFs still have unknown DNA binding specificities and regulatory roles.
Earlier technologies aimed at characterizing DNA-protein interactions have been time-consuming and not highly scalable. Microarray-based readout of chromatin immunoprecipitation, known as `ChIP-chip' or genome-wide location analysis, is currently the most widely used high-throughput method for identifying in vivo genomic binding sites for TFs3-6. However, some ChIP-chip experiments do not result in significant enrichment of bound fragments in the immunoprecipitated sample. In addition, there will likely be TFs of interest for which a specific antibody is not available, or for which culture conditions or time points allowing expression and activity of the TF are not known.
Previously we developed a spotted microarray technology that utilized primer-extended double-stranded synthetic DNAs to quantify the differences in binding affinities for various DNA binding sequence variants. This technology allowed us to distinguish proteins with very similar binding site preferences, and to determine the binding specificities of proteins that exhibit highly degenerate sequence preference11. Another group recently extended this technology to employ surface plasmon resonance (SPR)12. Although SPR can provide kinetic data, it is not currently scalable to a large number of samples.
Here we have developed a new in vitro DNA microarray technology for genome-scale characterization of the sequence specificities of DNA-protein interactions. This protein binding microarray (PBM) technology allows the in vitro binding specificities of individual TFs to be determined in a single day, by assaying the sequence-specific binding of those individual TFs directly to double-stranded DNA microarrays spotted with a large number of potential DNA binding sites. Briefly, a DNA binding protein of interest is expressed with an epitope tag, purified, and then bound directly to a double-stranded DNA microarray. The protein-bound microarray is then washed to remove any nonspecifically bound protein, and labeled with a fluorophore-conjugated antibody specific for the epitope tag (Fig. 1a).
Figure 1. Protein binding microarray (PBM) schematic.


(a) Overview of PBM experiments. (b) Whole-genome yeast intergenic microarray bound by Rap1. The fluorescence intensities of the spots are shown in false-color, with white indicating saturated signal intensity, red indicating high signal intensity, green indicating moderate signal intensity, and blue indicating low signal intensity. (c) Zoom-in on a portion of the whole-genome yeast intergenic microarray bound by Rap1.
We focused our efforts on the Saccharomyces cerevisiae yeast genome because of its usefulness as a model organism for both experimental and computational studies. Binding site data from PBMs on yeast TFs corresponded well with binding site specificities determined from ChIP-chip. Moreover, comparative sequence analysis of the PBM-derived binding sites indicated that many of the sites bound in PBMs, including some not identified by ChIP-chip, are highly conserved in other sensu stricto yeast genomes and thus likely to be functional in vivo binding sites that potentially are utilized in a condition-specific manner. Our PBM technology will likely aid in the annotation of many regulatory proteins whose DNA binding specificities have not been characterized and in the construction of gene regulatory networks.
RESULTS
Protein Binding Microarray Experiments
As a validation of this approach, we bound CBP-FLAG-Rpn4 fusion protein to microarrays spotted with positive and negative control spots for binding by Rpn4. We labeled the protein-bound array with Cy3-conjugated M2 anti-FLAG primary antibody (Sigma), and scanned it with a microarray scanner (GSI Lumonics ScanArray). Only the spots that contain good matches to the binding site motif for Rpn4 exhibit high signal intensity (Supplementary Fig. 1). As we previously found that higher signal intensity is in general indicative of higher DNA-protein binding affinity11, this CBP-FLAG-Rpn4 PBM indicates that our new PBM technology is successful in identifying sequence-specific TF binding.
Next, we applied the PBM technology on a genome-wide scale by using whole-genome yeast intergenic arrays in PBM experiments to identify the sequence specificities and target genes of three yeast TFs: Abf1, Rap1, and Mig1. Abf1 has a zinc finger DNA binding domain, binds origins of replication, and regulates ribosome synthesis. Rap1 binds DNA via a Myb-like helix-turn-helix DNA binding domain and, in addition to regulating ribosome synthesis13, regulates telomere length and expression at the silent mating-type loci HML and HMR14. Mig1 has a zinc finger DNA binding domain and is involved in the repression of glucose-repressed genes15.
We used Abf1, Rap1, and Mig1, dually-tagged at the N-terminus with glutathione S-transferase (GST) and His6, in PBM experiments using microarrays spotted with essentially all the intergenic regions in the yeast genome3. The washed, protein-bound microarrays were labeled with Alexa 488-conjugated anti(GST) antibody (Molecular Probes) and scanned with a microarray scanner. The microarray TIF images were quantified using GenePix Pro version 3.0 software (Methods). Shown in Figure 1b,c is a whole-genome yeast intergenic microarray that was used in a PBM experiment with the yeast TF Rap1. Negative control PBMs did not exhibit sequence-specific DNA binding (Supplementary Fig. 2). For each TF, experiments were performed in triplicate. We found that the PBM data are highly reproducible, with most spots having SD/mean values less than 0.3 (Supplementary Fig. 3).
In order to normalize the PBM data by relative DNA concentration, we stained separate microarrays from the same print run with SybrGreen I (Molecular Probes), which is specific for double-stranded DNA. Shown in Figure 2a is the distribution of the log ratios of mean PBM to mean SybrGreen I signal intensities for the set of triplicate Rap1 PBM experiments. We interpret the distribution of spots on the left, which is fit well by a Gaussian, to correspond to the spots that are bound nonspecifically by the TF. Conversely, we interpret the heavy upper tail of the distribution to correspond to spots bound specifically by the TF. For each spot we calculate a P value for specific binding based on the magnitude of its log ratio relative to the standard deviation of the Gaussian distribution (Methods). Shown in Supplementary Figure 4 are the numbers of unique spots that pass a 0.05, 0.01, or 0.001 P value threshold for the PBM data of Abf1, Rap1, or Mig1. We have used a Bonferroni-corrected P value threshold of 0.001 even though we anticipate that it may increase our false negative rate, so as to increase the likelihood that spots passing our P value threshold correspond to true positives. Note that this approach disfavors very long intergenic regions, as a single binding site embedded within a long fragment may result in only a moderately high log ratio. Portions of a SybrGreen I stained microarray and a corresponding Rap1 PBM are shown in Figure 2b. The spots with high log ratio PBM data in Figure 2b correspond to the intergenic regions directly upstream of known gene targets of Rap1. A complete listing of P values for all intergenic regions for each of Abf1, Rap1, and Mig1 are provided online in Supplementary Data. In total, we identified 189, 294, and 79 putative target intergenic regions for Abf1, Rap1, and Mig1, respectively.
Figure 2. Identifying the specifically bound spots.


(a) Distribution of Rap1 PBM ratio (PBM / SybrGreen I) data. The arrow indicates those spots passing a P value threshold of 0.001 after correction for multiple hypothesis testing. Indicated in red are spots harboring an exact match to a sequence belonging to our discovered Rap1 binding site motif. (b) Zoom-in on intergenic regions, from both PBMs (left) and SybrGreen I stained microarrays (right), upstream of RPL14A, RPL8A, and OPI3, which are known direct targets of Rap1. The fluorescence intensities of the spots are shown in false-color, color-coded as described previously (Fig. 1 legend). PBM P values are corrected for multiple hypotheses. Determination of binding in ChIP-chip experiments (“YES” or “NO”) is described in Methods. All regions shown have an exact match to a sequence belonging to the discovered Rap1 motif (“YES”). For each region, the binding site is conserved across five sensu stricto yeast strains either to within two standard deviations (“2 SD”) or 100% identical at each position (“Exact”) as described in Methods. “*” indicates Rap1 ChIP-chip data from Lee et al.6, and “#” indicates Rap1 ChIP-chip data from Lieb et al.5.
Identification of DNA Binding Site Motifs
For each TF, we analyzed the sequences corresponding to spots with a Bonferroni-corrected P value of less than 0.001 with the motif discovery program BioProspector16 in order to identify DNA binding site motifs for Rap1, Abf1, and Mig1 (Fig. 3). Motifs from PBM data passing less stringent P value thresholds are shown in Supplementary Figure 5. The PBM technology allows the identification of both ungapped (e.g. Rap1 and Mig1) and gapped (e.g. Abf1) binding site motifs. Compared to computational negative controls on matched sets of randomly selected intergenic regions (Methods), the group specificity scores17 derived from the PBM data for each of these three TFs are extremely significant (Fig. 3). Thus, we have confidence that the PBM data represent true sequence-specific binding of the TFs.
Figure 3. DNA binding site motifs as determined by PBMs compared to motifs derived from ChIP-chip data and from TRANSFAC.

Sequence logos were generated essentially as described previously49. Group specificity scores were calculated as described in Methods. “*” indicates Rap1, Abf1, and Mig1 ChIP-chip data from Lee et al.6, and “#” indicates Rap1 ChIP-chip data from Lieb et al.5. Although the Mig1 binding site motif derived from the ChIP-chip data has a statistically significant group specificity score, it is not a match to either the TRANSFAC or PBM Mig1 motif. The Pearson correlation coefficients17 comparing the PBM versus ChIP-chip motifs, as well as those comparing each of these motifs versus the motifs present in the TRANSFAC database18, were as follows: Rap1 PBM versus Lee et al.6 ChIP-chip: 0.992; Rap1 PBM versus Lieb et al.5 ChIP-chip: 0.995; Rap1 PBM versus TRANSFAC: 0.953; Rap1 Lee et al.6 versus Lieb et al.5 ChIP-chip: 0.985; Rap1 Lee et al.6 ChIP-chip versus TRANSFAC: 0.921; Rap1 Lieb et al.5 ChIP-chip versus TRANSFAC: 0.950; Abf1 PBM versus ChIP-chip6: 0.989; Abf1 PBM versus TRANSFAC: 0.978; Abf1 ChIP-chip6 versus TRANSFAC: 0.986; Mig1 PBM versus ChIP-chip6: 0.453; Mig1 PBM versus TRANSFAC: 0.938; Mig1 ChIP-chip6 versus TRANSFAC: 0.406.
The motifs derived from the Rap1, Abf1, and Mig1 PBM data are good matches to the binding site motifs for these factors derived from the TRANSFAC18 Professional database (Fig. 3). To confirm and further explore the high resolution binding site data generated from PBMs, we performed electrophoretic mobility shift assays (EMSAs). In one example, the bound intergenic region iYPL221W contained a highly significant match (GTGCACGGATTT) to the PBM-derived Rap1 binding site motif, but it was a poor match to the TRANSFAC Rap1 motif (Fig. 4a). The TRANSFAC motif would predict the underlined nucleotides to be unfavorable for Rap1 binding, whereas the PBM motif is somewhat degenerate at these positions. Our EMSA analysis confirmed that Rap1 is capable of high affinity binding to this sequence (Fig. 4b). This is an example of a TF binding site that would have been missed by use of the TRANSFAC motif because of the sparseness and potential ascertainment bias in the TRANSFAC database.
Figure 4. EMSAs of PBM-derived Rap1 binding site sequences.
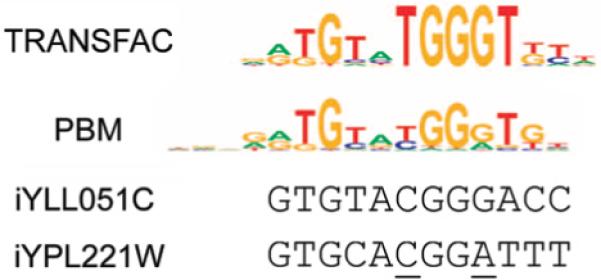

(a) Rap1 binding site sequences present within the DNA probes corresponding to portions of the intergenic regions iYLL051C (P = 3.20 × 10⁻¹⁶) and iYPL221W (P = 3.91 x 10⁻²¹), aligned against the TRANSFAC and PBM-derived Rap1 binding site sequence logos. (b) Lanes 1 and 2, positive control DNA probe; lanes 3 and 4, negative control DNA probe; lanes 5 and 6, DNA probe corresponding to the best Rap1 binding site sequence that could be identified within the iYLL051C intergenic region; lanes 7 and 8, DNA probe corresponding to the PBM-derived Rap1 binding site sequence within the iYPL221W intergenic region. “-” indicates Rap1 protein was not present in the binding reaction; “+” indicates Rap1 protein was present the binding reaction.
To approximate the potential false positive rate from PBMs, we determined the fraction of spots passing a 0.001 P value threshold that was not identified by BioProspector16 as containing a sequence belonging to the given TF's binding site motif (Fig. 2a). This is by no means a perfect measure; some of these potential false positives could simply have either less significant matches to the identified motif or multiple occurrences of lower affinity sites that do not belong to the motif. For example, the bound intergenic region iYLL051C, which had only a weak sequence match to the Rap1 PBM motif (Fig. 4a), was confirmed by EMSAs to be bound by Rap1 in vitro (Fig. 4b). This finding suggests that some high affinity binding sites may not be significant sequence matches to a given TF binding site motif. Thus, our false positive rate may be lower than we have estimated. Nevertheless, using this approximate measure of false positives, we found that our false positive rates ranged from approximately 7% to 9% of `bound' spots.
Comparison of PBM Data and ChIP-chip Data
Of the ~6400, ~6100, and ~6400 unique intergenic PCR products that passed our various PBM data quality control filters for Rap1, Abf1, and Mig1, respectively, ChIP-chip data5,6 were also available for 99.9%, 93.1%, and 93.7% of these intergenic regions. DNA binding site motifs identified with the PBM technology for Abf1 and Rap1 corresponded well to motifs determined from analysis of previously published ChIP-chip data passing a 0.001 P value threshold for these same TFs5,6 (Fig. 3). However, we could derive the binding site motif for Mig1 only from the PBM data and not from the ChIP-chip data6. Unlike for Rap1 and Abf1, the intergenic regions identified as bound by Mig1 in PBMs overlapped with only a few regions identified as bound by ChIP-chip (Fig. 5). Furthermore, many fewer regions total were identified as bound by Mig1 in ChIP-chip as compared to PBMs. Since Mig1 is known to be regulated at the level of nuclear localization15, it is possible that the yeast cultures for the ChIP-chip experiments were such that Mig1 may have been predominantly cytoplasmic. Overall, we have identified 107, 90, and 75 putative new target intergenic regions for Abf1, Rap1, and Mig1, including those upstream of 25, 40, and 29 previously uncharacterized open reading frames (ORFs), respectively. (See Supplementary Figure 6 for comparisons using various P value thresholds.)
Figure 5. Comparison of bound intergenic regions derived from PBM data as compared to those derived from ChIP-chip5,6.


Venn diagrams depicting the results of the comparison for (a) Rap1, (b) Abf1, and (c) Mig1. The Venn diagrams depict data only for those intergenic regions for which data were available for both ChIP-chip and PBMs. “*” indicates Rap1, Abf1, and Mig1 ChIP-chip data from Lee et al.6, and “#” indicates Rap1 ChIP-chip data from Lieb et al.5.
Sequence Conservation of Identified Binding Sites
To find evidence supporting our hypothesis that the regions bound only in vitro are likely to be functional in vivo but for some specific biological reason have not been identified previously, we mapped the predicted binding sites in S. cerevisiae to the orthologous positions in the S. mikatae, S. kudriavzevii, S. bayanus, and S. paradoxus genomes19,20. Importantly, we found that all amino acid residues important in DNA-protein recognition were identical across these five sensu stricto species for Abf1, Rap1, and Mig1. We examined binding site conservation two different ways (Methods). Firstly, we called a site conserved if the orthologous sequence in all five species was within two standard deviations of the motif average21 derived from the set of regions passing a 0.001 P value threshold in PBMs. Secondly, we employed a very strict measure of sequence conservation, in which we required 100% sequence identity at all informative nucleotide positions of the TF binding site in all five species. Although the level of conservation varied for these three TFs, the binding sites within regions bound in PBMs were just as likely to be conserved as the binding sites within regions bound in ChIP-chip (Fig. 6). Furthermore, the regions bound only in PBMs and not in ChIP-chip showed approximately the same degree of conservation. PBM experiments identified 23, 70, and 38 putative binding sites for Mig1, Abf1, and Rap1, respectively, that were conserved within two standard deviations in all five species and that were not identified as `bound' in ChIP-chip experiments5,6. Moreover, the regions bound only in PBMs identified between six and ten new conserved sites that are 100% identical across all five species. Based upon the known conservation level across the sensu stricto genomes20, the probability of observing even a single binding site that is 100% conserved by chance is extremely small. Thus, we believe that the intergenic regions bound in PBMs are very likely to contain functional in vivo binding sites.
Figure 6. Cross-species sequence conservation of binding sites identified from PBM data as compared to those identified from ChIP-chip data.

From left to right for a single TF, bars represent all spots bound in PBMs, all spots bound in ChIP-chip, and spots bound in PBMs and not ChIP-chip. Spots were called `bound' as described in Methods. Shown in dark gray is the subset of bound spots with S. cerevisiae binding sites conserved to within two standard deviations of the motif average across all five sensu stricto species. Shown in black is the subset of S. cerevisiae bound spots with conserved sites 100% identical across all five species. The remaining bound spots are in light gray.
Identification of Target Genes
We examined each of the sets of intergenic regions bound in PBMs to determine whether the candidate target genes, located directly downstream of the bound intergenic regions, were over-represented for particular functional groups17,22 Methods). A complete listing of all candidate target genes and significantly enriched functional categories for all three TFs is provided online (Supplementary Data). Among the significantly enriched categories for the Rap1 candidate target genes, a large number are consistent with the known regulatory functions of Rap1 (ref. 13), including the MIPS functional categories for ribosome biogenesis, protein synthesis, structural constituents of the ribosome, and cell growth and/or maintenance. In addition, 40 previously uncharacterized ORFs are among the newly identified putative Rap1 target genes. As further support of their functional significance, many of the corresponding enriched target genes from the PBM data, including the uncharacterized ORFs YDR109C, YKL151C, YIL001W, and YKL082C, had upstream Rap1 binding sites that were conserved across all five sensu stricto yeast species (Fig. 6).
Further characterization of these target genes may identify heretofore unknown biological functions for Rap1. Ydr109c shows strong homology (BLAST E-value = 6.0 × 10-97) to a number of ribitol kinases, and Ykl151c shows homology (BLAST E-value = 2.0 × 10⁻¹⁵) to a carbohydrate kinase family, suggesting that Rap1 might connect the nutrient status of a cell with its translational capacity. Yil001w shows strong homology (BLAST E-value = 4.0 × 10⁻²⁶) to human elongation factor 1A binding protein, implying its likely role in protein synthesis. YKL082C is thought to encode a nucleolar protein that is required for normal pre-rRNA processing and is involved in the establishment of cell polarity23. Interestingly, gene expression of YKL082C clusters with that of several Rap1 targets identified by PBM and ChIP-chip, including RPS27A (ribosomal protein), UBP10 (telomeric silencing), as well as BUD22 and BUD27 (bud site selection)24. Bud27 is also involved in gene expression controlled by the TOR kinase, which is known for its role in transducing the availability of nutrients into growth and ribosome synthesis.
The significantly enriched categories for the target genes derived from the Abf1 PBM data are also consistent with the known regulatory functions of Abf1 (ref. 13), including the GO biological process categories for cell growth and/or maintenance, cell organization and biogenesis, and essentiality. Among the Abf1 candidate target gene categories identified in this study that were not previously identified as targets by ChIP-chip, there was an enrichment for the MIPS subcellular localization functional category of the mitochondrial outer membrane, the MIPS protein complex functional category for the mitochondrial translocase complex, and the GO Biological Process functional categories of nucleic acid metabolism and protein metabolism. In all, we identified 25 novel uncharacterized putative target genes for Abf1, approximately half of which are downstream of Abf1 sites conserved across all five sensu stricto species. Of note, Yhr020w shows homology to a Drosophila glutamyl-prolyl-tRNA synthetase (BLAST E-value = 10-172). YHR020W previously has been shown to be co-expressed with several other putative Abf1 targets involved in protein and nucleic acid metabolism24.
A much more complete picture of the regulatory functions of Mig1 was possible from analysis of the PBM target genes than could be derived from the available ChIP-chip data6. Several known Mig1 target genes, including DOG2 (ref. 25), EMI2 (ref. 15), FBP1 (ref. 26), GAL4 (ref. 27), GUT1 (ref. 28), HXK1 (ref. 15), HXT1 (ref. 15), HXT2 (ref. 29), JEN1 (ref. 30), REG2 (ref. 15), YFL054C15 and YKR075C15, were identified only by PBMs. Among the enriched functional categories were those for C-compound and carbohydrate metabolism, carbohydrate transporters, and alcohol metabolism, all of which are consistent with the known regulatory function of Mig1 as a transcriptional repressor of genes whose products are dispensable at high levels of glucose15. We identified many novel putative target genes for Mig1, 29 of which were previously uncharacterized, including the ORFs YNR071C, YIL024C, YLR089C, YOR356W, and YLR072W.
Ynr071c shows strong homology (BLAST E-value = 9.0 × 10-87) to Gal10, which has a key role in galactose metabolism. Yil024c, has homology, albeit low (WU-BLAST2 E-value = 0.09), to Sip2, a member of a family of proteins that interact with Snf1 and Snf4 and that are involved in the response to glucose starvation31. YLR089C and YOR356W both encode proteins that are localized to the mitochondria32 and are likely to be important in the catabolism of fuel molecules. Ylr089c shows homology to Bna3, which is involved in NAD biosynthesis, and to alanine aminotransferases in species ranging from plants to human (BLAST E-value = 10-116). These transaminases mediate the conversion of major metabolites involved in gluconeogenesis and amino acid metabolism. Yor356w shows strong homology (BLAST E-value = 10-159) to a human electron transfer flavoprotein-ubiquinone oxidoreductase. Notably, YIL024C, YLR089C, and YOR356W are immediately downstream of Mig1 binding sites that are conserved in all five sensu stricto species. Our results also indicate a possible role of Mig1 in cholesterol biosynthesis. Mig1 shows strong homology to the human TF WT1, which has recently been implicated in repression of the mevalonate pathway central in cholesterol biosynthesis33. Similarly, Ylr072w shows homology to Atg26, a sterol 3-beta glucosyl transferase involved in sterol metabolism.
Finally, we investigated whether the collective group of target genes for each TF showed concerted expression in particular experimental conditions. We hypothesized that by combining PBM and expression data, we could infer optimal conditions for TF activity. We used 643 publicly available S. cerevisiae gene expression datasets to identify conditions in which significant fractions of Abf1, Rap1, and Mig1 PBM target genes were differentially expressed. The conditions that exhibited the largest number of differentially regulated candidate target genes corresponded well with the known functions of each TF (Supplementary Note). For example, many Mig1 PBM target genes were down-regulated at least 2.5-fold in glucose and fructose, compared to other carbon sources. These results show that together with expression profiling, PBM analysis can provide insight into the functions of particular TFs and identify conditions in which they are active in vivo. This information can also be used to prioritize conditions for ChIP-chip experiments, which require that the TF under study be expressed and active.
DISCUSSION
This PBM technology allows rapid, high-throughput characterization of the DNA binding site sequence specificities of TFs in a single day and can associate TFs with the genes they regulate. In addition to identifying enriched functional categories of known and newly discovered target genes, we also identified many uncharacterized ORFs as candidate target genes of Rap1, Abf1, and Mig1. As could be seen for Mig1, PBM experiments will be particularly useful when ChIP-chip does not result in enough enrichment of bound fragments in the immunoprecipitated sample to permit identification of the DNA sites bound in vivo. ChIP-chip experiments require that the cells be in culture conditions in which the TF of interest is expressed and nuclear. Furthermore, it is possible that the antibody used in ChIP-chip may not be able to detect certain classes of TF DNA binding in vivo, such as if the primary epitope(s) become inaccessible due to the formation of particular complexes at certain sites. Moreover, integrating an epitope tag on the genomic copy of the TF, which allowed the use of a single antibody in the 106 ChIP-chip experiments performed by Lee et al.6, is not as trivial in many other organisms as it is in yeast; instead, protein-specific antibodies that are both specific and successful in chromatin immunoprecipitation are required, and the generation of such antibodies is not a trivial undertaking.
Even though the DNA in PBM experiments is not in the same state as it might be if it were to be bound by the TF in vivo, results from PBM experiments can provide valuable data on the sequence specificity of TFs, particularly those which have been poorly understood or uncharacterized thus far. Performing ChIP-chip experiments on yeast grown under a variety of different culture conditions will help to confirm our predictions that particular sets of newly identified binding sites are indeed bound in vivo34. Furthermore, the combination of PBM data with mRNA expression data, ChIP-chip data, protein-protein interaction data, and prior genetic and biochemical data in the literature will contribute towards more detailed models of gene regulatory networks in yeast35.
It is possible that results from PBM and ChIP-chip experiments will not correspond so closely for all proteins. Such differences may help to identify whether there are significant in vivo effects due to chromatin structure or cofactors important in allowing or preventing sequence-specific binding. In order to look for evidence for such co-regulatory mechanisms, for each TF we searched the sets of intergenic regions bound only in vitro or only in vivo for secondary DNA sequence motifs. We did not find any secondary motifs that achieved statistical significance, potentially because of the many different modes by which binding of TFs to DNA is regulated in vivo. However, it is possible that such secondary motifs might exist for TFs not studied here.
The data presented here indicate that the PBM approach works for TFs with DNA binding domains of a number of different structural classes. PBMs could also be used to study DNA binding proteins important in other biological processes, such as DNA replication, DNA repair, genome rearrangements, or modification of DNA. Since PBM experiments are highly scalable, they could be adapted for the analysis of all possible DNA sequence variants. Similarly, there are hundreds of predicted DNA binding proteins in yeast and thousands of predicted TFs in other genomes that could be screened for sequence-specific binding by PBM experiments. Since dozens of PBM experiments could be performed in parallel in a single day, this technology provides significant cost and time advantages over other methods, which can take months to measure the effects of mutations for a large set of variant DNA-protein interactions.
The effects of different concentrations of TFs, protein cofactors, protein modifications, small molecule cofactors such as metabolites, or various binding conditions could be measured with PBMs. Indeed, it has been shown that in vitro binding specifically by heterodimeric TFs can be detected with a PBM approach36. Similarly, PBMs could be used to distinguish the relative binding preferences of various whole or partially fractionated cell lysates, such as from various cell types, sampled at different time points or grown under different conditions.
Bioinformatic analysis of PBMs will provide more informative data than a mononucleotide PWM, as it has been shown previously that nucleotides of TF binding sites frequently do not act independently in binding by TFs37-39. Moreover, the vast datasets that would be generated on DNA-protein interactions by PBMs could yield the necessary data required to determine what predictive rules may exist that describe DNA recognition by sequence-specific TFs40.
Finally, only a small handful of sequence-specific TFs have been characterized well enough to know many of the sequences that the TFs can and, just as importantly, cannot bind. Ultimately more complete TF binding site data will permit more accurate prediction of functional cis regulatory elements within the vast stretches of noncoding sequence in the genomes of both model organisms and the human genome than has been possible thus far41.
METHODS
Synthesis of DNA Microarrays
Microarrays spotted with double-stranded DNAs containing either positive or negative control binding sites for Rpn4 for the PBM proof-of-principle experiments with CBP-FLAG-Rpn4 were synthesized essentially as described previously11. Exact methods and oligonucleotides are described online in Supplementary Methods. Whole-genome yeast intergenic microarrays were synthesized essentially as described previously3.
Expression and Purification of Yeast Transcription Factors
N-terminal CBP-FLAG fusions of RPN4 were created by cloning RPN4 into the pCAL-n-FLAG vector (Stratagene). The resulting CBP-FLAG-RPN4 fusion constructs were full-length sequence-verified to ensure that no mutations had been introduced during cloning. Verified CBP-FLAG-RPN4 constructs were transformed into BL21-Gold(DE3)pLysS E. coli (Stratagene) and expressed by inoculating LB medium containing 50 μM zinc acetate and 50 μg/ml carbenicillin with an overnight culture (1:20 dilution), growing at 30 °C to an OD600 between 0.3 and 0.5, and then inducing with 1 mM IPTG until an OD600 of 1.0 was reached. Cell pellets were stored at -80 °C, and subsequently were thawed on ice and lysed with CelLyticB Bacterial Cell Lysis Extraction Reagent (Sigma) containing 50 μM zinc acetate. The CBP-FLAG fusion proteins were purified with anti-FLAG M2 affinity gel (Sigma), and subsequently quantified. Sequence-specific binding of the purified Rpn4 fusion protein was verified with EMSAs using probes containing the consensus PACE site17 (data not shown). Purified proteins were stored at -80°C until use.
N-terminal GST-His6 fusions of Rap1, Abf1, and Mig1 were produced essentially as described previously42. Briefly, the fusion proteins were expressed in S. cerevisiae, and then individually purified with glutathione beads (Amersham), concentrated using Microcon YM-30 filters (Millipore), and subsequently quantified. Purified proteins were stored at -80 °C until use.
Protein Binding Microarray (PBM) Experiments
PBM experiments and SybrGreen I staining of the DNA microarrays were performed in triplicate, essentially as described previously11. Briefly, previously purified proteins were thawed on ice and diluted to a 20 nM final concentration in a 100 μl protein binding reaction mixture consisting of PBS, 50 μM zinc acetate (ZnAc), 2% (w/v) nonfat dried milk, 51.3 ng/μl salmon testes DNA (Sigma), and 0.2 μg/μl BSA; this protein binding reaction was allowed to pre-incubate for 1 hr at room temperature. Microarrays were pre-wet in PBS/0.01% Triton X-100 and then blocked with 2% milk in PBS for 1 hr. The blocked microarrays were washed once with PBS/0.1% Tween 20, and then once with PBS/50 μM ZnAc/0.01% Triton X-100 (PBS/ZnAc/TX100). The pre-incubated protein binding mixtures were then applied to the microarrays and binding was allowed to proceed for 1 hr. The microarrays then were washed once with PBS/ZnAc/0.5% Tween 20, and then once with PBS/ZnAc/TX100. Alexa 488-conjugated rabbit anti(GST) polyclonal antibody (Molecular Probes) or Cy3-conjugated mouse anti(FLAG) M2 monoclonal antibody (Sigma) was diluted in PBS/ZnAc containing 2% milk, pre-incubated for at least 30 min, and applied to the microarray. After incubation for 1 hr, the microarrays were washed 3 times with PBS/ZnAc/0.05% Tween 20, and once with PBS/ZnAc. The slides were then spun dry, and stored in a closed box until being scanned.
Microarray Imaging and Data Analysis
All whole-genome yeast intergenic microarrays were from the same print run, so as to minimize variation. We typically scanned (GSI Lumonics ScanArray 4000 or ScanArray 5000) the labeled, protein-bound microarrays and the SybrGreen I stained microarrays at 3-6 different laser power intensities or PMT gain settings per microarray; this allowed us to capture signal intensities for even very low signal intensity spots, while ensuring that we captured sub-saturation signal intensities for each of the spots on the microarray11. Microarrays were scanned using appropriate lasers and filter sets, essentially as described previously11.
Microarray TIF images were quantified using GenePix Pro version 3.0 software (Axon Instruments, Inc.). Specifically, background-subtracted median intensities were calculated using the median local background. We used masliner (MicroArray Spot LINEar Regression) software to calculate the relative signal intensities over the full series of laser power (or PMT gain) setting scans in a semi-automated fashion. Specifically, masliner combines the linear ranges of multiple scans from different scanner sensitivity settings onto an extended linear scale11,43. This resulted in the dynamic range of the final PBM and SybrGreen I stained microarrays to have fluorescence intensities that spanned 5 to 6 orders of magnitude.
The resulting microarray data were filtered with a number of quality control criteria so that only data from high quality spots were retained. First, for each of the triplicate microarrays, we removed data corresponding to any flagged spots (i.e., spots that had dust flecks, etc.). Data from each of three triplicate microarrays were normalized according to total signal intensity, so that the average spot intensity was the same for all three slides. Then, within each individual slide, the data were separated into sectors, according to their local region on the slide; for the whole-genome yeast intergenic arrays we sectored the spots into the 32 subgrids of the printed microarray. The data were then normalized again so that the mean spot intensity was the same over all the sectors; this served to normalize for any region-specific inhomogeneities in the background and also binding and labeling reactions. Any spots with SD/median greater than 2, i.e., spots with highly variable pixel signal intensities, were filtered out. The background-subtracted, normalized signal intensities for all spots with reliable data in at least two of the three replicate microarrays were averaged, and the SD/mean was calculated. The SybrGreen I microarray data were treated exactly the same way, except that any spots with fewer than 50% pixels with signal intensities greater than two standard deviations beyond the median background signal intensity were also filtered out, as these spots presumably do not have enough DNA present to allow accurate quantification of signal intensities. For the Rap1, Abf1, and Mig1 PBM datasets, ~91-96% of 6723 unique spots passed these criteria. A detailed description of these quality control filters is available online in Supplementary Methods.
Subsequent analyses were performed with Perl scripts written by M.F.B. Specifically, we calculated the fractional signal intensity of each spot, relative to the total signal intensity on the microarray. We then calculated the log2 ratio of the mean PBM signal intensity divided by the mean SybrGreen I signal intensity, and created a scatter plot of the log ratio versus the spots' SybrGreen I signal intensities. Although we expect that the log ratio should be independent of DNA concentration, we have found that higher DNA concentrations, as determined by higher SybrGreen I signal intensities, appear to bind proportionately less protein. In order to restore the independence of log ratio and SybrGreen I intensity, the scatter plot was fit with a locally weighted least squares regression using the LOWESS function44 of the R statistics package (smoothing parameter = 0.5). We subtracted the value of the regression at each spot from its log ratio, yielding a modified log ratio that is independent of DNA concentration. We then plotted the distribution of all log ratios as a histogram (bin size = 0.05), which for Rap1, Abf1, and Mig1 resembled a Gaussian distribution with a heavy tail. We determined the mode of the distribution by searching for the window of nine bins with the highest number of spots and taking the middle bin. We then reflected all values less than the mode and fit these values to a Gaussian function using the Mathematica software package (Wolfram Research, Inc.). This gave the mean and standard deviation of the distribution, and the mean was used to adjust the log ratios so that the peak was centered on zero. We calculated a P value for each individual spot based on the magnitude of its log ratio relative to the standard deviation of the Gaussian distribution, using the normal error integral. In order to correct for multiple hypothesis testing, all individual P values were adjusted to a modified significance level using the Modified Bonferroni Method38,45. For significance testing of the PBM data, we used an initial α = 0.001, which corresponded to α' equal to approximately 1.5 × 10⁻⁷ for the highest-ranking test case, as we were typically evaluating ~6400 unique spots.
DNA Motif Finding and Group Specificity Score
For analysis of sequences for over-represented DNA sequence motifs, we used BioProspector16. We chose BioProspector over other available motif finding programs because it proved to be the most inclusive in accepting the largest number of input sequences in construction of the TF binding site motifs. To search for motifs that were over-represented in PBM experiments, we used all sequences from spots that had a Bonferroni-corrected P value less than or equal to 0.001 as input. To search for motifs that were over-represented in the intergenic regions bound in ChIP-chip experiments, we input either all sequences with a P value less than or equal to 0.001 (ref. 6) or all sequences with a median percentile rank at or above 0.92 in the six replicate experiments and below 0.92 in controls5. For each set of input sequences, we performed separate searches at each width between 6 and 18 nucleotides in order to identify the highest scoring motifs at each width. We chose the single motif with the highest group specificity score17 to be the most significant, using the set of all sequences spotted on the microarray as the background. Briefly, the group specificity score indicates the degree to which the property of containing the sequence motif is specific to the input set of intergenic regions, as determined from the most significantly bound spots on the microarrays, with a smaller group specificity score indicating that the motif is more specific to the input set of spots (i.e., either the spots beyond a 0.001 P value threshold in either the PBM or Lee et al.6 ChIP-chip data, or the spots at or beyond the 92nd percentile rank in the Lieb et al.5 ChIP-chip data, or the randomly selected spots in the computational random controls). In order to assess the statistical significance of the DNA sequence motifs resulting from analysis of the PBM experiments, we performed a set of computational negative control experiments. In these computational negative controls, we performed identical motif searches on 10 individual sets of randomly selected spots from the yeast intergenic microarrays for each TF, with each random set containing the same number of sequences as the original input sets for each of the Rap1, Abf1, and Mig1 PBM datasets. The range of group specificity scores for the Rap1 control sets was 2.2 × 10⁻⁵ to 3.5 × 10⁻¹¹, with a geometric mean equal to 8.4 × 10⁻⁸; the range of group specificity scores for the Abf1 control sets was 5.6 × 10⁻³ to 1.3 × 10⁻⁶, with a geometric mean equal to 3.7 × 10⁻⁵; and the range of group specificity scores for the Mig1 control sets was 4.8 × 10⁻³ to 1.8 × 10⁻⁵, with a geometric mean equal to 4.8 × 10⁻⁴. Thus, the Rap1, Abf1, and Mig1 motifs identified from the intergenic regions identified as bound in PBM experiments had highly significant group specificity scores as compared to the random controls. We also determined the motifs' Pearson correlation coefficients using CompareACE17.
In order to identify motifs potentially responsible for inhibition of binding or for recruitment, for each TF we performed motif finding using BioProspector16 and MDscan46 on intergenic regions enriched only on PBMs or in ChIP-chip experiments, respectively. To score such potential secondary motifs, group specificity scores were computed to select those motifs enriched in intergenic regions bound only on PBMs or only in ChIP-chip relative to those bound in both types of assays. The significance of a group specificity score was assessed by comparison with scores returned from performing motif finding on random data sets, where the number of input sequences was the same. For identifying potential motifs under the recruitment model, spots bound at P values above 0.05 in PBMs and below 0.05 in ChIP-chip were searched. Intergenic regions were selected for searches for motifs that might allow inhibition of TF binding, if the intergenic regions had Bonferroni-corrected P values below 0.001 in PBMs and above 0.05 in ChIP-chip. Specifically, both the sequences spotted on the array plus an additional 500 bp of flanking sequence on both sides of the spotted PCR amplicon were searched, in case the ChIP-chip positives reflected TF binding to a site near the spotted intergenic sequence that then hybridized because of complementary flanking sequence due to the sonication protocol. After searching for candidate motifs, we used a CompareACE17 cutoff of 0.7 both for merging similar discovered motifs and for identifying matches to previously known motifs.
Electrophoretic Mobility Shift Assays (EMSAs)
EMSAs were performed essentially according to manufacturer's protocols for the LightShift© Chemiluminescent EMSA Kit (Pierce). Complementary biotinylated DNA oligonucleotides, each 45 bp in length, were synthesized (Integrated DNA Technologies) such that they contained the predicted Rap1 binding site, flanked by its native sequence from the given intergenic region. A positive control probe containing a known Rap1 binding site and a negative control probe lacking a Rap1 binding site were also synthesized and used in EMSAs. A listing of the oligonucleotide sequences and detailed protocols used in constructing the EMSA probes is available online in Supplementary Methods.
Analysis of Functional Category Enrichment
Analysis of a group of genes for enrichment for a particular functional annotation previously has been used to analyze sets of yeast genes that comprise particular gene expression clusters22. We used the web-based tool FunSpec for the statistical evaluation of the groups of genes downstream of the `bound' intergenic regions, for groups of over-represented gene and protein categories with respect to existing functional category information from a number of public and published databases47. Like the group specificity score described above17, FunSpec uses the hypergeometric distribution to calculate a P value for functional category enrichment17,22.
Analysis of Cross-Species Sequence Conservation
We searched for conserved putative binding sites in the five sequenced genomes of the yeast sensu stricto clade: S. cerevisiae, S. mikatae, S. kudriavzevii, S. bayanus, and S. paradoxus. Our searches were limited to the aligned regions in the MultiZ multiple sequence alignment downloaded from the UCSC Genome Browser. Regions aligned between S. cerevisiae and each of the other four species were separately mapped onto the S. cerevisiae chromosomal coordinates. We used ScanACE17 to search all five genomes for sequence matches within two standard deviations of the motif identified from PBM experiments. In our first approach, a site was called conserved if its ScanACE score was within two standard deviations of the motif average21 that we determined from the set of regions passing a 0.001 P value threshold in PBMs and if its relative position in each genome differed by no more than 15 bp. In our second approach, a site was called exactly conserved if it satisfied the previous conditions and was identical in all five species at each of the informative positions. Here, for “exact” conservation we employed a very strict measure of sequence conservation, in which we required 100% sequence identity at all informative nucleotide positions of the binding site (9, 9, or 12 positions for Mig1, Abf1, and Rap1, respectively), in all five species. We defined informative positions to be those with an information content of greater than 0.5 bits in the PBM-derived motif. Analyses were performed with Perl scripts written by M.F.B.
Analysis of Correlation of Target Genes with Gene Expression Data
Gene expression data from 643 yeast expression microarray experiments across a variety of culture conditions48 were normalized so that the log2 of the fold-change within each microarray had a mean of 0 and standard deviation of 1. In order to identify conditions under which a particular TF either activated or failed to repress transcription, we calculated the fraction of putative target ORFs with at least a 2.5-fold increase in gene expression for each individual condition. Similarly, to find conditions in which a TF acted as a repressor or failed to activate transcription, we calculated the fraction of putative target ORFs with at least a 2.5-fold decrease in gene expression for each condition. Significance was assessed by comparison with 100 sets of randomized ORFs, matched in size to the lists of target genes for each TF. Each condition was assigned a score equal to the percentage of genes in each set that was up-regulated, and separately down-regulated, in the corresponding gene expression dataset. We used the single highest score over all conditions for all random sets as our significance threshold. Any condition for which a larger fraction of predicted target genes was up-regulated or down-regulated was called significant with p < 0.01. For this analysis, we considered ORFs to be candidate target genes if they were no more than 500 bp downstream of an intergenic region bound in PBMs at a 0.001 P value threshold.
Analysis of Candidate Target Genes' Sequence Homologies
The BLASTP search tool at the Saccharomyces Genome Database web server was used to analyze the sequence homologies of candidate target genes within S. cerevisiae, which resulted in WU-BLAST2 E-values, and also in all organisms at NCBI, which resulted in BLAST E-values.
Supplementary Material
ACKNOWLEDGMENTS
We thank T. Volkert and T. Lee for synthesis of the whole-genome yeast intergenic microarrays, B. Huber for assistance with motif searches, L. Campbell and M. Blayney for technical assistance, and M. Chou and A. Philippakis for helpful discussion. This work was supported by National Institutes of Health grants from the National Human Genome Research Institute to M.L.B. and to R.Y., and from the National Institute of General Medical Sciences to M.S. M.L.B. was also supported by a Pharmaceutical Research and Manufacturers of America (PhRMA) Foundation Informatics Research Starter Grant and an HST Taplin Award. S.M. was supported in part by the MIT Class of 1973 Undergraduate Research Opportunities Program Fund and an MIT Bioengineering Undergraduate Research Award. M.F.B. was supported in part by a Graduate Research Fellowship from the National Science Foundation.
Footnotes
URLs Supplementary Methods, Supplementary Figures, Supplementary Table, Supplementary Note, and Supplementary Data are available on the Bulyk lab website (http://the_brain.bwh.harvard.edu/publications.html).
Note: Supplementary Information is available on the Nature Genetics website.
COMPETING INTERESTS STATEMENT The authors declare that they have no competing financial interests.
REFERENCES
- 1.Schena M, Shalon D, Davis RW, Brown PO. Quantitative monitoring of gene expression patterns with a complementary DNA microarray. Science. 1995;270:467–470. doi: 10.1126/science.270.5235.467. [DOI] [PubMed] [Google Scholar]
- 2.Wodicka L, Dong H, Mittmann M, Ho MH, Lockhart DJ. Genome-wide expression monitoring in Saccharomyces cerevisiae. Nat. Biotechnol. 1997;15:1359–1367. doi: 10.1038/nbt1297-1359. [DOI] [PubMed] [Google Scholar]
- 3.Ren B, et al. Genome-wide location and function of DNA binding proteins. Science. 2000;290:2306–2309. doi: 10.1126/science.290.5500.2306. [DOI] [PubMed] [Google Scholar]
- 4.Iyer VR, et al. Genomic binding sites of the yeast cell-cycle transcription factors SBF and MBF. Nature. 2001;409:533–538. doi: 10.1038/35054095. [DOI] [PubMed] [Google Scholar]
- 5.Lieb JD, Liu X, Botstein D, Brown PO. Promoter-specific binding of Rap1 revealed by genome-wide maps of protein-DNA association. Nat. Genet. 2001;28:327–334. doi: 10.1038/ng569. [DOI] [PubMed] [Google Scholar]
- 6.Lee T, et al. Transcriptional regulatory networks in Saccharomyces cerevisiae. Science. 2002;298:799–804. doi: 10.1126/science.1075090. [DOI] [PubMed] [Google Scholar]
- 7.Uetz P, et al. A comprehensive analysis of protein-protein interactions in Saccharomyces cerevisiae. Nature. 2000;403:623–627. doi: 10.1038/35001009. [DOI] [PubMed] [Google Scholar]
- 8.MacBeath G, Schreiber SL. Printing proteins as microarrays for high-throughput function determination. Science. 2000;289:1760–1763. doi: 10.1126/science.289.5485.1760. [DOI] [PubMed] [Google Scholar]
- 9.Ito T, et al. Toward a protein-protein interaction map of the budding yeast: A comprehensive system to examine two-hybrid interactions in all possible combinations between the yeast proteins. Proc. Natl. Acad. Sci. USA. 2000;97:1143–1147. doi: 10.1073/pnas.97.3.1143. [DOI] [PMC free article] [PubMed] [Google Scholar]
- 10.Ho Y, et al. Systematic identification of protein complexes in Saccharomyces cerevisiae by mass spectrometry. Nature. 2002;415:180–183. doi: 10.1038/415180a. [DOI] [PubMed] [Google Scholar]
- 11.Bulyk ML, Huang X, Choo Y, Church GM. Exploring the DNA-binding specificities of zinc fingers with DNA microarrays. Proc. Natl. Acad. Sci. USA. 2001;98:7158–7163. doi: 10.1073/pnas.111163698. [DOI] [PMC free article] [PubMed] [Google Scholar]
- 12.Linnell J, et al. Quantitative high-throughput analysis of transcription factor binding specificities. Nucleic Acids Res. 2004;32:e44. doi: 10.1093/nar/gnh042. [DOI] [PMC free article] [PubMed] [Google Scholar]
- 13.Planta RJ. Regulation of ribosome synthesis in yeast. Yeast. 1997;13:1505–1518. doi: 10.1002/(SICI)1097-0061(199712)13:16<1505::AID-YEA229>3.0.CO;2-I. [DOI] [PubMed] [Google Scholar]
- 14.Konig P, Giraldo R, Chapman L, Rhodes D. The crystal structure of the DNA-binding domain of yeast RAP1 in complex with telomeric DNA. Cell. 1996;85:125–136. doi: 10.1016/s0092-8674(00)81088-0. [DOI] [PubMed] [Google Scholar]
- 15.Lutfiyya LL, et al. Characterization of three related glucose repressors and genes they regulate in Saccharomyces cerevisiae. Genetics. 1998;150:1377–1391. doi: 10.1093/genetics/150.4.1377. [DOI] [PMC free article] [PubMed] [Google Scholar]
- 16.Liu X, Brutlag D, Liu J. BioProspector: discovering conserved DNA motifs in upstream regulatory regions of co-expressed genes. Pac. Symp. Biocomput. 2001:127–138. [PubMed] [Google Scholar]
- 17.Hughes JD, Estep PW, Tavazoie S, Church GM. Computational identification of cis-regulatory elements associated with groups of functionally related genes in Saccharomyces cerevisiae. J. Mol. Biol. 2000;296:1205–1214. doi: 10.1006/jmbi.2000.3519. [DOI] [PubMed] [Google Scholar]
- 18.Wingender E, et al. TRANSFAC: an integrated system for gene expression regulation. Nucleic Acids Res. 2000;28:316–319. doi: 10.1093/nar/28.1.316. [DOI] [PMC free article] [PubMed] [Google Scholar]
- 19.Kellis M, Patterson N, Endrizzi M, Birren B, Lander E. Sequencing and comparison of yeast species to identify genes and regulatory elements. Nature. 2003;423:241–254. doi: 10.1038/nature01644. [DOI] [PubMed] [Google Scholar]
- 20.Cliften P, et al. Finding functional features in Saccharomyces genomes by phylogenetic footprinting. Science. 2003;301:71–76. doi: 10.1126/science.1084337. [DOI] [PubMed] [Google Scholar]
- 21.Robison K, McGuire AM, Church GM. A comprehensive library of DNA-binding site matrices for 55 proteins applied to the complete Escherichia coli K-12 genome. J. Mol. Biol. 1998;284:241–254. doi: 10.1006/jmbi.1998.2160. [DOI] [PubMed] [Google Scholar]
- 22.Tavazoie S, Hughes J, Campbell M, Cho R, Church G. Systematic determination of genetic network architecture. Nat. Genet. 1999;22:281–285. doi: 10.1038/10343. [DOI] [PubMed] [Google Scholar]
- 23.Drees BL, et al. A protein interaction map for cell polarity development. J. Cell. Biol. 2001;154:549–571. doi: 10.1083/jcb.200104057. [DOI] [PMC free article] [PubMed] [Google Scholar]
- 24.Beer MA, Tavazoie S. Predicting gene expression from sequence. Cell. 2004;117:185–198. doi: 10.1016/s0092-8674(04)00304-6. [DOI] [PubMed] [Google Scholar]
- 25.Tsujimoto Y, Izawa S, Inoue Y. Cooperative regulation of DOG2, encoding 2-deoxyglucose-6-phosphate phosphatase, by Snf1 kinase and the high-osmolarity glycerolmitogen-activated protein kinase cascade in stress responses of Saccharomyces cerevisiae. J. Bacteriol. 2000;182:5121–5126. doi: 10.1128/jb.182.18.5121-5126.2000. [DOI] [PMC free article] [PubMed] [Google Scholar]
- 26.Zaragoza O, Vincent O, Gancedo JM. Regulatory elements in the FBP1 promoter respond differently to glucose-dependent signals in Saccharomyces cerevisiae. Biochem. J. 2001;359:193–201. doi: 10.1042/0264-6021:3590193. [DOI] [PMC free article] [PubMed] [Google Scholar]
- 27.Griggs DW, Johnston M. Regulated expression of the GAL4 activator gene in yeast provides a sensitive genetic switch for glucose repression. Proc. Natl. Acad. Sci. USA. 1991;88:8597–8601. doi: 10.1073/pnas.88.19.8597. [DOI] [PMC free article] [PubMed] [Google Scholar]
- 28.Grauslund M, Lopes JM, Ronnow B. Expression of GUT1, which encodes glycerol kinase in Saccharomyces cerevisiae, is controlled by the positive regulators Adr1p, Ino2p and Ino4p and the negative regulator Opi1p in a carbon source-dependent fashion. Nucleic Acids Res. 1999;27:4391–4398. doi: 10.1093/nar/27.22.4391. [DOI] [PMC free article] [PubMed] [Google Scholar]
- 29.Ozcan S, Johnston M. Function and regulation of yeast hexose transporters. Microbiol. Mol. Biol. Rev. 1999;63:554–569. doi: 10.1128/mmbr.63.3.554-569.1999. [DOI] [PMC free article] [PubMed] [Google Scholar]
- 30.Bojunga N, Entian KD. Cat8p, the activator of gluconeogenic genes in Saccharomyces cerevisiae, regulates carbon source-dependent expression of NADP-dependent cytosolic isocitrate dehydrogenase (Idp2p) and lactate permease (Jen1p) Mol. Gen. Genet. 1999;262:869–875. doi: 10.1007/s004380051152. [DOI] [PubMed] [Google Scholar]
- 31.Jiang R, Carlson M. The Snf1 protein kinase and its activating subunit, Snf4, interact with distinct domains of the Sip1/Sip2/Gal83 component in the kinase complex. Mol. Cell. Biol. 1997;17:2099–2106. doi: 10.1128/mcb.17.4.2099. [DOI] [PMC free article] [PubMed] [Google Scholar]
- 32.Palecek SP, Parikh AS, Huh JH, Kron SJ. Depression of Saccharomyces cerevisiae invasive growth on non-glucose carbon sources requires the Snf1 kinase. Mol. Microbiol. 2002;45:453–469. doi: 10.1046/j.1365-2958.2002.03024.x. [DOI] [PubMed] [Google Scholar]
- 33.Rae FK, et al. Analysis of complementary expression profiles following WT1 induction versus repression reveals the cholesterol/fatty acid synthetic pathways as a possible major target of WT1. Oncogene. 2004;23:3067–3079. doi: 10.1038/sj.onc.1207360. [DOI] [PubMed] [Google Scholar]
- 34.Harbison CT, et al. Transcriptional regulatory code of a eukaryotic genome. Nature. 2004;431:99–104. doi: 10.1038/nature02800. [DOI] [PMC free article] [PubMed] [Google Scholar]
- 35.Hartemink A, Gifford D, Jaakkola T, Young R. Combining location and expression data for principled discovery of genetic regulatory network models. Pac. Symp. Biocomput. 2002:437–449. [PubMed] [Google Scholar]
- 36.Doi N, et al. Novel fluorescence labeling and high-throughput assay technologies for in vitro analysis of protein interactions. Genome Res. 2002;12:487–492. doi: 10.1101/gr.218802. [DOI] [PMC free article] [PubMed] [Google Scholar]
- 37.Man TK, Stormo GD. Non-independence of Mnt repressor-operator interaction determined by a new quantitative multiple fluorescence relative affinity (QuMFRA) assay. Nucleic Acids Res. 2001;29:2471–2478. doi: 10.1093/nar/29.12.2471. [DOI] [PMC free article] [PubMed] [Google Scholar]
- 38.Bulyk M, Johnson P, Church G. Nucleotides of transcription factor binding sites exert interdependent effects on the binding affinities of transcription factors. Nucleic Acids Res. 2002;30:1255–1261. doi: 10.1093/nar/30.5.1255. [DOI] [PMC free article] [PubMed] [Google Scholar]
- 39.Udalova I, Mott R, Field D, Kwiatkowski D. Quantitative prediction of NF-kappa B DNA-protein interactions. Proc. Natl. Acad. Sci. USA. 2002;99:8167–8172. doi: 10.1073/pnas.102674699. [DOI] [PMC free article] [PubMed] [Google Scholar]
- 40.Desjarlais JR, Berg JM. Toward rules relating zinc finger protein sequences and DNA binding site preferences. Proc. Natl. Acad. Sci. USA. 1992;89:7345–7349. doi: 10.1073/pnas.89.16.7345. [DOI] [PMC free article] [PubMed] [Google Scholar]
- 41.Philippakis A, He F, Bulyk M. ModuleFinder: a tool for computational discovery of cis regulatory modules. Pac. Symp. Biocomput. 2005 in press. [PMC free article] [PubMed] [Google Scholar]
- 42.Zhu H, et al. Global analysis of protein activities using proteome chips. Science. 2001;26:2101–2105. doi: 10.1126/science.1062191. [DOI] [PubMed] [Google Scholar]
- 43.Dudley A, Aach J, Steffen M, Church G. Measuring absolute expression with microarrays with a calibrated reference sample and an extended signal intensity range. Proc. Natl. Acad. Sci. USA. 2002;99:7554–7559. doi: 10.1073/pnas.112683499. [DOI] [PMC free article] [PubMed] [Google Scholar]
- 44.Cleveland W, Devlin S. Locally weighted regression: An approach to regression analysis by local fitting. J. American Statistical Association. 1988;83:596–610. [Google Scholar]
- 45.Sokal R, Rohlf R. Biometry: The Principles and Practice of Statistics in Biological Research. W. H. Freeman and Company; New York: 1995. [Google Scholar]
- 46.Liu X, Brutlag D, Liu J. An algorithm for finding protein-DNA binding sites with applications to chromatin-immunoprecipitation microarray experiments. Nat. Biotechnol. 2002;20:835–839. doi: 10.1038/nbt717. [DOI] [PubMed] [Google Scholar]
- 47.Robinson M, Grigull J, Mohammad N, Hughes T. FunSpec: a web-based cluster interpreter for yeast. BMC Bioinformatics. 2002;3:35. doi: 10.1186/1471-2105-3-35. [DOI] [PMC free article] [PubMed] [Google Scholar]
- 48.Stuart JM, Segal E, Koller D, Kim SK. A gene-coexpression network for global discovery of conserved genetic modules. Science. 2003;302:249–255. doi: 10.1126/science.1087447. [DOI] [PubMed] [Google Scholar]
- 49.Schneider TD, Stephens RM. Sequence logos: a new way to display consensus sequences. Nucleic Acids Res. 1990;18:6097–6100. doi: 10.1093/nar/18.20.6097. [DOI] [PMC free article] [PubMed] [Google Scholar]
Associated Data
This section collects any data citations, data availability statements, or supplementary materials included in this article.