Abstract
Several dual-mode ultrasound array (DMUA) systems are being investigated for potential use in image-guided surgery. In therapeutic mode, DMUAs generate pulsed or continuous-wave (CW) high-intensity focused ultrasound (HIFU) beams capable of generating localized therapeutic effects within the focal volume. In imaging mode, pulse-echo data can be collected from the DMUA elements to obtain B-mode images or other forms of feedback on the state of the target tissue before, during, and after the application of the therapeutic HIFU beam. Therapeutic and technological constraints give rise to special characteristics of therapeutic arrays. Specifically, DMUAs have concave apertures with low f-number values and are typically coarsely sampled using directive elements. These characteristics necessitate pre- and post-beamforming signal processing of echo data to improve the spatial and contrast resolution and maximize the image uniformity within the imaging field of view (IxFOV). We have recently developed and experimentally validated beamforming algorithms for concave large-aperture DMUAs with directive elements. Experimental validation was performed using a 1 MHz, 64-element, concave spherical aperture with 100 mm radius of curvature. The aperture was sampled in the lateral direction using elongated elements with center-to-center spacing (λ is the wavelength). This resulted in f-number values of 0.8 and 2 in the azimuth and elevation directions, respectively. In this paper, we present a new DMUA design approach based on different sampling of the shared concave aperture to improve image quality while maintaining therapeutic performance. A pulse-wave (PW) simulation model using a modified version of the Field II program is used in this study. The model is used in generating pulse-echo data for synthetic-aperture (SA) beamforming for forming images of a variety of targets, e.g., wire arrays and speckle-generating cyst phantoms. To provide validation for the simulation model and illustrate the improvements in image quality, we show SA images of similar targets using pulse-echo data acquired experimentally using our existing 64-element prototype. The PW simulation model is used to investigate the effect of transducer bandwidth as well as finer sampling of the concave DMUA aperture on the image quality. The results show that modest increases in the sampling density and transducer bandwidth result in significant improvement in spatial and contrast resolutions in addition to extending the DMUA IxFOV.
I. Introduction
Several image-guided high-intensity focused ultrasound (HIFU) systems have been introduced for minimally invasive treatment of cancer and other tissue abnormalities [1]. Currently, diagnostic ultrasound [2] and magnetic resonance imaging (MRI) [3] are the most commonly used image guidance modalities. Diagnostic ultrasound offers several advantages, including portability, ease of integration, low cost, and real-time operation. MRI's major advantages are its high soft-tissue contrast and high spatial resolution, which often result in excellent target visibility and visualization of treated tissue. MRI is also capable of imaging temperature change, which allows for monitoring the progress (and control) of thermal therapy treatments with HIFU [4]. It should be mentioned that diagnostic ultrasound has also been shown to offer a noninvasive means of imaging temperature change in tissues undergoing thermal treatments [5], [6], but it currently suffers from limitations when imaging high temperature changes [7]. Other imaging modalities have also been suggested for thermometry, e.g., x-ray computed tomography (CT) [8] and electrical impedance tomography [9].
Numerous research groups in the area of image-guided HIFU are considering phased arrays for their respective applications [10]-[16]. Piezocomposite technology is especially appealing for therapeutic phased arrays due to low cross coupling and relatively high efficiency [17]. In addition, piezocomposite transducers have larger bandwidth than their piezoceramic counterparts, which allows for the use of therapeutic arrays in pulse-echo mode [18]. These studies highlight the feasibility of real-time dual-mode operation in the therapeutic application of HIFU, where the pulse-echo capability of the dual-mode ultrasound array (DMUA) is used to achieve one or more of the following:
B-mode imaging of the treatment region before and after lesion formation, where changes in echogenicity could be used as an indicator of lesion formation [18]-[21].
Monitoring of and real-time compensation for the target motion using speckle tracking methods [22].
Monitoring of temperature-related tissue parameters by application of acoustic radiation force method [7], [23].
Image-based refocusing of the DMUA for optimal power deposition at the target while avoiding collateral damage to critical structures in the path of the HIFU beam, e.g., the rib cage when targeting liver tumors [24], [25].
Improving the imaging capabilities of DMUAs to levels comparable with diagnostic guidance systems will allow a unique paradigm in image-guided surgery. The inherent registration between the therapeutic and imaging coordinate systems will allow the physician to define the target point(s) where the power deposition is to be maximized directly on B-mode images produced by the DMUA. In addition, critical points where power deposition is to be minimized can be defined on the same image. An optimal solution can be obtained by employing the pseudoinverse multiple-focus synthesis method with additional constraints [26], [27]. This approach has been validated experimentally in a laboratory setting using a prototype 1-MHz 64-element DMUA [24], [25].
We have investigated several approaches for improving the image quality of a prototype DMUA that was originally optimized for therapeutic performance. Conventional imaging with this prototype was initially performed in sector scan format [28] and later in Cartesian coordinates [19]. B-mode images were formed using conventional synthetic aperture (SA) beamforming and single-transmit focus (STF) imaging [19]. STF images are formed by using the therapeutic beam (at diagnostic intensity levels and with 1 to 2 cycle duration) as the transmit imaging focus. Dynamic receive focusing is used to form a 2-D image throughout the DMUA imaging field of view (IxFOV). In a uniform speckle region, this amounts to imaging the therapeutic beam. This mode is especially advantageous for HIFU-induced lesion visualization as described in [19]. Enhanced visualization of HIFU-induced lesions in STF images was achieved by using harmonic and nonlinear quadratic imaging [29] as well as nonlinear frequency compounding [30].
The therapeutic efficacy of a DMUA at a target location within the treatment volume is measured by the focusing intensity gain [26]. For a given therapeutic array, the therapeutic operating field (ThxOF) of a DMUA is defined as the volume where the focusing intensity gain of the array exceeds a threshold where HIFU beams can produce therapeutic effects [18]. DMUAs have some characteristic geometric features that are dictated by the need for high-intensity focusing gain in the ThxOF and electrical-to-acoustic power conversion efficiency. These characteristics are: 1) nonplanar concave apertures, 2) large directive elements (width >λ), and 3) low f-number (≈ 1 or lower). Therefore, conventional delay-and-sum beamforming with such arrays results in nonuniform IxFOV in a region centered around the geometric focus. This nonuniform IxFOV is closely related to the intensity focusing gain profile, which defines the DMUA's ThxOF. We have shown previously that special considerations of the geometric characteristics of DMUAs lead to significant improvements in the contrast resolution by improving the image uniformity within the IxFOV of a DMUA [31].
In addition to the geometrical characteristics mentioned above, therapeutic arrays typically operate at relatively low frequencies compared with diagnostic imaging array, e.g., 1 to 1.5 MHz is commonly used in abdominal applications [3], [22]. Even with fractional bandwidths in the 30 to 40% range, the resulting axial resolution is poor, in the range of 2 to 3 mm. On the other hand, due to the relatively low f-number, the lateral resolution is typically 1 to 1.5 mm (≈ 1λ). This is the opposite situation to diagnostic arrays with planar or convex geometry and relatively high f-number values where the axial resolution is finer than the lateral resolution. In the case of DMUAs, the resulting point spread function (PSF) is elongated in the axial direction. We have recently proposed the use of coded excitation with pseudoinverse filtering [32] to balance the axial and lateral resolution of our prototype DMUA while preserving the contrast resolution of the imaging system [33].
Our previous work has focused on the use of pre- and post-beamforming algorithms to improve the imaging performance of a DMUA given its geometry and operating bandwidth [18], [24], and [31]. Until recently, these factors were dictated by therapeutic optimization and manufacturing limitations. Advances in piezocomposite transducer technology allow for a choice of materials to meet a variety of power/bandwidth constraints. In addition, fine array lattice definition is now possible with improved manufacturing techniques. These advances open the door for a paradigm shift in the design of DMUAs for optimization of their performance in both imaging and therapy modes. Due to the complexity and high cost of the DMUA geometries in practical applications, the design optimization must be carried out using appropriate simulation tools. We have previously used continuous wave (CW) simulations for the optimization of DMUA for therapeutic performance [34]. However, pulsed wave (PW) simulations are necessary for evaluation of imaging performance in speckle-generating phantoms. Field II simulation program [35] is widely used in the ultrasound imaging community with several diagnostic array geometries supported. We have used a modified version of the program to allow for the simulation of concave large-aperture DMUAs. In this paper, we present experimental and PW simulation results from a 1 MHz, 64-element prototype DMUA that illustrate its imaging capabilities. These results also serve to validate the new PW simulation model of the DMUA, which is used to investigate the imaging performance of a modified design. In particular, we use the PW simulation model to investigate the effect of fractional bandwidth and aperture sampling on the imaging performance of the DMUA. A modified DMUA design with different aperture sampling in imaging and therapy modes is presented. This design is based on fine sampling of a concave aperture with the same dimensions as our current 1 MHz prototype. A uniform sampling grid employing 128 × 8 elements is used to cover the available concave aperture. Using interconnection circuits for element grouping in imaging and therapy modes, the DMUA can be configured as a 64 × 1 array in therapy mode and a 128 × 1 array in imaging mode on the same aperture. The imaging array has finer sampling to reduce grating lobes and higher f-number in the elevation direction to extend the IxFOV. Simulation results from the modified DMUA design are also provided to illustrate the improvements in imaging performance.
II. Materials and Methods
A. Dual-Mode Ultrasound Array Prototype
1. Array Description
We have designed a 64-element, 1-MHz, linear concave array (on a spherical shell with 100 mm radius) for HIFU applications. The array has a fairly low f-number of 0.8 to maximize the array focusing gain in the intended ThxOF as described in [18]. To minimize the channel count and maintain high driving efficiency, we have sampled the aperture using 1.5 × 50 mm2 elements with center-to-center spacing of 2 mm as shown in Fig. 1. Clearly, this spacing in the lateral direction results in grating lobes. However, computer simulations were used to establish that these grating lobes were kept at least −25 dB below the focus for every focal point within the ThxOF. For this particular prototype, the ThxOF was specified as a circular disk 3 cm in diameter and centered at the geometric center. Simulation results of the focusing intensity gain profile for this prototype have shown that the ThxOF extends from 80 to 120 mm axially and ±20 mm laterally [18]. The focusing intensity gain within this region was in the range of 700 to 1150 with the maximum intensity gain achieved at the geometric focus. With ≈5 W/cm2 available at its surface, the prototype is capable of producing focal intensities from 3500 to 5750 W/cm2 within its ThxOF.
Fig. 1.
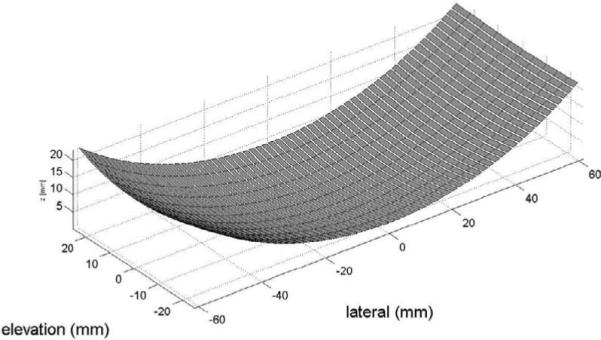
Dual-mode ultrasound array geometry. The array elements are shown segmented in the elevation direction. This segmentation is for simulation purposes only.
The array was fabricated using HI-1 piezocomposite technology (Imasonic, Besançon, France) [17] and was shown to produce up to 250 W with efficiency ≈ 60%. In therapeutic mode, the DMUA was shown to have a 37% bandwidth around the center frequency of 1.1 MHz [18]. In pulse-echo mode without matching, the DMUA has 2 predominant resonance frequencies, at 1.1 and 2.1 MHz. These characteristics are consistent with an earlier prototype that was described in [28].
2. Data Collection
Array elements were connected to a transmitter and a receiver through a 4 × 64 matrix switch (Tektronix VX4380, Tektronix, Inc., Beaverton, OR). For conventional pulse-echo experiments, a pulser/receiver (GE Panametrics 5800, Waltham, MA) was connected to the transmit and receive terminals on the matrix switch with the receiver connected to a 20 Msample/s 23-bit digitizer (HP E1437A, Agilent, Palo Alto, CA). Coded excitation experiments were performed by connecting an arbitrary waveform generator (Agilent AG33250A) and a power amplifier (A150, ENI, Rome) to the transmit terminal on the matrix switch.
B. Simulation Models and DMUA Design
Both CW and PW simulation models were developed for the DMUA. The CW simulation model was used for beam synthesis and field computation as described in [26]. The CW simulation model was used in determining the DMUA design parameters based on the following considerations:
The aperture size, degree of geometric focusing, and operating therapeutic frequency are determined by target depth, available acoustical window, and the required focusing gain to achieve a desired therapeutic endpoint at the target [18].
The aperture sampling (element size and spacing) is determined by the size of the ThxOF and the maximum acceptable grating lobe levels to avoid therapeutic heating outside the target volume. The element size (directivity) must be chosen such that the drop in intensity gain at the focus is within a specified level (e.g., 1 to 2 dB) throughout the ThxOF. Element size may also be determined by the type of amplifier used in driving the element and electrical-to-acoustic power conversion efficiency.
The availability of ≈40% fractional bandwidth for our DMUA prototype encouraged us to develop a PW simulation model for analyzing its imaging performance. The PW model was based on the Field II simulation package [35], [36], which is widely used in the ultrasound imaging community, and it provided us with valuable tools for simulating speckle-generating targets. Due to the concave nature of our DMUA, we had to modify the program to support the concave array structure shown in Fig. 1. Note that the slicing for each element in the elevation direction is only for simulation purposes. This is due to the fact that Field II simulates curved elements by discretizing their surfaces using linear, mathematical elements. We have experimentally sampled the actual impulse response and the excitation for use in the Field II simulations.
C. Pulse-echo Imaging
1. Synthetic Aperture Imaging
We use synthetic aperture imaging technique [37] to obtain images with 2-way (transmit-and-receive) dynamic focusing. This provides the highest quality image possible with the current prototype using conventional delay-and-sum beamforming. In this mode, the RF data from an image pixel at P (xp,zp) in a medium with uniform speed of sound, c, is computed by
| (1) |
where Ai and Bi are, respectively, the transmit and receive apodization weights, Rip and Rjp are, respectively, the distances from the transmitting and receiving elements to the image pixel P, and si,j(t) is the echo received by element j when transmitting with element i. Other imaging scenarios can be easily performed by specializing the image formation (1).
The waveforms, si,j(t), are either collected experimentally using the system described in Section II-A,2 or generated using the modified Field II with the DMUA geometry described in Section II-A. In both cases, a sampling frequency of 10 MHz was used. We note here that the use of the matrix switch did not allow for collecting echo data at element i when that same element was used as a transmitter. This was accounted for in the beamforming program with both experimental and simulation data. It had minimal effect on the quality of the reconstructed images.
2. Element Directivity
DMUA elements are 1-λ wide, which may be too directive, especially for near-field pixels. The element directivity weighting function is given as follows [12]:
| (2) |
where, k = 2π/λ, d is the element width and θ is the angle between the vector from the element to the focusing pixel P and the vector from the element to the geometric focus. The 6 dB width of this function is ±25°. At 100 mm range, the width of the directivity pattern is ±46.6 mm. After considering transmit and receive element directivities D(θi) and D(θj), respectively, the beamforming (1) becomes
| (3) |
3. Gain Compensation
The concave nature of the DMUA is dictated by therapeutic design considerations. The aperture size and radius of curvature together with the element size and spacing define the DMUA's ThxOF. The ThxOF defines a region around the geometric focus where the focusing gain of the array provides therapeutic levels suitable for HIFU application. Outside the ThxOF, the focusing gain is significantly lower [24]. Incidentally, the intensity focusing gain is the same as the 2-way array gain in synthetic aperture imaging mode described above. This means that the IxFOV is associated with the ThxOF. The IxFOV can be extended by performing gain compensation after beamforming. The field strength at a given pixel should be compensated as follows:
| (4) |
where G(xp,zp) is the square root of the intensity gain.
D. Coded Excitation and Receive Filter Design
With the pulse-echo imaging techniques introduced above, the spatial resolution is 2.6 mm in the axial direction and 1.1 mm in the lateral direction. These values are consistent with the bandwidth, center frequency, and geometry of the DMUA prototype. We propose to use a coded excitation approach to improve the axial resolution so that the speckle size is more uniform in axial and lateral directions.
Coded excitation is typically used for improving the SNR and, consequently, penetration depth in ultrasound imaging. Typically, a matched filter is used to compress the received echo. The matched filter achieves the highest SNR at the peak of the compressed pulse. The SNR improvement is proportional to the time-bandwidth product of the coded signal [38]. However, the matched filter does not enhance axial resolution in compression. Shen and Ebbini [32] have proposed the pseudoinverse filter for coded excitation to improve the axial (and lateral) resolution while maintaining reasonable SNR levels. In this paper, we apply the pseudoinverse filter design for controlled improvement of axial resolution for the 1-MHz DMUA prototype described above.
1. Pseudoinverse Filter Design
We transmit a linear chirp signal c(t) covering the frequency band of 0.5 to 1.5 MHz as illustrated in Fig. 2(a). The frequency response of the matched filter M(f) is C*(f), the complex conjugate of the Fourier transform of c(t). The frequency response of the pseudoinverse filter, P (f), is defined as
| (5) |
where Sn(f) = |C(f)|2 is the spectral density of the signal, Sn(f) is the spectral density of the noise, and β is a regularization parameter for the noise term. For illustration purposes, an additive white Gaussian noise (AWGN) model is assumed. As shown in Fig. (2b) to (2d), the frequency response of the pseudoinverse filter changes with the value of β. Specifically, when we set the regularization parameter β = 0, the filter behaves as an inverse filter, 1/C(f), with widest bandwidth and highest noise floor. It is obvious that the pulse width in the time domain is inversely proportional to the bandwidth. Therefore, theoretically, the inverse filter obtains the highest axial resolution but with the lowest SNR. On the other extreme, when the regularization parameter β is large enough so that βSn(f) dominates the denominator, the filter behaves as a matched filter as shown in Fig. 2(d). This solution maximizes the SNR, but may reduce the axial resolution (due to the reduced overall bandwidth of the system-matched filter cascade). The use of the pseudoinverse filter allows us to shape the spectrum of the compressed received signal by regularized inversion of the system frequency response at frequencies where the SNR is sufficiently high. The appropriate value of β can be determined from the SNR of the system as a function of the frequency. The objective is to achieve the highest axial resolution level (as close as possible to the lateral resolution) at an acceptable level of SNR.
Fig. 2.
Illustration of the pseudoinverse compression filter frequency response designed for a Gaussian chirp transmit waveform. The effect of the regularization parameter, β, on the frequency response of the PIO is also shown.
E. Imaging Targets
A variety of imaging targets are used to illustrate the imaging performance of the DMUA:
Wire Target Array
was used to illustrate the spatial resolution of the DMUA as well as illustrating the extent of the IxFOV. It was also used to demonstrate the beamforming accuracy throughout the imaging field. We used 230 μm thermocouple wires tightened on a Plexiglas frame that could be attached on the DMUA holder so that the wires are placed from −50 mm to 50 mm along lateral direction and 40 mm to 150 mm along axial direction (as shown in Fig. 3). The center of the wire target array was positioned at the geometric focus of the DMUA. The spacing between each pair of wires is 10 mm.
Fig. 3.
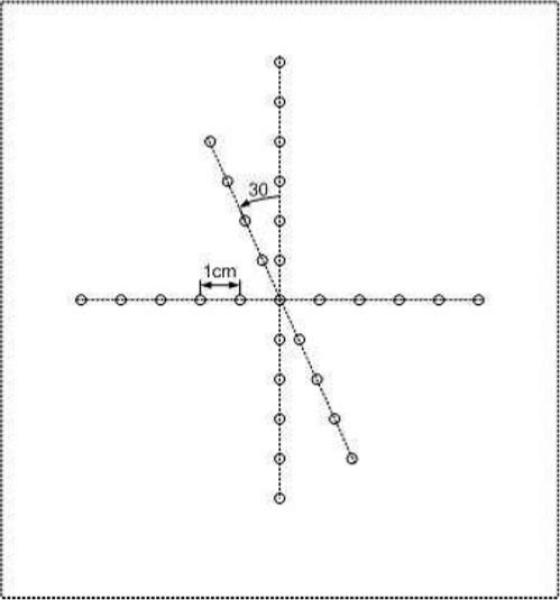
Geometry of the wire target array phantom. The center wire was positioned at the geometric focus of the DMUA.
CIRS Model 55 3D Contrast Phantom
(CIRS Inc., Norfolk, VA) [39] was used to illustrate the enhanced contrast resulting from accounting for element directivity and gain compensation in a challenging 3-D egg-shaped contrast target used for evaluating diagnostic scanners. It was also used to assess the loss in contrast resulting from the use of pseudoinverse post-beamforming filtering with coded excitation.
Cyst Simulation Phantoms
were used to assess improvements in contrast resulting from the simulated increase in the bandwidth and/or in the spatial sampling of the DMUA. All the cysts used in this paper are 12 mmin diameter with no scatterers within the cyst. The surrounding tissue is simulated assuming a scatterer density of > 12 scatterers per resolution cell, i.e., Rayleigh scattering. The size of the speckle-generating region surrounding the cyst(s) was sufficiently large enough to produce the clutter components from all significant sidelobes of the imaging beams. For example, for a 12-mm cyst centered at the geometric center of the DMUA, the extent of the speckle-generating phantom was 50 mm and 140 mm in the axial and lateral directions, respectively. Due to the high computational cost, the cysts simulated in this paper are 2-D. This was deemed to be sufficient for the preliminary results presented in this paper for a 1-D DMUA. Future 1.5-D and 2-D DMUAs will be tested using more realistic 3-D cyst targets.
F. Assessment of Imaging Performance
1. Spatial Resolution
For wire target images, the 6-dB width and length of the envelope were used to measure the lateral and axial resolution, respectively. For quality assurance and scatterer phantoms, we used the speckle correlation cell size as described in [40]. Uniform speckle regions from the test object area were identified to compute the average speckle correlation cell size in the axial and lateral directions as follows:
| (6) |
where Scx and Scz are, respectively, the lateral and axial cell size values and CI(x, z) is the 2-D intensity autocovariance function. The integration limits X and Z are chosen to be large enough to allow the magnitude of the autocovariance to drop to negligible levels. The integrals are evaluated numerically in Cartesian coordinates using the trapezoidal rule to obtain the speckle cell size in the axial and lateral directions.
2. Contrast
The contrast ratio (CR) is defined as follows:
| (7) |
where and are the average intensities in the region of interest (e.g., cyst) and a reference region, respectively.
III. Results
A. Wire Target Array Imaging
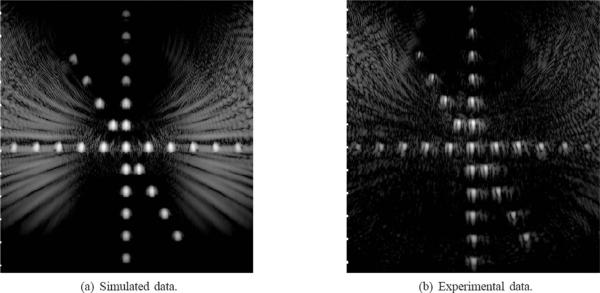
SA image data from the wire target array shown in Fig. 3 was collected experimentally using the setup described in Section II-A. The same array geometry was simulated using Field II to obtain the equivalent SA wave-forms. Fig. 4(a) shows the 50-dB grayscale image of simulation data, and Fig. 4(b) also shows the image of experimental data formed by (1). Both images show the wire targets correctly registered with maximum intensity at the DMUA geometric center and reduced intensity from targets away from the center in all directions. The extent of the axial PSFs is similar in both images throughout the imaging field. The lateral PSF in the experimentally acquired image data shows higher sidelobes due to heterogeneous element gains that were not corrected for. In addition, one can see the cumulative grating lobe patterns due to the multiple wire targets. These grating lobe patterns, together with the reduction in target intensity away from the geometric center, demonstrate the reduced imaging dynamic range outside the IxFOV. The results of this experiment demonstrate that the DMUA has an IxFOV that extends by ≈ ±20 mm from the geometric center in the lateral direction. In the axial direction, the IxFOV appears to extend by more than ±30 mm from the geometric center. They also provide a partial validation of the simulation model, which will be used in the analysis and design of new DMUA geometries.
Fig. 4.
Grayscale images (50 dB) of the wire target array phantom using SA pulse-echo data.
B. Special Considerations
The results shown in Fig. 4(a) and 4(b) are based on (1) without accounting for element directivity or array gain. We have shown experimentally [31] that accounting for these effects improves the contrast resolution by extending the imaging dynamic range by reducing the grating lobes (element directivity) and improving the uniformity of the target intensity within the IxFOV (array gain compensation). These special considerations are illustrated based on simulated SA waveforms to avoid repetition.
1. Element Directivity
Using (3) in beamforming the simulated SA waveforms for the wire target array produces the 50-dB image shown in Fig. 5. One can see clearly the reduction in cumulative grating lobes compared with the SA imaging without accounting for element directivity. More importantly, accounting for element directivity in beamforming improves the signal to noise ratio of the beamformed data by suppressing signal components from directions where the element directivity is very low. This effectively reduces the noise contribution to element data before beamforming. This process can be understood as a pre-beamforming spatial matched filtering operation.
Fig. 5.
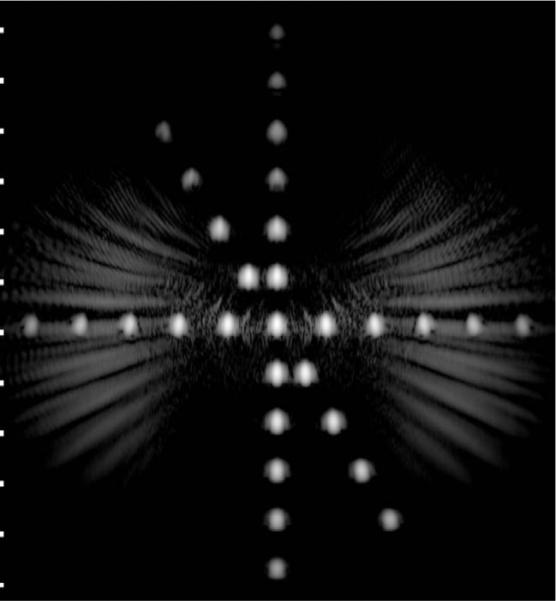
Grayscale image (50 dB) of the wire target array shown in Fig. 3 using (3) with simulated SA pulse-echo data.
2. Gain Compensation
The need for gain compensation can be appreciated by examining the images resulting from the wire target array shown above. The intensity levels of the wire targets drop gradually away from the geometric center, both axially and laterally. This is due to the DMUA's high focusing gain near the geometric center, which could be predicted by CW simulations. In this paper, however, we simulated a uniform phantom (−33.4 mm to 33.4 mm in lateral direction and 70.2 mm to 178.8 mm in the axial direction) to illustrate the effect of gain compensation. As shown in Fig. 6(a), the image appears brighter around the geometric center and darker in the prefocal/postfocal regions and on the sides. Applying gain compensation by using (4), the image shown in Fig. 6(b) appears much more uniform. This result can be quantified by computing the contrast ratio between intensity levels from selected regions just outside IxFOV and the geometric center. With reference to (7), is the average intensity in a region inside of a square region centered at the geometric center and the average intensity in the same size region centered as specified in Table I (center position coordinates in millimeters). One can see that image uniformity is improved within and outside the IxFOV. This is important for properly imaging extended contrast targets as shown in Fig. 6. We have also collected SA pulse-echo data with the CIRS Model 55 3D quality assurance phantom used as an imaging object. The phantom was positioned so that the top portion of the large egg-shaped contrast object was in the DMUA's IxFOV. The data collection was performed with both the DMUA and the phantom submerged in water with 60 mm spacing between the front surface of the phantom and the apex of the array. SA beamforming was performed on the collected data and the resulting grayscale images (50 dB) are shown in Fig. 6 without and with gain compensation. To quantify the effect of gain compensation, we computed the CR value for an elliptic region (with major and minor axes of 80 mm and 30 mm in the axial and lateral directions). The ellipse was centered at (32, 0, 152) mm outside of the egg-shaped contrast object with reference to a region with the same size and shape inside of the object. A negative contrast of −1.4 dB was measured without gain compensation. The corresponding value after gain compensation was 7.6 dB.
Fig. 6.
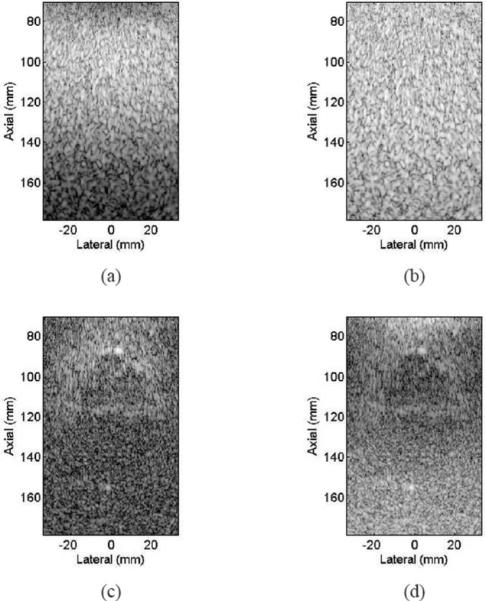
Grayscale images (50 dB) of a simulated uniform scatterer phantom and the CIRS Model 55 3-D quality assurance phantom using experimentally collected SA pulse-echo data.
TABLE I.
CR Values for Selected Regions.
| Pre-focal (0,52.2) | Post-focal (0,152.2) | Left (−32.2,100) | Right (32.2,100) | |
|---|---|---|---|---|
| Without Gain | ||||
| Compensation | 20.3 dB | 18.5 dB | 2.45 dB | 2.74 dB |
| With Gain | ||||
| Compensation | 4.5 dB | 3.6 dB | 0.28 dB | 0.22 dB |
C. Coded Excitation and Receive Filter Design
SA pulse-echo data was collected using a linear chirp transmit pulse covering frequency band of 0.5 to 1.5 MHz with the CIRS Model 55 quality assurance phantom used as an imaging target. The phantom was in the same position described above for the conventional pulse-echo data collection. We used a matched filter and a pseudoinverse filter with a β of 0.1 to compress the received echo after beamforming. A colored noise model was used in (5) to account for reverberation noise below 1 MHz. A value of β = 0.1 was chosen to maximize the bandwidth without amplifying the broadband high-frequency noise components. The frequency response of the pseudoinverse filter is very well behaved as can be seen in Fig. 7. Matched and pseudoinverse filters were (separately) applied to beamformed RF data before envelope detection and log compression. Resulting grayscale images (50 dB) are shown in Fig. 8. One can see that the speckle from the pseudoinverse filter appears shorter along axial direction compared with that from matched filter. We used speckle correlation cell size [40] to quantify the resolution as shown in Table II. One can see that using a pseudoinverse filter improved the axial resolution by 30% compared with the result from the matched filter. Significantly, because the achieved axial resolution is closer to the lateral resolution, the image obtained using the pseudoinverse filter appears more uniform. The contrast ratio for the contrast target was 7.6 dB for pulse-echo, 7.8 dB for matched filter, and 6.6 dB for pseudoinverse filter. This shows that significant improvement in axial resolution was achieved at the cost of 1.2 dB loss in contrast for this object.
Fig. 7.
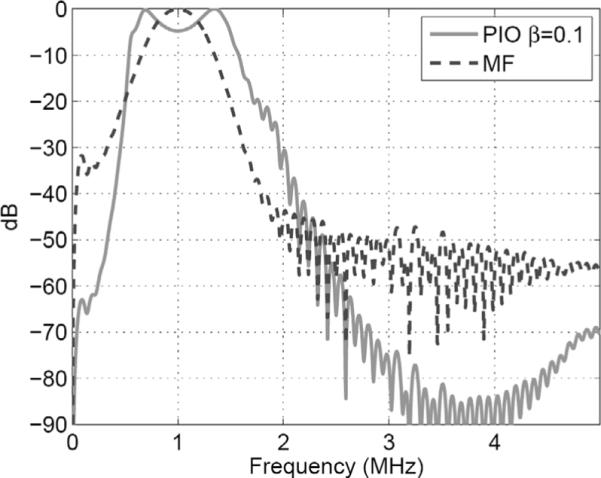
Frequency response of designed pseudoinverse filter.
Fig. 8.

Grayscale images (50 dB) of the CIRS Model 55 quality assurance phantom using experimentally collected SA pulse-echo data. A chirp transmit pulse was used together with (a) a matched filter and (b) a PIO filter.
TABLE II.
Egg Phantom Speckle Correlation Cell Size.
| Calculated | Pulse-echo | MF | PIO | |
|---|---|---|---|---|
| Axial | 2.8 mm | 2.77 mm | 2.5 mm | 1.65 mm |
| Lateral | 1.1 mm | 1.06 mm | 1.28 mm | 1.06 mm |
D. DMUA Design Parameters and Imaging Performance: A Simulation Study
Given the recent advances in transducer technologies [17], [41], some of the design parameters of our DMUA could be modified to improve the imaging performance without compromising the therapeutic performance. The simulation model allows us to investigate the effect of various DMUA design parameters on both spatial and contrast resolution. The results of this investigation are given in the following subsections.
1. Transducer Bandwidth
Increasing the operating fractional bandwidth (FBW) of the DMUA can be expected to bring about improvement in its imaging performance (as with any array system). In this section, we investigate the effect of bandwidth on the PSF and contrast ratio in imaging a variety of cyst phantoms. The modified Field II PW simulation model was used. A Gaussian impulse response model was assumed for the array elements with a center frequency of 1 MHz. The bandwidth was varied from 40% to 90% in 10% increments.
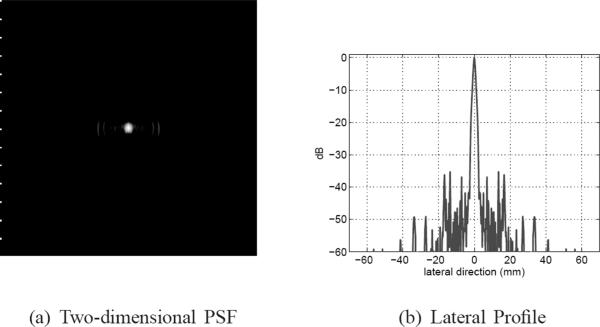
In simulation, we used an impulse excitation and a Kaiser window (with a window parameter value of 5) for the aperture apodization. Figs. 9(a), (b) and (c) show 50-dB images of the PSF in a 50 × 140 mm2 region centered at the geometric center for bandwidth values of 40%, 60%, and 80%, respectively. Fig. 9(d) shows a lateral profile of the PSF for the 40% case, which shows a pattern of near-end and far-end grating lobes due to the concave geometry of the DMUA [26]. The near-end grating lobes would have formed farther out for a planar array with the same f-number and element-to-element spacing. Both axial and lateral dimensions of the PSF are reduced with increased bandwidth indicating improved resolution. In addition, sidelobe levels are also reduced with increased bandwidth indicating improved dynamic range. These results are further quantified in Fig. 10. As expected, improvement in axial resolution is directly proportional to 1/FBW while the improvement in lateral resolution is much less dramatic. This can be explained by the shortening of the imaging pulse duration at increased bandwidth values, which directly affects the axial response at the geometric center. On the other hand, the spatial impulse response of this large-aperture array spreads quickly outside the geometric center. Therefore, the improved bandwidth indirectly improves the array impulse response outside the geometric center. The improved bandwidth reduces constructive interference at the sidelobes (grating lobes) and results in the reduction in their levels as shown in Fig. 10.
Fig. 9.
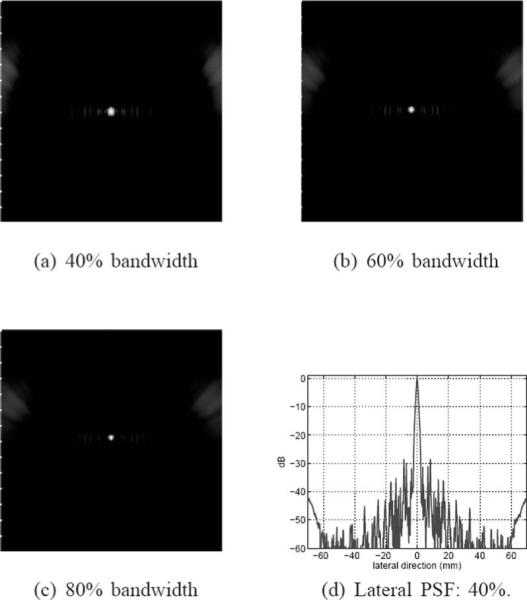
Grayscale images (50 dB) of the PSF with 40%, 60%, and 80% bandwidths, (a) to (c), respectively. A lateral profile of the 40% PSF is shown in (d) to demonstrate the sidelobe structure.
Fig. 10.
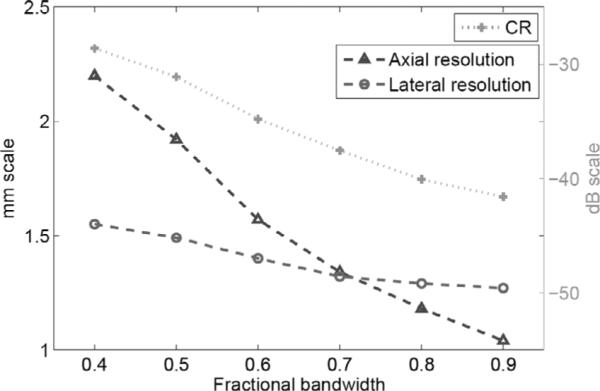
Axial and lateral resolutions and lateral sidelobe level vs. bandwidth for the 1 MHz DMUA.
To further illustrate the effect of increased bandwidth on image quality, we formed images from simulated SA data from a phantom (40 mm in axial direction and 140 mm in lateral direction) with statistically random-distributed scatterers and a 12-mm-diameter cyst. The noise level inside the cyst visually illustrates the effect of the clutter, and the size of the cyst gives a measure related to the resolution. In these simulations, we used uniform apodization in (1) without gain compensation. Fig. 11 shows 50-dB images of a 40 × 140 mm2 region centered at the geometric focus. One can clearly see the improvement in geometric representation of the cyst with increased resolution as well as the reduction in clutter inside the cyst. In addition, the improvement in speckle cell size can also be visually appreciated. Fig. 12 gives a more quantitative view of the improvement in image quality by plotting the log-compressed envelop data along an axial line going through the center of the cyst for different bandwidth levels. The figure shows clearly the improvement in cyst boundary definition and reduction of clutter with increased bandwidth. The cyst diameter was measured at −33 dB to be 8.0, 9.3, and 9.8 mm for 40%, 60%, and 80% bandwidth values, respectively. The contrast ratio was also evaluated to 21.2, 23.0, and 23.7 dB for 40%, 60%, and 80% bandwidth values, respectively. We have also performed cyst phantom images for a variety of cyst locations. Example (50 dB) images are shown in Fig. 13 and Fig. 14. The measured cyst diameters and CR values for the various cyst locations are summarized in Table III and Table IV, respectively.
Fig. 11.
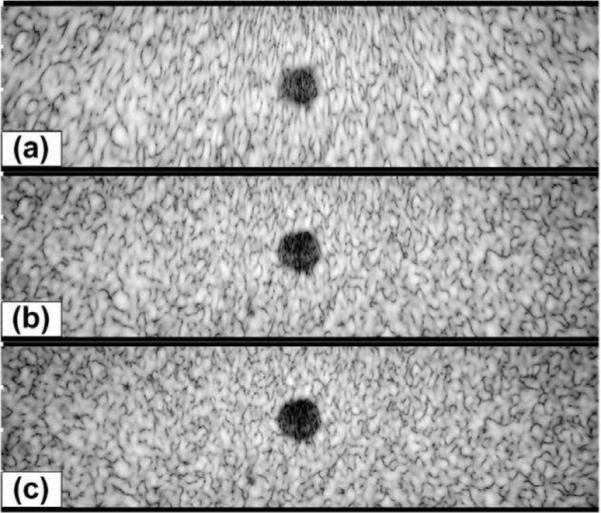
Grayscale images (50 dB) of a simulated phantom with a cyst at (0, 0, 100) mm with radius = 6 mm; (a) 40% bandwidth; (b) 60% bandwidth; (c) 80% bandwidth.
Fig. 12.
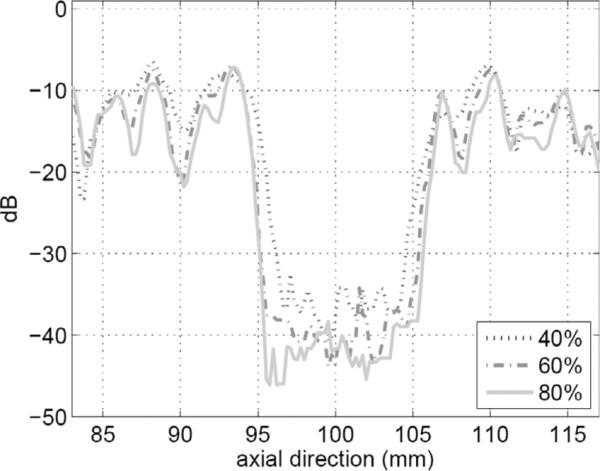
Axial line plots (at x = 0 mm) from the image data shown in Fig. 11(a)–(c).
Fig. 13.
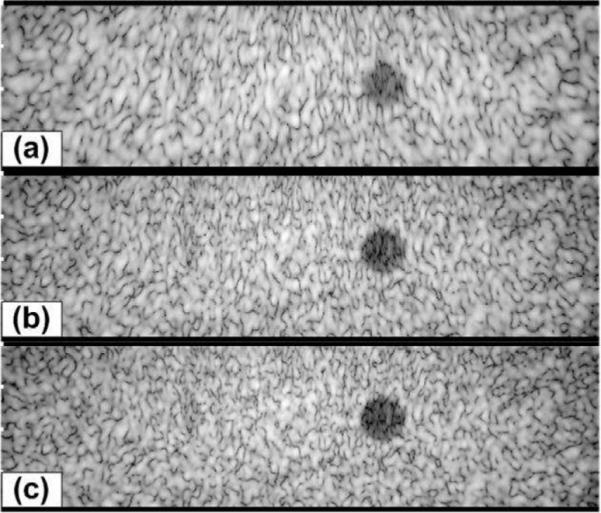
Grayscale images (50 dB) of a simulated phantom with a cyst at (20, 0, 100) mm with radius = 6 mm; (a) 40% bandwidth; (b) 60% bandwidth; (c) 80% bandwidth.
Fig. 14.
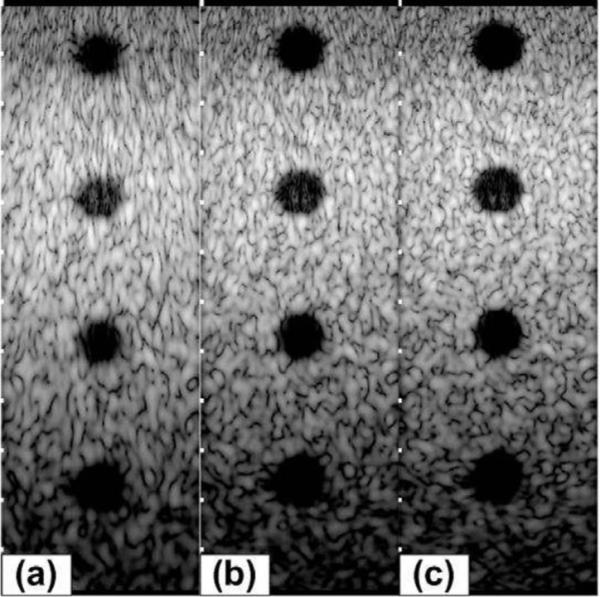
Grayscale images (50 dB) of a simulated phantom with cysts at (0, 0, 70) mm, (0, 0, 100) mm, (0, 0, 130) mm, and (0, 0, 160) mm with radius = 6 mm; (a) 40% bandwidth; (b) 60% bandwidth; (c) 80% bandwidth.
TABLE III.
Cyst Diameter Measurement from Image Data.
| (0, 0, 70) | (0, 0, 100) | (0, 0, 130) | (0, 0, 160) | [20, 0, 100] | |
|---|---|---|---|---|---|
| 40% | 8.4 mm | 8.0 mm | 8.4 mm | 8.9 mm | 7.1 mm |
| 60% | 8.9 mm | 9.3 mm | 9.3 mm | 8.9 mm | 9.3 mm |
| 80% | 9.8 mm | 9.8 mm | 9.8 mm | 8.9 mm | 9.5 mm |
TABLE IV.
CR Values for Cyst Phantom.
| (0, 0, 70) | (0, 0, 100) | (0, 0, 130) | (0, 0, 160) | [20, 0, 100] | |
|---|---|---|---|---|---|
| 40% | 15.7 dB | 21.2 dB | 22.0 dB | 25.2 dB | 17.9 dB |
| 60% | 18.7 dB | 23.0 dB | 23.6 dB | 26.4 dB | 18.9 dB |
| 80% | 20.4 dB | 23.7 dB | 23.6 dB | 25.2 dB | 19.1 dB |
2. Transducer Geometry
a. Lateral sampling
The quality of the beam patterns of the DMUA can be improved by increasing the lateral sampling of the aperture. For the same aperture size, doubling the number of array elements results in element-to-element spacing of (instead of in the current prototype). This is expected to reduce the grating lobes of the array significantly. To quantify this improvement, we simulated the PSF of a 128-element array having the same geometry as the current DMUA, but with double the lateral sampling of the aperture and assuming a 40% bandwidth. The PSF of the 128-element array is shown in Fig. 15 (50 dB). Comparing this result with Fig. 9(a) shows a significant reduction in the near-end grating lobes and a dramatic reduction in the far-end grating lobes. This results in an overall improvement in the imaging dynamic range. Comparing the near-end grating lobes in Fig. 9(d) and Fig. 15(b), one can see a reduction in peak value from −28.6 to −35.4 dB as listed in Table V. The far-end grating lobes are reduced by more than 20 dB.
Fig. 15.
Grayscale image (50 dB) of the PSF of a 128-element, 40% bandwidth DMUA using the same aperture as the current DMUA.
TABLE V.
PSF Characteristics for 64- and 128-Element DMUAs.
| 64-element | 128-element | |
|---|---|---|
| Axial resolution | 2.2 mm | 2.2 mm |
| Lateral resolution | 1.55 mm | 1.56 mm |
| Lateral sidelobe level | −28.6 dB | −35.4 dB |
b. Elevation f-number
The focusing intensity gain of our DMUA is proportional to the product of its lateral and elevation f-number values. The value of f-number = 2 in the elevation direction was chosen for practical purposes related to minimizing the impedance of the transducer elements as seen by the electrical driving circuit. The elevation focus has an obvious effect on the image quality obtained by the DMUA prototype. Specifically, the slice thickness is nearly 2 mm near the geometric center, but it is significantly larger in the prefocal and postfocal regions. A less obvious effect is the elongation of the geometric impulse response, which could affect the array PSF in a manner that may be difficult to predict without the benefit of a good simulation model. The simulation model is an excellent tool to examine this effect on the array PSF and, consequently, on the image quality.
We have simulated the DMUA with the same geometry described in Section III-D,1 with 40% bandwidth, but varied the height of the elements in the elevation direction. We simulated a 64-element array with element height h = 50 mm (corresponding to the current prototype). In addition, we simulated an array with the same geometry but with h = 25, 10, and 5 mm. The results of this simulation are summarized in Table VI, which shows that increasing the elevation f-number from 2 to 4 improves the lateral resolution (with Kaiser window apodization) and reduces the near-end grating lobes. This modest improvement partially validates our earlier design decision to fix the elevation f-number = 2, which was made without the benefit of PW simulation model. However, it also emphasizes the fact that careful modeling will be necessary to optimize the design of more complicated DMUAs. It should be noted that the slice thickness near the geometric center with h = 25 mm will be double that of the current DMUA (about 4 mm), but it will be more uniform throughout the IxFOV with relatively lower lateral sidelobe level as shown in Fig. 16.
TABLE VI.
PSF Characteristics for 64-Element DMUA With Different Elevation Heights.
| 50 mm | 25 mm | 10 mm | 5 mm | |
|---|---|---|---|---|
| Axial resolution | 2.2 mm | 2.27 mm | 2.28 mm | 2.28 mm |
| Lateral resolution | 1.55 mm | 1.22 mm | 1.2 mm | 1.2 mm |
| Lateral sidelobe level | −28.6 dB | −32 dB | −32.2 dB | −32.2 dB |
Fig. 16.
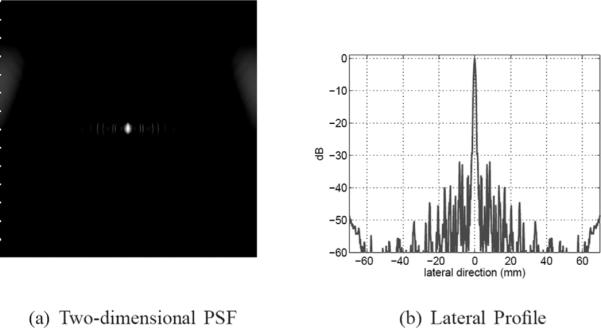
Grayscale image (50 dB) and a lateral profile of the PSF of a 64-element DMUA with element height, h = 25 mm (elevation f-number = 4).
E. Modified DMUA Design for Improved Image Quality
The simulation results shown in Section III-D indicate that a more finely sampled aperture with f-number = 4 in the elevation direction (at the geometric focus) with ≈70% bandwidth offers improved imaging performance compared with the current prototype geometry. For example, a DMUA can be designed with 128 × 4-element lattice by dividing each element in the current design into 2 × 4 subelements as shown in Fig. 17. In therapy mode, a group of 4 × 2 subelements can be connected to form 1 low-impedance element. This grouping results in a 64 × 1 array similar to the current prototype. This subelement grouping scheme may be necessitated by the need to maintain a limited driver channel count and/or manage the impedance of the load for optimum operation. In imaging mode, 2 × 1 subelements (from the 2 center rows of elements in the elevation directions) can be connected to form one imaging element with ≈ λ/2 width in the lateral direction and ≈ 8λ in the elevation direction. This grouping results in a 128 × 1 imaging array. This solution allows for the use of more finely sampled array to reduce grating lobes. In addition, the use of larger f-number in the elevation direction extends the IxFOV of the DMUA by shortening the geometric impulse responses of the array elements. Fig. 18 shows the PSF of the modified DMUA design with impulse excitation and Kaiser window apodization (with Kaiser window parameter = 5). Fig. 19 shows the image of the wire target array using the modified design (without gain compensation). The 50-dB dynamic range images of the PSF and wire-target array show clearly the reduction in grating lobes, increased target visibility away from the geometric center, and improved axial and lateral resolution compared with the existing prototype.
Fig. 17.
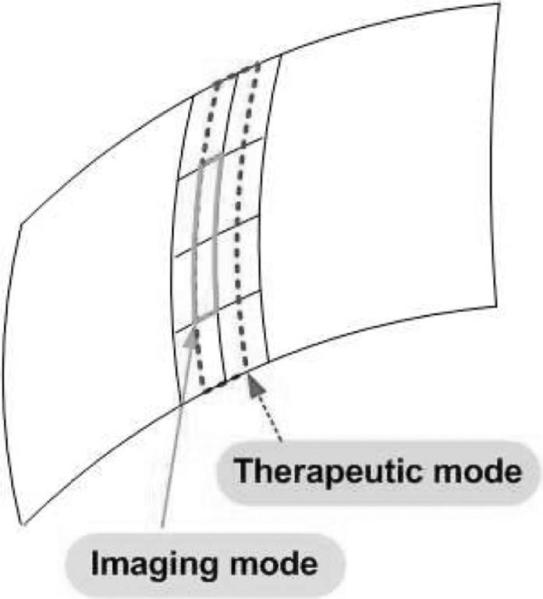
Geometry of a modified DMUA: a 128 × 4-element array that can be configured as 64 × 1 array in therapy mode and 128 × 1 array in imaging mode.
Fig. 18.
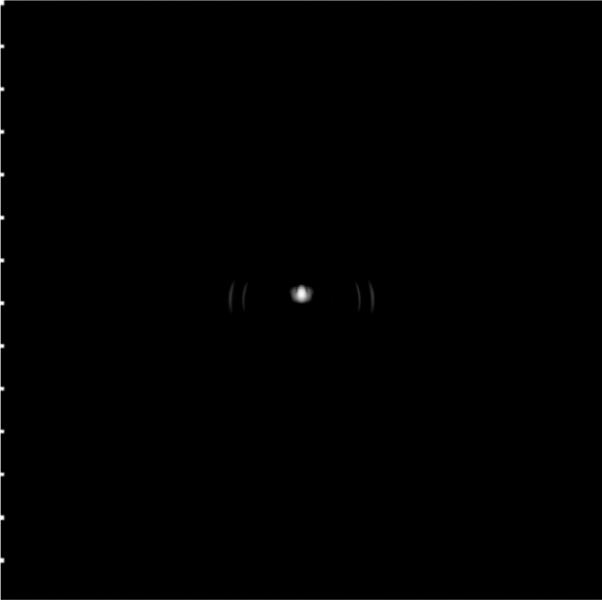
Grayscale image (50 dB) of the point spread function for the modified DMUA design.
Fig. 19.
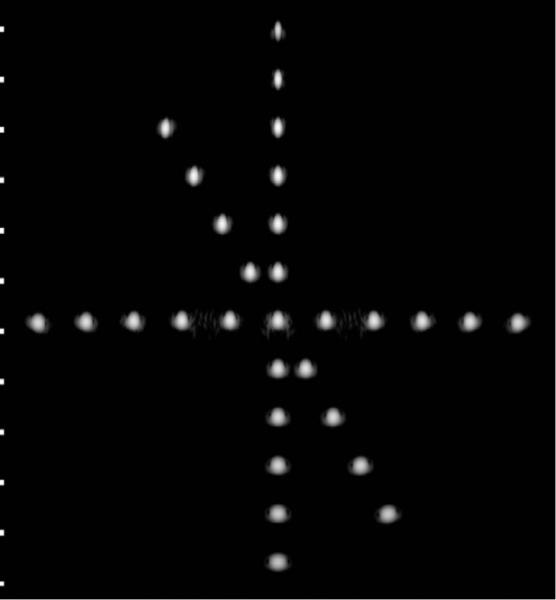
Grayscale image (50 dB) of the wire target array using the modified DMUA design.
IV. Discussion
The experimental and simulation results presented in this paper demonstrate the imaging capabilities of an existing prototype in terms of its PSF, IxFOV, and imaging of contrast targets in speckle-generating media (including 3-D contrast targets from quality assurance phantoms). They also demonstrate the necessity to account for element and array geometries in pre- and post-beamforming signal processing to improve the contrast resolution, extend the IxFOV, and balance the axial and lateral dimensions of the PSF. The latter was achieved by using coded excitation and pseudoinverse filtering.
This paper focused on piezocomposite transducer technology due to the authors’ own experience with this technology and its widespread use in current practice. However, new transducer technologies allowing dual-mode operation are becoming available, e.g., capacitive micro-machined ultrasound transducers (cMUT) proposed by Khuri-Yakub and co-workers [41]. According to [41], the fundamental design tradeoffs and balance between imaging and therapeutic requirements apply to cMUT in much the same way as they apply to piezocomposite. Therefore, the results shown herein are applicable to both technologies.
In the implementation of the pseudoinverse compression filter, we used colored noise model Sn(f) based on the low-frequency interference noise information. This was done to account for a low frequency (500 to 700 kHz) interference resulting from surface waves on the array. This interference could be reduced significantly by imaging in echo-free environment (e.g., water) at the same settings intended for the real imaging target. The echo-free signal components are then subtracted from the target data before or after beamforming. The colored noise model accounts for the residual of this interference pattern in the calculation of Sn(f).
The comparison between simulation and experimental results for the wire target array imaging shows that the PW simulation largely captures the grating lobe structure and predicts the extent of the PSF for the prototype DMUA. The discrepancy is due to interference within the array that could be reduced, but not eliminated (previous paragraph). In addition, the asymmetry in the experimental PSFs at the wire target is due to element heterogeneity (unequal strength) that was not corrected for in these experiments. However, we emphasize that such inhomogeneities can be measured experimentally and can be accounted for in the simulation as was shown in the CW case for a 64-element, 500-kHz cylindrical-section array [26]. Given the general agreement between the simulation and experimental results, we decided not to show the simulation results for the heterogeneous array.
Beyond the basic validation of the PW simulation model, the focus of this paper was on the use of the model in the assessment of the image quality of the existing prototype as well as future DMUA designs. Many of the simulation results shown in this paper have also been confirmed experimentally, but not shown herein to avoid repetition, e.g., the equivalent of Fig. 5 has been shown in [31]. Similarly, comparisons between images obtained using the DMUA and corresponding images obtained using a 3.2 MHz abdominal convex probe on a commercial scanner were shown in [31] for the 3-D egg-shaped target shown in Fig. 8.
The proposed modified DMUA design was based on a finely sampled aperture for high-quality imaging performance. The smaller-sized elements can be grouped to form transmit or receive apertures suitable for optimization of the DMUA for both imaging and therapy. In particular, we proposed a scheme to maintain the directive elements of the DMUA in therapy mode in accordance with the original design. Matching the element directivity of the therapeutic array with the ThxOF has an added benefit related to the safe use of HIFU in the clinic. For example, the element dimensions for the current prototype were chosen to produce therapeutic foci within a 3-cm diameter disc around the geometric center. The intensity gain of this array drops very quickly outside this ThxOF and falls below therapeutic heating due to the element directivity and the array curvature. This provides a fail-safe operation in the sense that, even if the array is focused accidentally outside its intended ThxOF, no irreversible tissue damage can occur due to the loss of focusing gain. In general, the configuration of the transmit/receive arrays in imaging and therapy modes may be dictated by many considerations including transmit/receive amplifiers and switching electronics. The availability of CW and PW simulation models for DMUA allows a more complete cost-benefit analysis for design optimization.
V. Conclusion
The use of dual mode ultrasound phased arrays in image-guided surgery is becoming a reality. This paper presented experimental and simulation results for characterization of the imaging capabilities of a 1 MHz prototype DMUA. Wire target array images obtained by beamforming experimental and simulation data show that the array simulations capture the array geometry and bandwidth characteristics. These images show that the PSF, the Ix-FOV, and the grating lobe structure are well predicted by the simulation model. The simulation model was then used to evaluate the effect of varying DMUA design parameters (FBW and aperture sampling) on the PSF and the contrast ratio of cyst targets positioned at various locations within the IxFOV. Finally, based on this simulation study, we have proposed a modified DMUA design that results in significant enhancement in the imaging performance in terms of spatial and contrast resolution as well as expanded IxFOV. Using simple element interconnection schemes in imaging and therapy modes, the modified DMUA can achieve this enhancement while simultaneously maintaining the therapeutic aperture sampling of the existing DMUA design that has been optimized for therapy. This implies that the improvements in imaging performance of the DMUA will not significantly compromise its predicted therapeutic performance.
Acknowledgment
This work was carried out in part using computing resources at the University of Minnesota Supercomputing Institute. The authors wish to acknowledge Mr. Philip D. VanBaren (Vibration Research), Dr. Claudio Simon (Philips), Dr. Hanwoo Lee (Medison), and Professor M.-K. Jeong (Daejin University) for contributions to various aspects of data collection and image formation algorithms used in generating the images presented in this paper.
Acknowledgments
Funded in part by Grant EB8191 from the National Institutes of Health. Parts of this work were funded by Grant CA66602 from the National Institutes of Health and Grant DAMD 17-01-1-0330, U.S. Army Medical Research and Materiel Command.
Biography
Yayun Wan received her B.S. degree in electrical engineering from Nanchang University, China, in 2000, the M.S. degree in physics from Bowling Green State University, OH, in 2003, and the M.S. degree in electrical engineering from the University of Minnesota–Twin Cities, in 2006. She received the Best Paper Award at the 42nd IEEE Design Automation Conference, June 2005. Now she is working toward her Ph.D. degree in electrical engineering at the University of Minnesota–Twin Cities. Her research interests are in ultrasound imaging and signal processing with special interest in high-frequency ultrasound imaging and image-guided interventions.
 Emad S. Ebbini received his B.Sc. degree in electrical engineering/communications in 1985 from the University of Jordan, and his M.S. and Ph.D. degrees in electrical engineering from the University of Illinois at Urbana-Champaign in 1987 and 1990. From 1990 until 1998, he was on the faculty of the EECS department at the University of Michigan, Ann Arbor. Since 1998, he has been with the ECE department at the University of Minnesota. In 1993, he received the NSF Young Investigator Award for his work on new ultrasound phased arrays for imaging and therapy. He was a member of AdCom for the IEEE Ultrasonics, Ferroelectrics, and Frequency Control between 1994 and 1997. In 1996, he was a guest editor for a special issue on therapeutic ultrasound in the IEEE Transactions on Ultrasonics, Ferroelectrics, and Frequency Control. He was an associate editor for the same transactions from 1997 to 2002. He is a member of the standing technical program committee for the IEEE Ultrasonics Symposium and a member of the Board of the International Society for Therapeutic Ultrasound. His research interests are in signal and array processing with applications to biomedical ultrasonics and medical devices.
References
- 1.Sanghvi N, Hynynen K, Lizzi F. New developments in therapeutic ultrasound. IEEE Eng. Med. Biol. Mag. 1996 Nov.15(6):83–92. [Google Scholar]
- 2.Sanghvi NT, Fry FJ, Bihrle R, Foster RS, Philips MH, Syrus J, Zaitsev AV, Hennige CW. Noninvasive surgery of prostate tissue by high-intensity focused ultrasound. IEEE Trans. Ultrason., Ferroelect., Freq. Contr. 1996 Nov.43(6):1099–1110. [Google Scholar]
- 3.Tempany CM, Stewart EA, McDannold N, Quade BJ, Jolesz FA, Hynynen K. MR imaging-guided focused ultrasound surgery of uterine leiomyomas: A feasibility study. Radiology. 2003 Nov.226:897–905. doi: 10.1148/radiol.2271020395. [DOI] [PubMed] [Google Scholar]
- 4.Poorter J, Wagter C, Deene Y, Thomsen C, Stahlberg F, Achten E. Noninvasive MRI thermometry with the proton resonance frequency (PRF) method: In vivo results in human muscle. Magn. Reson. Med. 1995;33:74–81. doi: 10.1002/mrm.1910330111. [DOI] [PubMed] [Google Scholar]
- 5.Seip R, Ebbini E. Non-invasive estimation of tissue temperature response to heating fields using diagnostic ultrasound. IEEE Trans. Biomed. Eng. 1995 Aug.42:828–839. doi: 10.1109/10.398644. [DOI] [PubMed] [Google Scholar]
- 6.Moreno R, Damianou C, Sanghvi N. Tissue temperature estimation in-vivo with pulse-echo ultrasound. Proc. IEEE Ultrason. Symp. 1995:1225–1229. [Google Scholar]
- 7.Simon C, VanBaren P, Ebbini ES. Combined imaging and therapy with piezocomposite phased arrays. Proc. IEEE Ultrason. Symp. 1998:1555–1558. [Google Scholar]
- 8.Fallone B, Moran P, Podgorsak E. Noninvasive thermometry with a clinical X-ray scanner. Med. Phys. 1982;9:715–721. doi: 10.1118/1.595117. [DOI] [PubMed] [Google Scholar]
- 9.Meaney P, Paulsen K, Hartov A, Crane R. Initial in vivo experience with EIT as a thermal estimator during hyperthermia. Ultrasound Med. Biol. 1996;12:573–591. doi: 10.3109/02656739609027666. [DOI] [PubMed] [Google Scholar]
- 10.Chapelon J, Cathignol D, Cain C, Ebbini E, Kluiwstra J, Sapozhikov O, Fleury G, Berriet R, Cupin L, Guy J. New piezoelectric transducers for therapeutic ultrasound. Ultrasound Med. Biol. 2000;26:153–159. doi: 10.1016/s0301-5629(99)00120-9. [DOI] [PubMed] [Google Scholar]
- 11.Pernot M, Berriet R, Aubry J-F, Baron OL, Tanter M, Fleury G, Chupin L, Gallet L, Fink M. High power density prototype for high precision transcranial therapy. Proc. 3rd Int. Symp. on Therapeutic Ultrasound. 2003:405–410. [Google Scholar]
- 12.Hynynen K, Sun J. Trans-skull ultrasound therapy: The feasibility of using image-derived skull thickness information to correct the phase distortion. IEEE Trans. Ultrason., Ferro-elect., Freq. Contr. 1999 May;46(5):752–755. doi: 10.1109/58.764862. [DOI] [PubMed] [Google Scholar]
- 13.Ishida K, Kubota J, Mitake T, Carlson R, Seip R, Sanghvi N, Azuma KST, Kawabata K, Umemura S. Development and animal experiment of variable focusing HIFU syatem for prostate cancer treatment. Proc. 3rd Int. Symp. on Therapeutic Ultrasound. 2003:382–387. [Google Scholar]
- 14.Seip R, Chen W, Tavakkoli J, Frizzell L, Sanghvi N. High-intensity focused ultrasound (HIFU) phased arrays: Recent developments in transrectal transducers and driving electronics. Proc. 3rd Int. Symp. on Therapeutic Ultrasound. 2003:423–428. [Google Scholar]
- 15.Curiel L, Chavrier F, Souchon R, Birer A, Chapelon JY. 1.5-D high intensity focused ultrasound array for non-invasive prostate cancer surgery. IEEE Trans. Ultrason., Ferroelect., Freq. Contr. 2002 Feb.49(2):231–242. doi: 10.1109/58.985707. [DOI] [PubMed] [Google Scholar]
- 16.Martin R, Vaezy S, Chi E. Investigation of HIFU produced emulsion for acoustic hemostasis. Proc. 3rd Int. Symp. on Therapeutic Ultrasound. 2003:351–356. [Google Scholar]
- 17.Fleury G, Berriet R, Baron OL, Huguenin B. New piezocomposite transducers for therapeutic ultrasound. Proc. 2nd Int. Symp. on Therapeutic Ultrasound. 2002:428–436. [Google Scholar]
- 18.Ebbini ES, Yao H, Shrestha A. Dual-mode ultrasound phased arrays for image-guided surgery. Ultrason. Imag. 2006;28:201–220. doi: 10.1177/016173460602800201. [DOI] [PubMed] [Google Scholar]
- 19.Ebbini ES, Bischof JC, Coad JE. Lesion formation and visualization using dual-mode ultrasound phased arrays. Proc. IEEE Ultrason. Symp. 2001:1351–1354. [Google Scholar]
- 20.Makin I, Mast T, Barthe P, Slayton M. B-scan imaging and thermal lesion monitoring using miniaturized dual-functionality ultrasound arrays. Proc. IEEE Ultrason. Symp. 2004:1788–1791. [Google Scholar]
- 21.Guillaume B, Berriet R, Lafon C, Fleury G, Cathignol D, Chapelon J-Y. Dual mode transducer for ultrasound monitored thermal therapy. Proc. 5th Int. Symp. on Therapeutic Ultrasound. 2005:390–394. [Google Scholar]
- 22.Marquet F, Pernot M, Aubry J, Tanter M, Montaldo G, Fink M. In vivo noninvasive motion tracking and correction in high intensity focused ultrasound. Proc. of the 28th Annual Int. Conference of the IEEE Eng. in Med. and Biol. Soc. 2006;1:688–691. doi: 10.1109/IEMBS.2006.259963. [DOI] [PubMed] [Google Scholar]
- 23.Zaitsev A, Raymond S, Thierman J, Juste J, Hynynen K. Focused ultrasound thermal surgery, imaging, and elastometry using the same phased array: Feasibility study. Proc. IEEE Ultrason. Symp. 2004:2231–2234. [Google Scholar]
- 24.Yao H, Ebbini ES. Dual-mode ultrasound phased arrays for imaging and therapy. Proc. IEEE Int. Symp. on Biomed. Imag. 2004:25–28. [Google Scholar]
- 25.Yao H, Griffin R, Ebbini ES. Noninvasive localized ultrasonic measurement of tissue properties. Proc. IEEE Ultrason. Symp. 2004:724–727. [Google Scholar]
- 26.Ebbini E. Ph.D. dissertation. University of Illinois; 1990. Deep localized hyperthermia with ultrasound phased arrays using the pseudoinverse pattern synthesis method. [Google Scholar]
- 27.Botros Y, Ebbini E, Volakis J. Two-step hybrid virtual array-ray (var) technique for focusing through the rib cage. IEEE Trans. Ultrason., Ferroelect., Freq. Contr. 1998 July;45:989–1000. doi: 10.1109/58.710577. [DOI] [PubMed] [Google Scholar]
- 28.Simon C, Elbakri I, Shen J, Hall T, Ebbini ES. Combined ultrasound image guidance and therapy using a therapeutic phased array. Med. Imag. 1998 May;3341:89–98. [Google Scholar]
- 29.Yao H, Phukpattaranont P, Ebbini ES. Enhanced lesion visualization in image-guided noninvasive surgery with ultrasound phased arrays. Proc. 23rd Annual Int. Conference of the IEEE Eng. in Med. and Biol. Soc. 2001:2492–2495. [Google Scholar]
- 30.Steidl C, Yao H, Ebbini ES. Dual-mode ultrasound phased arrays for noninvasive surgery: post-beamforming image compounding algorithms for enhanced visualization of thermal lesions. Proc. IEEE Int. Symp. on Biomed. Imag. 2002:429–432. [Google Scholar]
- 31.Yao H, Ebbini ES. Imaging with large-aperture arrays with heterogeneous directive elements. Proc. IEEE Ultrason. Symp. 2003:1243–1246. [Google Scholar]
- 32.Shen J, Ebbini ES. Filter-based coded-excitation system for high-speed ultrasonic imaging. IEEE Trans. Med. Imag. 1998 Dec.17(6):923–934. doi: 10.1109/42.746625. [DOI] [PMC free article] [PubMed] [Google Scholar]
- 33.Wan Y, Ebbini ES. Enhanced resolution of dual-mode ultrasound arrays using coded excitation. Proc. IEEE Int. Symp. on Biomed. Imag. 2007:1128–1131. [Google Scholar]
- 34.Otteson B, Ebbini ES. On the design of dual-mode ultrasound arrays for imaging and therapy. Proc. of the 5th Int. Symp. on Therapeutic Ultrasound. 2005:430–434. [Google Scholar]
- 35.Jensen J, Svendsen N. Calculation of pressure fields from arbitrarily shaped, apodized, and excited ultrasound transducer. IEEE Trans. Ultrason., Ferroelect., Freq. Contr. 1992 Mar.39:262–267. doi: 10.1109/58.139123. [DOI] [PubMed] [Google Scholar]
- 36.Jensen JA. “Field II program,”. [Online]. Available: http://www.es.oersted.dtu.dk/staff/jaj/field/
- 37.Thomenius K. Evolution of ultrasound beamformers. Proc. IEEE Ultrason. Symp. 1996:1615–1622. [Google Scholar]
- 38.Chiao RY, Hao X. Coded excitation for diagnostic ultrasound: A system developer's perspective. IEEE Trans. Ultrason., Ferroelect., Freq. Contr. 2005;52(2):160–170. doi: 10.1109/tuffc.2005.1406543. [DOI] [PubMed] [Google Scholar]
- 39.“CIRS model 55 3D contrast phantom,”. [Online]. Available: http://www.cirsinc.com/055 ultra.html.
- 40.Wagner RF, Insana MF, Smith SW. Fundamental correlation lengths of coherent speckle in medical ultrasonic images. IEEE Trans. Ultrason., Ferroelect., Freq. Contr. 1988 Jan.35(1):34–44. doi: 10.1109/58.4145. [DOI] [PMC free article] [PubMed] [Google Scholar]
- 41.Wong SH, Wygant IO, Yeh DT, Zhuang X, Bayram B, Kupnik M, Oralkan O, Ergun AS, Yaralioglu GG, Khuri-Yakub BT. Capacitive micromachined ultrasonic transducer arrays for integrated diagnostic/therapeutic catheters. Proc. of the 5th Int. Symp. on Therapeutic Ultrasound. 2006:395–399. [Google Scholar]


