Abstract
Background
Non-enzymatic glycation of human serum albumin (HSA) is associated with the long-term complications of diabetes. We examined the structure and location of modifications on minimally glycated HSA and considered their possible impact on the binding of drugs to this protein.
Methods
Minimally glycated and normal HSA (used as a control) were digested with trypsin, Glu-C or Lys-C, followed by fractionation of the resulting peptides and their analysis by matrix-assisted laser desorption/ionization mass spectrometry (MALDI-TOF MS) to determine the structures and locations of glycation adducts.
Results
Several specific lysine and arginine residues were identified as modification sites in minimally glycated HSA. Residues K12, K51, K199, K205, K439 and K538 were found to be modified through the formation of fructosyl-lysine, while the modification of K159 and K286 involved the formation of pyrraline, Nε-carboxymethyl-lysine respectively. Lysine K378 was found to give Nε-carboxyethyl-lysine in some forms of glycated HSA but fructosyl-lysine in other forms. Residues R160 and R472 produced a modification based on Nε-(5-hydro-4-imidazolon-2-yl)ornithine. Lysine R222 was modified to produce argpyrimidine, Nε-[5-(2,3,4-trihydroxybutyl)-5-hydro-4-imidazolon-2-yl]ornithine or tetrahydropyrimidine.
Conclusions
With the exception of K12, K199, K378, K439 and K525, all of the observed sites of modification for minimally glycated HSA were new to this current study. The fact that many of these glycation-related modifications are located at or near known drug binding sites on HSA explains why some differences have been previously noted in the binding of certain drugs to normal vs glycated HSA.
Keywords: Non-enzymatic glycation, human serum albumin, diabetes, matrix-assisted laser desorption/ionization mass spectrometry
1. Introduction
Human serum albumin (HSA) is the most abundant protein in serum. This protein has a molecular weight of 66.5 kDa and contains 585 amino acid residues that are arranged in a single polypeptide chain stabilized by 17 internal disulfide bonds [1]. HSA has a variety of functions in the body, including its ability to act as a buffering agent and its role in the control of colloidal osmotic pressure in blood. HSA also sequesters exogenous toxins and plays a role in binding and transporting fatty acids, hormones (e.g., L-thyroxine and steroids) and numerous drugs. HSA contains 2 major binding sites for such solutes. These sites are known as Sudlow sites I and II (i.e., the warfarin-azapropazone and indole-benzodiazepine sites) [2,3] and are located in the IIA and IIIA subdomains of HSA [4].
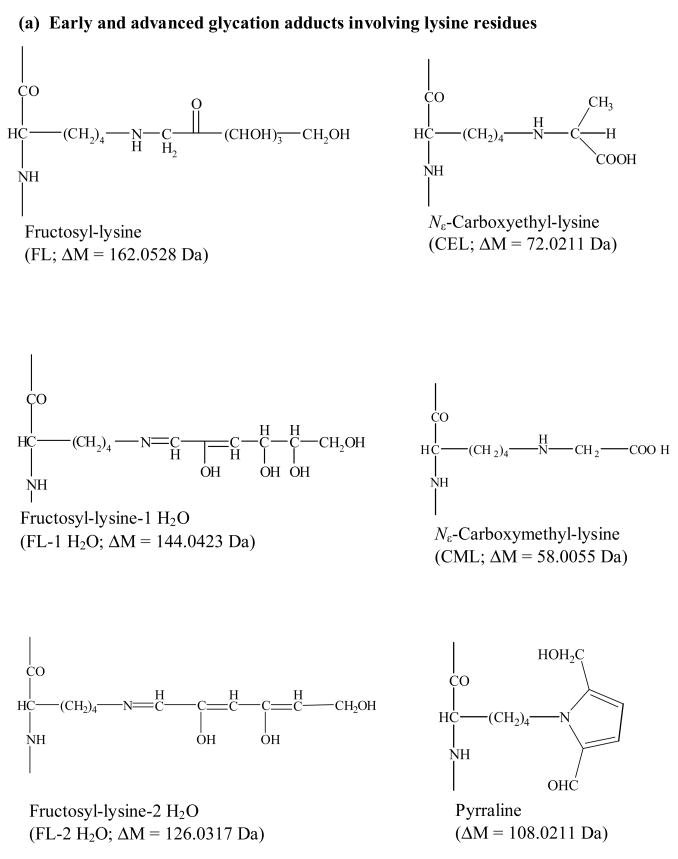
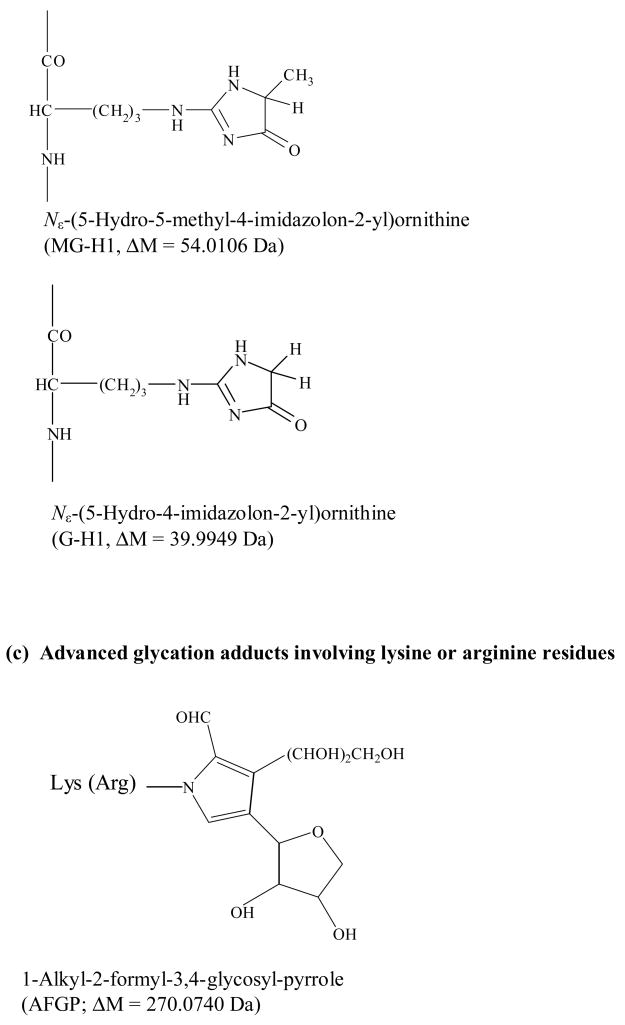
It is known during diabetes that HSA and other proteins in blood (e.g., hemogloblin and transferrin) can have modifications to their structure due to the addition of glucose [5,6]. This process, known as glycation, is a slow non-enzymatic reaction that initially involves the reaction of glucose with free amine groups on HSA to form a reversible Schiff base linkage, giving a glycosylamine residue [6–8]. The first step of this process is reversible; however, the glycosylamine can later undergo an Amadori rearrangement to form a stable fructosamine residue (i.e., an early stage glycation product). Further rearrangement and cleavage of this fructosamine can lead to other modifications, known as advanced glycation end products (AGEs). Figure 1 provides a summary of such products, as identified in previous work with HSA and other glycated proteins [6,9–20].
Figure 1.
Possible early and advanced glycation adducts that involve lysine residues (a), arginine residues (b) or either lysine or arginine residues (c) on a protein.
These modifications are of interest since past studies have suggested that the glycation of HSA can lead to alterations in the binding of this protein to drugs such as phenytoin, salicylate, ibuprofen, phenylbutazone and warfarin [8,21–24]. Furthermore, the effect of glycation appears to vary between different binding regions on HSA [23,24]. Determining the locations and types of modifications that occur on glycated HSA would help give a better understanding of these effects. This study examined such modifications by using in vitro glycated HSA, which has proposed to be a good model for glycated HSA in serum and plasma [18,19]. The extent to which HSA can be glycated in vitro can range from minimal levels (<10 mol modification sites per mol protein) to high levels (30–40 mol modification sites per mol protein) [9,10], with previous studies indicating that minimally glycated HSA is the better model for individuals with well-controlled diabetics [11,17].
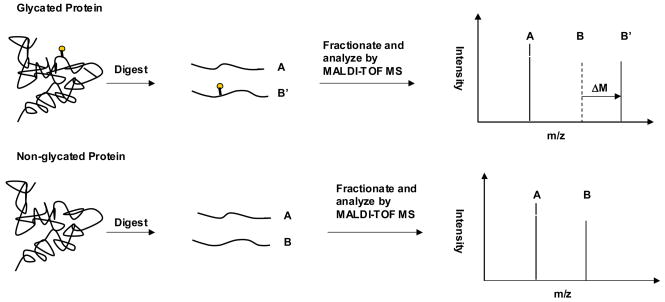
In this study the modifications produced in minimally glycated HSA were examined by using matrix-assisted laser desorption/ionization mass spectrometry (MALDI-TOF MS). This method began by separately digesting glycated HSA and normal HSA with several proteolytic enzymes. The resulting peptides were then fractionated and analyzed by MALDI-TOF MS. Differences in the mass spectra for peptides found in the glycated and normal HSA samples were used to identify regions on HSA that are involved in the formation of early and advanced glycation endproducts (Fig. 2). Using this approach, it was possible to not only determine which sites on minimally glycated HSA were being altered but to also determine which modifications were taking place at these sites. This information was then used to provide clues as to how glycated HSA may differ from normal HSA in its binding to drugs and other small solutes.
Figure 2.
Use of MALDI-TOF MS and peptide mapping to study modification sites on a glycated protein.
2. Materials and Methods
2.1 Materials
The minimally glycated HSA was from Sigma-Aldrich (St. Louis, MO), with the same batch being used throughout this study (~95% protein and 99% pure HSA glycated in vitro, giving an assayed value of 8.0 mol modified sites per mol protein). The trypsin (sequencing grade), endoproteinase Lys-C (Lys-C, sequencing grade), and endoproteinase Glu-C (Glu-C, sequencing grade) were also from Sigma-Aldrich. The guanidine hydrochloride (>99% pure), D/L-dithiothreitol (DTT, >99% pure), iodoacetamide (99% pure) and formic acid (96% pure) were also from Sigma-Aldrich, as well as α-cyano-4-hydroxycinnamic acid (CHCA, >99% pure), 2,5-dihydroxybenzoic acid (DHB, 98% pure), des-Arg-bradykinin (99% pure), angiotensin I (97% pure, acetate salt), and Glu-fibrinopeptide B (97% pure). The Slide-A-Lyzer dialysis cassettes (7 kDa MW cutoff, 0.5–3 ml capacity) were from Pierce (Rockford, IL). All aqueous solutions were prepared using water from a Nanopure water system (Barnstead, Dubuque, IA) and filtered using 0.22 μm nylon filters from Fisher (Pittsburgh, PA).
2.2 Apparatus
Small volume samples and solutions were measured and applied using a 0.5–10 μl digital pipette from Fisher Scientific (Pittsburgh, PA). ZipTipμ-C18 pipette tips (5.0 μg capacity) were from Millipore (Billerica, MA). The overhead transparency film for sample/matrix mixing was from C-line Products (Des Plaines, IL). The MALDI-TOF MS experiments were carried out with a Voyager 6184 system (Applied Biosystems, Foster City CA) operated in a positive-ion delayed extraction reflection mode. The instrument settings for this analysis were as follows: accelerating voltage, 20 kV; grid voltage, 76% of the accelerating voltage; guide wire voltage, 0.008% of the accelerating voltage; delay time, 100 ns.
2.3 Sample Pretreatment & Digestion
The glycated and normal HSA samples were denatured, reduced and alkylated before digestion according to a previous described procedure [25]. First, 3 mg of glycated or non-glycated HSA was denatured by dissolving it in 1 ml of a denaturing solution containing 6 mol/l guanidine hydrochloride in pH 8.5, 100 mmol/l ammonium bicarbonate buffer, followed by shaking of this mixture for 1 min. Next, 15 μl 1.0 mol/l DTT dissolved in pH 8.2, 100 mmol/l ammonium bicarbonate buffer was added to this solution. The new mixture was incubated at 37°C for 30 min to break the disulfide bonds in the protein sample. Finally, a 36 μl portion of 1.0 mol/l iodoacetamide in 1.0 mol/l sodium hydroxide was then added to alkylate the free cysteine groups generated in the glycated or non-glycated HSA. This solution was incubated in the dark for 30 min at room temperature. A 150 μl portion of the 1.0 mol/l DTT reagent was then added to remove any remaining iodoacetamide in the sample.
After pretreatment, a 400 μl portion of the glycated or non-glycated HSA solution (i.e., about 1 mg protein) was placed into a 0.1–0.5 ml dialysis cassette to remove excess chemicals before digestion with trypsin. The sample was dialyzed twice for 4 h at room temperature against 2 500 ml portions of water, followed by dialysis against 500 ml of pH 7.8, 100 mmol/l ammonium bicarbonate buffer for an additional 4 h at room temperature. A 1 μg/μl solution of trypsin was prepared in pH 7.8, 100 mmol/l ammonium bicarbonate buffer. A 50 μl aliquot of the dialyzed HSA sample (containing about 75 μg HSA) was combined with 2.5 μl of the trypsin solution (giving a substrate-to-enzyme ratio of 30:1), with this mixture being incubated at 37 °C for 18 h.
Another 400 μl of the pretreated HSA solution (to be used for digestion with Glu-C) was placed into a 0.1–0.5 ml dialysis cassette. This sample was dialyzed twice against fresh portions of 500 ml water for 4 h at room temperature, followed by dialysis against 500 ml of pH 7.8, 100 mmol/l ammonium bicarbonate buffer for another 4 h. A 1 μg/μl solution of Glu-C was prepared in pH 7.8, 100 mmol/l ammonium bicarbonate buffer. A 50 μl aliquot of the dialyzed HSA solution (containing about 75 μg HSA) was combined with 7.5 μl of the Glu-C solution (giving a substrate-to-enzyme ratio of 10:1) and incubated at 37°C for 8 h. An additional 3.8 μl of the Glu-C solution (giving a new substrate-to-enzyme ratio of 20:1) was later added to the sample and incubated for another 18 h at 37°C.
Samples to be digested with Lys-C were prepared by taking a 400 μl aliquot of a pretreated glycated or non-glycated HSA solution (containing about 1 mg HSA) and placing this into a 0.1–0.5 ml dialysis cassette. This sample was then dialyzed twice against fresh portions of 500 ml water for 4 h at room temperature, followed by dialysis against 500 ml of pH 9.0, 100 mmol/l Tris-HCl buffer for another 4 h. Lys-C was prepared as a 1 μg/μl solution in pH 9.0, 100 mmol/l Tris-HCl buffer. A 50 μl aliquot of the dialyzed HSA (containing about 75 μg protein) was combined with 2.5 μl of the Lys-C solution (giving a substrate-to-enzyme ratio of 30:1) and incubated at 37 °C for 18 h.
After digestion (with either trypsin, Glu-C or Lys-C), 50 μL of the resulting digest for glycated or non-glycated HSA was combined with 5 μl of concentrated formic acid or 5 μl of 1% trifluoroacetic acid (TFA) to adjust the pH to <4. Each of these samples was then divided into 10μl aliquots and stored at −20°C prior to further use.
The ZipTipμ-C18 pipette tips were treated with 10 μl of a 50% (v/v) solution of acetonitrile and water, followed by a wash with 10 μl of 0.1% TFA. A 10 μl aliquot of the desired digest of glycated or non-glycated HSA digest was loaded onto the ZipTipμ-C18 pipette tip by performing 15–20 aspiration-dispensing cycles with this aliquot. Salts in the HSA sample were washed away by twice applying 10 μl of a 5% (v/v) mixture of methanol with water containing 0.1% TFA. Peptides retained by the pipette tip were eluted with a series of 1 μl washes with solvents containing 0.1% TFA in water plus 5%, 10%, 20%, 30%, or 50% (v/v) acetonitrile. The use of this step elution scheme with the ZipTips was found to quite reproducible, as indicated by the fact that almost all of the non-glycated peptides identified in the different elutes of glycated HSA digests were also identified in the same elutes of non-glycated HSA digests (see reference [25] and Supplemental Information). An alternative approach to this fractionation method would be to use microbore HPLC coupled with a fraction collection on a MALDI plate.
2.4 Mass Spectrometric Analysis
The matrix used for the MALDI-TOF MS analysis of glycated and normal HSA digests was a mixture of CHCA and DHB [25,26]. This matrix was obtained by first preparing a 20 μg/μl solution of CHCA in a 70:30 (v/v) mixture of acetonitrile and 5% formic acid; a DHB solution was prepared in a similar manner but was instead placed into a 70:30 (v/v) mixture of acetonitrile and 0.1% TFA. These CHCA and DHB solutions were combined in a 1:1 (v/v) ratio. A 0.5 μl aliquot of this matrix and 0.5 μL of a digested sample of glycated or normal HSA (containing about 15 pmol protein) were placed on a transparency film and mixed together with a pipette tip. The final mixture was aspirated and applied by pipette onto a spot on a MALDI plate.
A stock solution of several standard peptides was prepared by combining 18.4 μλ of 1 μg/μl des-Arg-bradykinin, 33.6 μl of 1 μg/μl angiotensin I, and 408 μl of 0.1 μg/μl Glu-fibrinopeptide B with 7540 μl of a 50:50 (v/v) mixture of acetonitrile and water. This stock solution was divided into several aliquots and frozen at −80°C until use. A 4 μl portion of this stock solution was mixed with 96 μl of the MALDI matrix, giving a final concentration for each standard peptide in this mixture of approximately 1.0–1.3 pmol/μl. A 1 μl portion of this standard mixture was spotted on each well of every other row on the MALDI plates used in this study. The spotted MALDI plate was allowed to air dry for 15–20 min before analysis. The mass scale on the mass spectrum was adjusted based on the calibration data obtained with the given standard peptide mixture.
Each sample spot on the MALDI plate was examined using a final mass spectrum that represented the sum of 250 laser shots over a mass range of 500–3500 Da. All peaks containing ions with a single charge and having a signal-to-noise ratio greater than five were considered for further analysis. The mass accuracy was estimated to be better than 50 ppm under these conditions.
2.5 Analysis of Peptides in Digests of Glycated & Normal HAS
Non-glycated peptides in the digests of glycated or normal HSA were identified by comparing their observed masses in the mass spectra with those masses that were predicted by PeptideMass using the primary sequence of HSA within ≤50 ppm [25,27]. Modified peptides were initially identified by using those peaks that appeared only in mass spectra for glycated HSA under a given set of digestion and analysis conditions.
The identification of potential modified regions on glycated HSA relied on the relative mass shift (△M) caused by the formation of glycation adducts (Fig. 3). First, a “Theoretical Digestion Table” was generated from the primary sequence of HSA by using PERL script algorithm digest.pl [15] along with the following parameters: 1) all cysteines were assumed to be treated with iodoacetamide; 2) the oxidation of methionines was allowed, and 3) the maximum number of missed cleavage sites allowed was three. Next, the expected difference in mass (△M) was subtracted from the masses of all peaks seen in only the digests for glycated HSA; these results were then saved as a text file. This latter file was then compared with peptide masses listed in the “Theoretical Digestion Table” for a digest of HSA by using PERL script alogorithm searchSIM.pl. All mass values in this text file that could be matched within 50 ppm to a predicted mass were considered further as potential regions for modification in glycated HSA. This level of mass accuracy was found to be sufficient for assigning the structures of these modifications based on the observed masses by MALDI-TOF MS, as has noted in previous work [28,29].
Figure 3.
Strategy used for identifying potential modification sites on glycated HSA
The types of modifications that occur in minimally glycated HSA were initially determined based on the observed change in the mass-to-charge ratios for peptides from these regions vs the mass-charge ratios for non-glycated peptides (note: this approach works well for a preparation of a single protein, as used in this study; however, for more complex mixtures it may be necessary to use multiple stages of mass spectrometry to first isolate individual peptide ions and then fragment these ions for their identification and assignment of modifications). The modification sites on peptides that contained more than one possible residue for such changes were identified by comparing the pKa values and fractional solvent accessible surface areas of the lysines and arginines residues in these peptides. The pKa values were calculated using PROPKA [30]. The fractional solvent accessible surface areas were calculated by using VADAR, along with a solvent probe radius of 1.4 Å [31]. The regions determined to be at or near possible modification sites were then mapped onto the 3-dimensional structure of HSA by using Protein Explorer 2.45 Beta [32].
3. Results and Discussion
3.1 General Considerations in Method Development
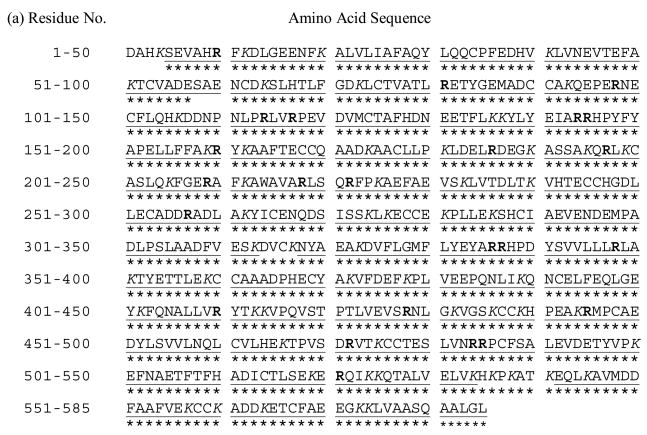
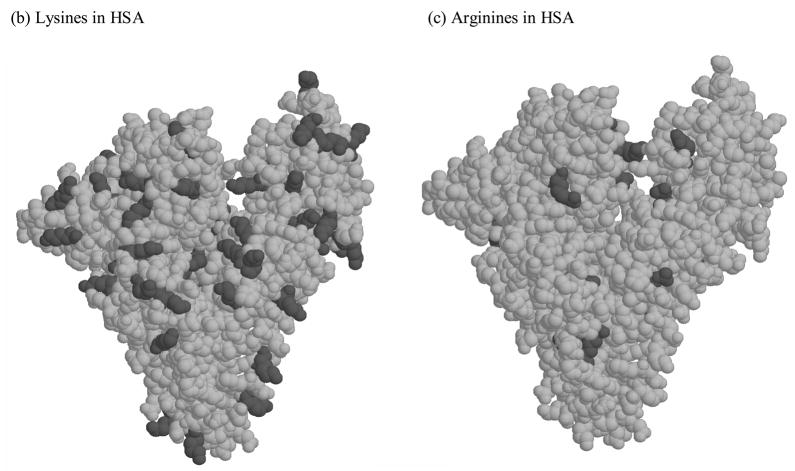
The potential modification sites on HSA that could, in theory, be involved in glycation or AGE formation include 59 lysines, 23 arginines and the N-terminal amine. These sites are distributed in a relatively uniform pattern throughout both the primary sequence and tertiary structure of HSA, as shown in Figure 4. To examine as many of these possible modification sites as possible by MALDI-TOF MS, the samples examined in this work were treated using multiple enzyme digestion (based on trypsin, Lys-C and Glu-C) and ZipTip fractionation. When using this approach to study normal HSA, a sequence coverage of 97.4% has been reported [25]; the same conditions were used in this current study to examine both glycated and normal HSA.
Figure 4.
(a) Primary sequence and (b–c) crystal structure of HSA. The lysine residues (K) are given in italics in (a) and as darkened regions in (b). The arginine residues (R) are given in bold in (a) and as darkened regions in (c). The sequence in (a) shown the regions of the primary sequence that could be identified by MALDI-TOF MS for normal HSA ( ___ ) and minimally glycated HSA (***). The plots (b) and (c) are based on PDB file 1AO6.
When only the non-modified peptides in the digests of glycated HSA were considered during this study, the sequence coverage of the glycated HSA was 97.8% under the conditions used in Ref. [25]. When both modified and non-modified were considered, the overall sequence coverage for glycated HSA reached 98.8% (see Fig. 4). This sequence coverage included 58 out of 59 lysine residues in HSA (98.3%) and all of the arginine residues in this protein. Of all the sites on HSA that could potentially be involved in glycation or AGE formation, only residue K4 and N-terminus were not included in this sequence coverage. The most likely reason why these residues were not detected is that the relatively small peptide containing these sites and formed from residues 1–4 (DAHK, 469.24 Da) was obscured or suppressed by the matrix or other low mass peaks that occurred in the mass spectra for normal HSA and glycated HSA.
The sequence coverage obtained in this study was found to be sufficient for examining the locations of all possible non-crosslinking modifications that have been previously reported for minimally glycated HSA that have been previously prepared in vitro, as based on chromatographic studies [9,33]. As indicated in Figure 1, these modifications include both early and advanced glycation adducts involving lysine and arginine residues.
3.2 Tryptic Digests of Glycated HAS
A total of 10 modified peptides were identified in tryptic digests of glycated HSA, representing 23.2% of the primary sequence of HSA (see the Supplemental Information for a list of these and all other peptides that were detected in this study). A total of 53 non-modified peptides were also identified in tryptic digests of glycated HSA, covering 82.4% of the sequence for this protein. When these results for modified and non-modified peptides were combined, the overall sequence coverage for the glycated HSA was found to be 91.3% based on only its tryptic digest.
Among the ten modified peptides that were identified in the tryptic digests of glycated HSA, all but one peptide could be assigned to a given sequence of HSA within a mass tolerance of 50 ppm. This particular peptide had a mass of 1820.00, giving it a fit with either residues 191-205 (with a mass increase of 144.04) or 337-351 (with a mass increase of 39.99) within a mass tolerance of 50 ppm. However, it gave the best match to residues 191-205 when using a mass tolerance of 20 ppm.
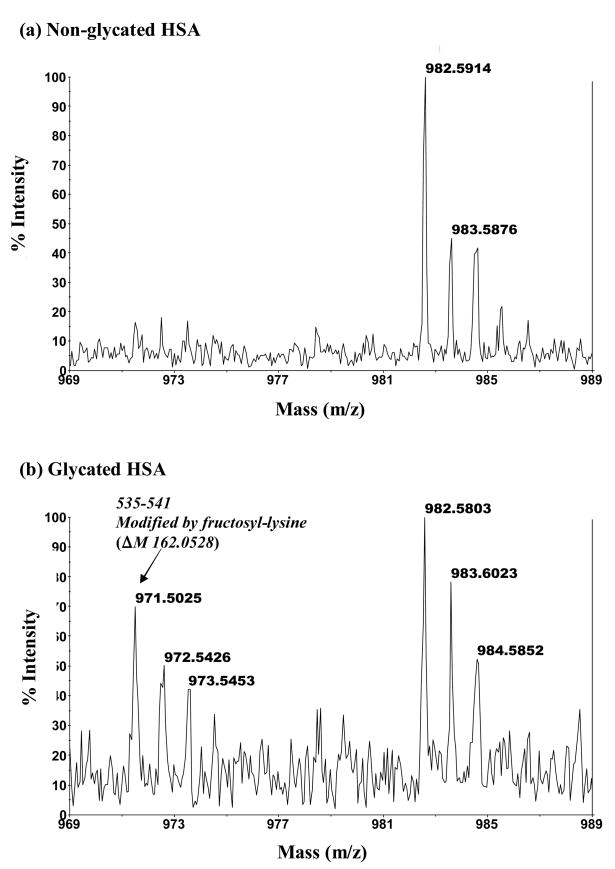
An example of one modified peptide noted in the digest of glycated HSA had a mass of 971.50, as seen in Figures 5(b). This peptide was not detected in the digests of normal HSA under the same digestion and analysis conditions, as indicated in Figure 5(a). The mass of this peptides indicated that it originated from the 535–541 section of HSA and represented a fructosyl-lysine modification, giving a mass increase of 162.05 Da vs the theoretical mass of the non-glycated peptide from the same region in normal HSA. Although the mass for many of the modified peptides seen in such spectra could be linked to a particular type of modification, those glycated peptides with a mass increase of 144.04 Da (e.g., modified peptides originating from the 191-205, 219-240 and 349-372 regions of HSA) could have been due to the formation of a fructo-lysine with the subsequent loss of one water (FL-1 H2O), the formation Nε-[5-(2,3,4-trihydroxybutyl)-5-hydro-4-imidazolon-2-yl)ornithine (3-DG-H1) or the creation of tetrahydropyrimidine (THP) at an arginine residue. In some cases it was possible to discriminate between these possibilities since there were only lysine or arginine residues in the given section of HSA. There was also one glycated peptide in the tryptic digest that had two modifications. This latter peptide originated from the 196-209 region of HSA and involved the addition of glucose to both K199 and K205, resulting in a total mass increase of 324.11 Da.
Figure 5.
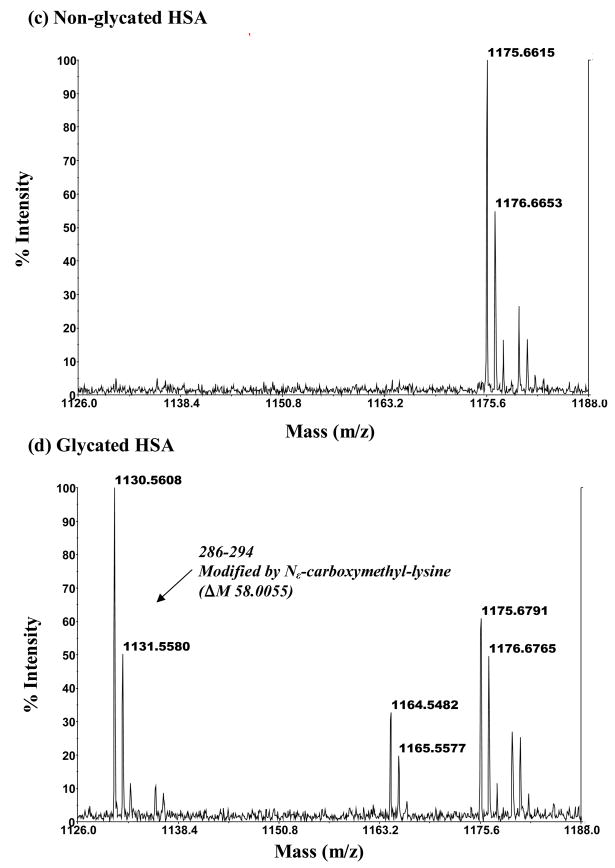
MALDI-TOF MS mass spectra for modified peptides found in digests of glycated HSA but absent in digests of normal HSA. The mass spectrum in (b) is for a modified peptide with a mass of 971.50 Da that originates from the 535–541 region of HSA and represents a fructosyl-lysine modification (ΔM, 162.05 Da). The mass spectrum in (d) is for a modified peptide with a mass of 1130.56 Da that corresponds to the 286–294 region of HSA and represents a Nε-carboxymethyl-lysine modification (ΔM, 58.01 Da). The mass spectra in (a) and (c) show the absence of these modified peptides in digests of normal HSA.
A comparison of non-modified peptides found in tryptic digests of normal HSA [25] and those noted in this study for minimally glycated HSA gave similar results for most of these peptides. However, there were five peptides that were only observed in the tryptic digests of normal HSA. These five peptides had masses of 658.33, 875.50, 1305.61, 2545.17 and 2599.28 Da, representing residues 94-98, 219-225, 277-286, 501-521 and 390-410, respectively. One reason these peaks may not have appeared in the tryptic digests of glycated HSA is due to their complete shift to a different mass as a result of modification. For example, a peak noted with a mass of 875.51 Da in the tryptic digests of normal HSA shifted to a mass of 955.54 Da in glycated HSA as a result of the addition of argpyrimidine on R222. Another possible cause of this effect, as will be seen later in the work with Lys-C, is that sometimes the glycated HSA and normal HSA gave different digestion patterns for trypsin due to modifications that occurred at or near the terminus of a given peptide sequence. A similar effect has been noted in a previous study of highly glycated HSA [14].
3.3 Glu-C Digests of Glycated HAS
Digests prepared with the enzyme Glu-C were also used with MALD-TOF MS to examine the modified and non-modified peptides in minimally glycated HSA. A total of 11 modified and 30 non-modified peptides were identified in these digests, representing 20.7% and 71.1% of the primary sequence of HSA, respectively. When the results were combined, the overall sequence coverage for glycated HSA in the Glu-C digest was 77.8%.
Of the 11 modified peptides that were identified for glycated HSA in the Glu-C digest, 10 were found to have unambiguous locations in the sequence of HSA when using a mass tolerance of 50 ppm. The only peptide that did not have a specific assigned site within a mass tolerance of 50 ppm was a peptide with a mass of 2118.07. This mass gave a fit with that predicted for either residues 384-400 after a Nε-carboxymethyl-lysine modification or with residues 426-442 after a fructosyl-lysine modification. However, the best match (within a mass tolerance of 10 ppm) for this peptide was to residues 426-442 after a fructosyl-lysine modification.
Figure 5(d) showed an example of one modified peptide detected in the Glu-C digest of glycated HSA. This peptide had a mass of 1130.56 and was not detected in the digests of normal HSA under the same digestion and analysis conditions, as shown in Figure 5(c). It was identified that this peptide comes from the 286-294 section of HSA and represents a Nε-carboxymethyl-lysine modification at K286, giving a mass increase of 58.01 Da vs the theoretical mass of the non-glycated peptide from the same region in normal HSA.
A comparison of non-glycated peptides in the Glu-C digests of normal HSA [25]and glycated HSA revealed that three peptides were present only in the Glu-C digests of non-glycated HSA. These peptides had masses of 599.35, 1432.72 and 1798.83 Da, representing residues 281-285, 322-333 and 506-520. Modifications at or near these regions are again thought to be responsible for the lack of appearance of these peaks in the mass spectra for glycated HSA. For example, the absence of a peak with at mass of 599.35 Da (originating from residues 281-285) in the glycated HSA implies that either K281 or K286 was modified. This was supported by the appearance of a modified peptide originating from 286-294 in the Glu-C digests of glycated HSA that resulted from the CML modification of residue K286.
3.4 Lys-C Digests of Glycated HAS
A total of 2 modified peptides and 44 non-modified peptides were identified in the Lys-C digests of glycated HSA, representing 4.4% and 75.7% of the primary sequence of HSA. When both the modified and non-modified peptides were considered together, the overall sequence coverage for glycated HSA in the Lys-C digest was 75.7%.
A comparison of non-glycated peptides in the Lys-C digests of normal HSA [25] and glycated HSA revealed that three peptides were present in only the digests of normal HSA. These peptides had masses of 544.34, 1498.54 and 3119.56 Da, representing residues 196-199, 52-64 and 390-414 of HSA. As was noted for the tryptic and Glu-C digests, modifications at or near these regions is thought to be responsible for the lack of any peaks from these peptides in the mass spectra for glycated HSA. As an example, the lack of a peak with a mass of 1498.54 Da implied that either K51 or K64 was being modified in glycated HSA. This was supported by the fact that one modified peptide originating from sequence 49-57 was found in the Glu-C digests of glycated HSA, representing the formation of a fructosyl-lysine residue at K51.
3.5 Characterization of Modification on Glycated HAS
The results for the various digests were combined to determine the specific residues in minimally glycated HSA that were being modified. Some of these modification sites could be clearly identified because only a single possible site of modification (e.g., a single lysine or arginine) was present in the modified peptide’s sequence. This group of peptides included modification sites that involved seven lysine and three arginine residues, as summarized in Table 1. Each of these residues had 1 specific type of modification except K378, which was modified to give a Nε-carboxyethyl-lysine (CEL) in some forms of minimally glycated HSA but underwent a fructosyl-lysine modification in others.
Table 1.
Peptides only containing one type of modification in minimally glycated HSA
| Location in HAS | Digests in which identified | Type of modificationa | Possible modification sites in peptide |
|---|---|---|---|
| 7–17 | Glu-C | FL | K12 |
| 49–57 | Glu-C | FL-2 H2O | K51 |
| 145–160 | Trypsin | Pyrraline | K159 |
| 160–181 | Trypsin | G-H1 | R160 |
| 196–209 | Trypsin | 2 FL | K199 & K205 |
| 219–225 | Trypsin | Argpyrimidine | R222 |
| 286–294 | Glu-C | CML | K286 |
| 377–382 | Glu-C | FL-2 H2O | K378 |
| 377–383 | Glu-C | CEL | K378 |
| 467–484 | Trypsin | G-H1 | R472 |
See Figure 1 for the full names and structures of these various modification classes.
There were also some modified peptides where 2 or more potential modification sites were available. This second group is summarized in Table 2. For these peptides, further analysis was performed to determine the most likely residues that were involved in the modification process. This analysis included estimation and comparison of the pKa values of all lysines or arginines in these peptides, as well as a comparison of the calculated fractional accessible surface areas for these lysine and arginine residues. During this analysis, K199, R222, K439 and K538 were all identified as likely modification sites because they had either relatively low pKa values (K199 and R222) or large fractional accessible surface areas (K439 and K538) vs other lysines or arginines in the same regions of glycated HSA. For example, K199 has a predicted pKa of 7.47 vs a range of 6.23–11.11 and average of 10.08 for all lysines in HSA; similarly, R222 has a predicted pKa of 7.56 vs a range of 7.56–16.02 and average of 12.34 for all arginines in HSA. This feature is important to consider since lysines or arginines with low pKa values would have a larger fraction of their residues in a non-protonated state, as is required for the nuclophilic substitution and/or nucleophilic addition during glycation for AGE formation [34,35]. Examples of residues in Table 2 with good accessibility to the surrounding solvent are K439 and K538, which have ASA values of 0.94–0.96 vs a range of 0.01–0.96 and average of 0.52 for all lysines on HSA; this high level of accessibility should give these residues a higher chance of interacting with glucose or related intermediates involved in AGE formation.
Table 2.
Peptides in minimally glycated HSA containing several potential modification sites
| Location in HSA | Digests in which identified | Type of modificationa | Possible modification sitesb | Estimated pKa | Estimated fractional solvent accessible surface areas |
|---|---|---|---|---|---|
| 133–141 | Glu-C | FL-1 H2O | K136 or K137 | 10.27/10.43 | 0.27/0.52 |
| 154–167 | Glu-C | FL | K159 or K162 | 9.94/10.43 | 0.44/0.43 |
| 168–188 | Glu-C | CEL | K174 or K181 | 10.22/10.01 | 0.34/0.37 |
| 191–205 | Trypsin | FL-1 H2O or 3-DG-H1/THP |
K195, K199 or R197 |
10.76/7.47 14.37 |
0.50/0.16 0.13 |
| 200–218 | Trypsin | AFGP | K205, R209 or K212 | 10.43/12.08/10.43 | 0.58/0.61/0.40 |
| 206–225 | Lys-C | FL | K212 or K225 | 10.43/9.80 | 0.40/0.44 |
| 219–240 | Trypsin | FL-1 H2O or 3-DG-H1/THP |
K225, K233 or R222 |
9.80/10.29 7.56 |
0.44/0.43 0.16 |
| 349–372 | Trypsin | FL-1 H2O | K351 or K359 | 10.15/10.50 | 0.61/0.81 |
| 377–393 | Glu-C | Pyrraline | K378 or K389 | 10.50/10.50 | 0.71/0.68 |
| 426–442 | Glu-C | FL | K432, K436 or K439 | 9.92/9.67/10.50 | 0.36/0.51/0.94 |
| 520–525 | Lys-C | CEL | K524 or K525c | 10.43/10.06 | 0.54/0.07 |
| 535–541 | Trypsin | FL | K536 or K538 | 10.08/10.50 | 0.24/0.96 |
| 572–585 | Glu-C | Pyrraline | K573 or K574 | 10.50/10.50 | 0.72/0.82 |
See Figure 1 for the full names and structures of these various modification classes.
The residues in bold are the suspected modification sites in minimally glycated HSA. The pKa and accessible surface areas for these sites are also given in bold.
K525 has been reported in previous in vivo work to be a major site of modification for HSA with low levels of glycation [36].
For some peptides in Table 2, none of the potential modification sites had either a low pKa or high ASA values. In these cases other factors such as structural flexibility or a favorable microenvironment may be required for a given lysine or arginine to take part in glycation. As an example, K525 was found both in this study and in previous in vivo [36] or in vitro [14] studies to be a potential site of glycation even though it does not have a particularly low pKa or high level of accessibility to solvent.
Previous chromatographic studies of modifications that occur in minimally-glycated HSA have noted mainly FL and CML residues, plus minor amounts of modifications involving Nε-(5-hydro-4-imidazolon-2-yl)ornithine (G-H1), argpyrimidine, 3-DG-H1, THP and Nε-(5-hydro-5-methyl-4-imidazolon-2-y1)ornithine (MG-H1) [9]. In this earlier work, the average concentrations of FL and CML modifications were determined to be 1.21 and 1.42 mol/mol HSA, respectively, but the locations of these modifications were not reported. In this current study, it was found that FL modifications could occur on HSA at K12, K51, K199, K205, K378, K439 and/or K538 (Tables 1 and 2). Other possible sites of FL modifications included K136 or K137, K159 or K162, K212 or K225 and K351 or K359. The only site found to have any detectable amount of CML modification was at K286. It was further found that the sites on minimally glycated HSA that gave detectable amounts of G-H1 and argpyrimidine modifications were R160 or R472 and R222, respectively. Since both THP and 3-DG-H1 modified peptides have a mass shift of 144.04, these particular modifications could not be discriminated based only on the mass spectra used in this study. However, it was found that the only site on HSA with have any measurable amount of modification by THP or 3-DG-H1 was again R222. This is not surprising considering the fact that R222 has the lowest predicted pKa value (7.56) of all arginine residues on HSA. No sites on minimally glycated HSA that were modified by MG-H1 were noted in this current study. This may be either due to the low intensity of the MG-H1 modified peptides or their suppression on the mass spectrometry by the matrix or other peptide peaks produced in this work. In addition, pyralline was found on K159 in this study, as well as on K378 or K389 and K573 or K574; this particular modification has not been noted in previous work with glycated HSA and is unique to this current study.
Of the various modification sites listed in Tables 1 and 2, 4 (K12, K199, K439 and K525) have been identified in a previous studies of in vivo glycated sites of HSA [36–38]. In addition, modification at K378 has been reported based on MALDI-TOF analysis of highly glycated HSA that has been produced in vitro [14]. The remaining modification sites (involving at least five lysines and three arginines) for minimally glycated HSA have not been reported in previous work. These newly discovered modification sites included lysines K51, K159, K205, K286, and K538, as well as arginines R160, R222 and R472, among others.
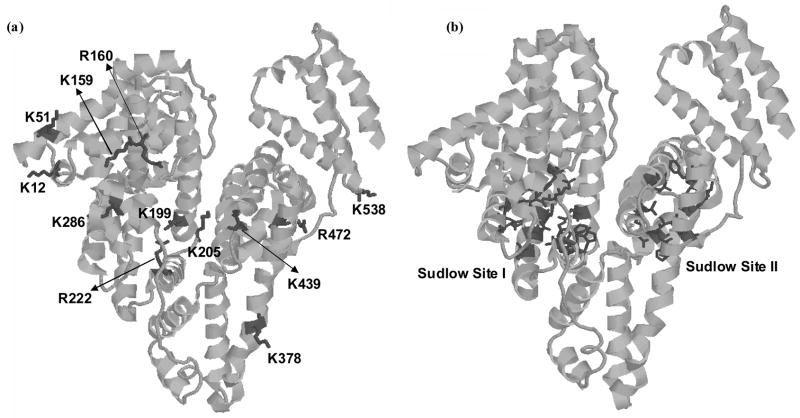
Figure 6 shows the locations of these various modification sites on the three dimensional structure of HSA. This figure also includes the known locations of the 2 major drug binding sites on HSA (i.e., Sudlow sites I and II). As is shown in this figure, modifications that occur at K199, R222 and K286 would be located at or near Sudlow site I, while a modification at K439 would be close to Sudlow site II. In addition, a modification at K378 would be located on the same helix (h1 in Subdomain III of HSA) as residues P384, L387, I388 and N391, which are all involved in Sudlow site II.
Figure 6.
The 3-dimensional structure of HSA, showing (a) the sites of both early and advanced glycation adducts on HSA and (b) the locations of Sudlow sites I and II. These structures are based on PDB file 1AO6.
The results in Figure 6 support the belief that glycation or AGE formation at some of these residues could lead to altered binding of drugs and small molecules at Sudlow sites I and II. These changes in binding might occur due to a change in local charge or secondary structure as a result of glycation [39,40]. This may explain why several drugs used to probe binding at Sudlow site II (e.g., dansylproline, ibuprofen and flufenamic acid) and Sudlow site I (e.g., warfarin and phenylbutazone) have been observed to give different binding behavior for glycated HSA vs normal HSA [23,24]. These results suggest that further research is warranted in examining the effects of glycation on the binding of drugs to HSA and on the changes that may occur in drug behavior as a result of such modifications.
4. Conclusions
In this work, MALDI-TOF MS was used to characterize the modification sites and structures of glycation and AGE products on minimally glycated HSA that was prepared in vitro. The use of a multiple enzyme digestion and peptide fractionation before MALDI-TOF MS analysis allowed 98.8% of the primary sequence of HSA to be examined in this study. A comparison of the results for glycated and non-glycated HSA lead to the identification of several specific lysine and arginine residues as likely modification sites in minimally glycated HSA. These residues included K12, K51, K159, K199, K205, K286, K378, K439, K538, R160, R222 and R472.
The types of modifications that were occurring at each of these residues were also determined. For instance, it was found that K12, K51, K199, K205, K439 and K538 were modified through the formation of fructosyl-lysine (with or without the loss of one or two molecules of water). Modifications at residues K159 and K286 involved the formation of pyrraline and Nε-carboxymethyl-lysine, respectively. Lysine K378 was modified by Nε-carboxyethyl-lysine in some forms of glycated HSA but underwent a fructosyl-lysine modification in other forms of this same protein. Residues R160 and R472 were modified by reaction with G-H1. Lysine R222 was modified to give argpyrimidine in some forms of glycated HSA but was modified to give 3-DG-H1 or THP in other forms. Further studies based on quantitative proteomics are currently in progress to determine the relative extent to which each of these sites is modified in glycated HSA. The extension of these studies to in vivo glycated HSA is also being considered.
With the exception of K12, K199, K378, K439 and K525, all of the observed modification sites for minimally glycated HSA are new to this current study. The locations of these modification sites were also noted on the three dimensional structure of HSA and compared to the known locations of the two major drug binding sites on HSA. It was found from this comparison that many of these modifications were near these drug binding sites. This could explain why some differences have been previously noted in the binding of certain drugs to glycated vs non-glycated HSA. The results in this paper will also provide important structure information in examining the effects of glycation on the binding of drugs to HSA and on the changes that may occur in drug behavior as a result of such modifications.
Supplementary Material
Acknowledgments
This work was supported by the National Institutes of Health under grants R01 GM044931 and R01 DK069629. These studies were performed in facilities that were remodeled under NIH grant RR015468-001 and using a mass spectrometry facility that was supported by NIH grants P20 RR15635 and RR015468, NCI grant P30 CA36727, and the Nebraska Research Initiative. We thank Drs. Kurt Wulser, Yifeng Zhu and Zhengdeng Lei for their assistance during this project.
List of abbreviations
- AGE
advanced glycation endproduct
- AFGP
1-alkyl-2-formyl-3,4-glycosyl-pyrrole
- CEL
Nε-carboxyethyl-lysine
- CML
Nε-carboxymethyl-lysine
- 3-DG-H1
Nε-[5-(2,3,4-trihydroxybutyl)-5-hydro-4-imidazolon-2-yl]ornithine
- FL
fructosyl-lysine
- G-H1
Nε-(5-hydro-4-imidazolon-2-yl)ornithine
- HSA
human serum albumin
- MG-H1
Nε-(5-hydro-5-methyl-4-imidazolon-2-yl)ornithine
- THP
tetrahydropyrimidine
- TFA
trifluoroacetic acid
Footnotes
Publisher's Disclaimer: This is a PDF file of an unedited manuscript that has been accepted for publication. As a service to our customers we are providing this early version of the manuscript. The manuscript will undergo copyediting, typesetting, and review of the resulting proof before it is published in its final citable form. Please note that during the production process errors may be discovered which could affect the content, and all legal disclaimers that apply to the journal pertain.
References
- 1.Theodore Peters J, editor. All about albumin: biochemistry, genetics, and medical applications. San Diego, CA: Academic Press Limited; 1996. [Google Scholar]
- 2.Muller WA, Fehske KJ, Schlafer SAC. Structure of binding sites on albumin. In: Reidenberg MM, Erill S, editors. Drug-protein binding. New York: Praeger Publishers; 1986. [Google Scholar]
- 3.Sjoholm I. The specificity of drug binding sites on human serum albumin. In: Reidenberg MM, Erill S, editors. Drug-protein binding. New York: Praeger Publishers; 1986. [Google Scholar]
- 4.He XM, Carter DC. Structure of human serum albumin. Science. 1990;249:302–303. doi: 10.1126/science.2374930. [DOI] [PubMed] [Google Scholar]
- 5.Gwilt PR, Nahhas RR, Tracewell WG. The effects of diabetes mellitus on pharmacokinetics and pharmacodynamics in humans. Clin Pharmacokinet. 1991;20:477–490. doi: 10.2165/00003088-199120060-00004. [DOI] [PubMed] [Google Scholar]
- 6.Ulrich P, Cerami A. Protein glycation, diabetes, and aging. Recent Prog Horm Res. 2001;56:1–21. doi: 10.1210/rp.56.1.1. [DOI] [PubMed] [Google Scholar]
- 7.Bunk DM. Characterization of the glycation of albumin in freeze-dried and frozen human serum. Anal Chem. 1997;69:2457–2463. doi: 10.1021/ac961205m. [DOI] [PubMed] [Google Scholar]
- 8.Mereish KA, Rosenberg H, Cobby J. Glucosylated albumin and its influence on salicylate binding. J Pharm Sci. 1982;71:235–238. doi: 10.1002/jps.2600710223. [DOI] [PubMed] [Google Scholar]
- 9.Ahmed N, Thornalley PJ. Chromatographic assay of glycation adducts in human serum albumin glycated in vitro by derivatization with 6-aminoquinolyl-N-hydroxysuccinimidyl-carbamate and intrinsic fluorescence. Biochem J. 2002;364:15–24. doi: 10.1042/bj3640015. [DOI] [PMC free article] [PubMed] [Google Scholar]
- 10.Lapolla A, Fedele D, Traldi P. The role of mass spectrometry in the study of non-enzymatic protein glycation in diabetes. Mass Spectrom Rev. 2000;19:279–304. doi: 10.1002/1098-2787(2000)19:5<279::AID-MAS3>3.0.CO;2-G. [DOI] [PubMed] [Google Scholar]
- 11.Ahmed N, Dobler D, Dean M, Thornalley PJ. Peptide mapping identifies hotspot site of modification in human serum albumin by methylglyoxal involved in ligand binding and esterase activity. J Biol Chem. 2005;280:5724–5732. doi: 10.1074/jbc.M410973200. [DOI] [PubMed] [Google Scholar]
- 12.Marotta E, Lapolla A, Fedele D, et al. Accurate mass measurements by Fourier transform mass spectrometry in the study of advanced glycation end products/peptides. J Mass Spectrom. 2003;38:196–205. doi: 10.1002/jms.431. [DOI] [PubMed] [Google Scholar]
- 13.Thornalley Paul J, Battah S, Ahmed N, et al. Quantitative screening of advanced glycation endproducts in cellular and extracellular proteins by tandem mass spectrometry. Biochem J. 2003;375:581–592. doi: 10.1042/BJ20030763. [DOI] [PMC free article] [PubMed] [Google Scholar]
- 14.Lapolla A, Fedele D, Reitano R, et al. Enzymatic digestion and mass spectrometry in the study of advanced glycation end products/peptides. J Am Soc Mass Spectrom. 2004;15:496–509. doi: 10.1016/j.jasms.2003.11.014. [DOI] [PubMed] [Google Scholar]
- 15.Zhang Y, Cocklin Ross R, Bidasee Keshore R, Wang M. Rapid determination of advanced glycation end products of proteins using MALDI-TOF-MS and PERL script peptide searching algorithm. J Biomol Tech. 2003;14:224–230. [PMC free article] [PubMed] [Google Scholar]
- 16.Kislinger T, Humeny A, Peich CC, Becker C-M, Pischetsrieder M. Analysis of protein glycation products by MALDI-TOF-MS. Ann NY Acad Sci. 2005;1043:249–259. doi: 10.1196/annals.1333.030. [DOI] [PubMed] [Google Scholar]
- 17.Thornalley PJ, Argirova M, Ahmed N, Mann VM, Argirov O, Dawnay A. Mass spectrometric monitoring of albumin in uremia. Kidney Intl. 2000;58:2228–2234. doi: 10.1111/j.1523-1755.2000.00398.x. [DOI] [PubMed] [Google Scholar]
- 18.Lapolla A, Fedele D, Reitano R, et al. Advanced glycation end products/peptides: An in vivo investigation. Ann NY Acad Sci. 2005;1043:267–275. doi: 10.1196/annals.1333.032. [DOI] [PubMed] [Google Scholar]
- 19.Gugliucci A, Bendayan M. Renal fate of circulating advanced glycated end products (AGE): Evidence for reabsorption and catabolism of AGE-peptides by renal proximal tubular cells. Diabetologia. 1996;39:149–160. doi: 10.1007/BF00403957. [DOI] [PubMed] [Google Scholar]
- 20.Gugliucci A, Menini T. Circulating advanced glycation peptides in streptozotocin-induced diabetic rats: evidence for preferential modification of IgG light chains. Life Sci. 1998;62:2141–2150. doi: 10.1016/s0024-3205(98)00189-1. [DOI] [PubMed] [Google Scholar]
- 21.Gatti G, Crema F, Attardo-Parrinello G, Fratino P, Aguzzi F, Perucca E. Serum protein binding of phenytoin and valproic acid in insulin-dependent diabetes mellitus. Ther Drug Monit. 1987;9:389–391. doi: 10.1097/00007691-198712000-00005. [DOI] [PubMed] [Google Scholar]
- 22.McNamara PJ, Blouin RA, Brazzell RK. The protein binding of phenytoin, propranolol, diazepam, and AL01576 (an aldose reductase inhibitor) in human and rat diabetic serum. Pharmaceut Res. 1988;5:261–265. doi: 10.1023/a:1015966402084. [DOI] [PubMed] [Google Scholar]
- 23.Bohney JP, Feldhoff RC. Effects of nonenzymatic glycosylation and fatty acids on tryptophan binding to human serum albumin. Biochem Pharmacol. 1992;43:1829–1834. doi: 10.1016/0006-2952(92)90717-w. [DOI] [PubMed] [Google Scholar]
- 24.Okabe N, Nakasaka T. Drug binding properties of glycosylated bovine serum albumin as measured by circular dichroism. Biol Pharm Bull. 1994;17:1505–1507. doi: 10.1248/bpb.17.1505. [DOI] [PubMed] [Google Scholar]
- 25.Wa C, Cerny R, Hage David S. Obtaining high sequence coverage in matrix-assisted laser desorption time-of-flight mass spectrometry for studies of protein modification: analysis of human serum albumin as a model. Anal Biochem. 2006;349:229–241. doi: 10.1016/j.ab.2005.11.015. [DOI] [PubMed] [Google Scholar]
- 26.Laugesen S, Roepstorff P. Combination of two matrices results in improved performance of MALDI MS for peptide mass mapping and protein analysis. J Am Soc Mass Spectrom. 2003;14:992–1002. doi: 10.1016/S1044-0305(03)00262-9. [DOI] [PubMed] [Google Scholar]
- 27.Wilkins MR, Lindskog I, Gasteiger E, et al. Detailed peptide characterization using PEPTIDEMASS - a World-Wide-Web-accessible tool. Electrophoresis. 1997;18:403–408. doi: 10.1002/elps.1150180314. [DOI] [PubMed] [Google Scholar]
- 28.Nordhoff E, Egelhofer V, Giavalisco P, et al. Large-gel two-dimensional electrophoresis-matrix assisted laser desorption/ionization-time of flight-mass spectrometry: an analytical challenge for studying complex protein mixtures. Electrophoresis. 2001;22:2844–2855. doi: 10.1002/1522-2683(200108)22:14<2844::AID-ELPS2844>3.0.CO;2-7. [DOI] [PubMed] [Google Scholar]
- 29.Jensen ON, Podtelejnikov A, Mann M. Delayed extraction improves specificity in database searches by matrix-assisted laser desorption/ionization peptide maps. Rapid Comm Mass Spectrom. 1996;10:1371–1378. doi: 10.1002/(SICI)1097-0231(199608)10:11<1371::AID-RCM682>3.0.CO;2-5. [DOI] [PubMed] [Google Scholar]
- 30.Li H, Robertson Andrew D, Jensen Jan H. Very fast empirical prediction and rationalization of protein pKa values. Proteins. 2005;61:704–721. doi: 10.1002/prot.20660. [DOI] [PubMed] [Google Scholar]
- 31.Willard L, Ranjan A, Zhang H, et al. VADAR: A web server for quantitative evaluation of protein structure quality. Nucleic Acids Res. 2003;31:3316–3319. doi: 10.1093/nar/gkg565. [DOI] [PMC free article] [PubMed] [Google Scholar]
- 32.Martz E. Protein Explorer: easy yet powerful macromolecular visualization. Trends Biochem Sci. 2002;27:107–109. doi: 10.1016/s0968-0004(01)02008-4. [DOI] [PubMed] [Google Scholar]
- 33.Ahmed N, Argirov Ognian K, Minhas Harjit S, Cordeiro Carlos AA, Thornalley Paul J. Assay of advanced glycation endproducts (AGEs): Surveying AGEs by chromatographic assay with derivatization by 6-aminoquinolyl-N-hydroxysuccinimidyl-carbamate and application to Nε-carboxymethyl-lysine- and Nε-(1-carboxyethyl)lysine-modified albumin. Biochem J. 2002;364:1–14. doi: 10.1042/bj3640001. [DOI] [PMC free article] [PubMed] [Google Scholar]
- 34.Jing H, Kitts DD. Physiological and pharmacological properties of Maillard reaction products. Recent Res Develop Mol Cellular Biochem. 2003;1:59–75. [Google Scholar]
- 35.Monnier VM. Intervention against the Maillard reaction in vivo. Arch Biochem Biophys. 2003;419:1–15. doi: 10.1016/j.abb.2003.08.014. [DOI] [PubMed] [Google Scholar]
- 36.Garlick RL, Mazer JS. The principal sites of nonenzymatic glycosylation of human serum albumin in vivo. J Biol Chem. 1983;258:6142–6146. [PubMed] [Google Scholar]
- 37.Day JF, Thorpe SR, Baynes JW. Nonenzymically glucosylated albumin. In vitro preparation and isolation from normal human serum. J Biol Chem. 1979;254:595–597. [PubMed] [Google Scholar]
- 38.Iberg N, Flueckiger R. Nonenzymic glycosylation of albumin in vivo. Identification of multiple glycosylated sites. J Biol Chem. 1986;261:13542–13545. [PubMed] [Google Scholar]
- 39.Howard MJ, Smales CM. NMR Analysis of synthetic human serum albumin a-helix 28 identifies structural distortion upon Amadori modification. J Biol Chem. 2005;280:22582–22589. doi: 10.1074/jbc.M501480200. [DOI] [PubMed] [Google Scholar]
- 40.Shaklai N, Garlick RL, Bunn HF. Nonenzymatic glycosylation of human serum albumin alters its conformation and function. J Biol Chem. 1984;259:3812–3817. [PubMed] [Google Scholar]
Associated Data
This section collects any data citations, data availability statements, or supplementary materials included in this article.


