Abstract
Two-dimensional infrared spectra of peptides are introduced that are the direct analogues of two- and three-pulse multiple quantum NMR. Phase matching and heterodyning are used to isolate the phase and amplitudes of the electric fields of vibrational photon echoes as a function of multiple pulse delays. Structural information is made available on the time scale of a few picoseconds. Line narrowed spectra of acyl-proline-NH2 and cross peaks implying the coupling between its amide-I modes are obtained, as are the phases of the various contributions to the signals. Solvent-sensitive structural differences are seen for the dipeptide. The methods show great promise to measure structure changes in biology on a wide range of time scales.
The notion of using multidimensional nonlinear infrared (IR) spectroscopy to obtain molecular structures with high time resolution appears to be very promising (1–4). Important applications of such methods include the identification of dynamic structures in liquids and conformational dynamics of molecules, peptides, and perhaps small proteins in solutions. The optimum IR methods must incorporate the ability to control the responses of particular vibrational transitions depending on their coupling to one another. In magnetic resonance this disentangling of complex spectra is accomplished by multiple pulse sequences that manipulate the spin coherences and populations (5). An analogous approach in IR spectroscopy will require multiple IR pulses having well-defined spectral bandwidth, phase, and amplitude. From such experiments we can expect that vibrational spectra can be spread into a number of dimensions so that the coupling between modes at different spatial locations can be determined. Thus our strategy has been to regard the liquid, peptide, or small protein as a network of coupled vibrators. The couplings between the separated excitations obtained from multiple-pulse IR experiments then could be used to determine the three-dimensional structure on the basis of our knowledge of the vibrational dynamics, the chemical bond connectivity, and an intermode potential function. Although such a procedure is not yet routine for even the simplest systems, the benefit will be a significant advance in the ability to observe the time evolution of structural changes and the couplings between different pieces of macromolecules.
In the present work we use three phase-controlled IR pulses to obtain the third-order response of the molecules to the IR fields. Each pulse is sufficiently weak that the signal is proportional to the product of the three field magnitudes. Related third- and higher-order methods (6–9) have been demonstrated in visible laser spectroscopy (1, 2, 10–24). The method of choice to provide optimal spectral resolution by eliminating the inhomogeneous broadening in the IR spectrum is the photon echo. Both two-pulse (25) and three-pulse IR photon echoes (26) of vibrations have been studied previously, but in these echo experiments the generated third-order field creates a signal on a square law detector, which is insensitive to the phase of the signal. Spectral resolution of the vibrational echo permits some phase relations to be obtained, but does not yield line-narrowed spectra. However, the complete generated field amplitude and phase, free from any static inhomogeneous broadening, can be obtained in principle by means of IR heterodyne echoes or spectral interferometry techniques.
Time gating (16–19), heterodyne detection (20–22), and spectrally resolved heterodyne detection (23, 24) have been demonstrated for electronic two-level systems. By contrast the vibrational response at the third order involves a multilevel system consisting of the set of coupled v = 0, v = 1, and v = 2 quantum states of the vibrators in the molecule. In this work we report measurements of the complete echo field generated from vibrators by three IR pulses and its dependence on their timing. After a brief discussion of the principles of the measurement of the electric field generated by three IR pulses, the heterodyned echo method is used to examine responses from the single peptide vibrator, N-methyl-acetamide (NMA-d), and a dipeptide, acyl-proline-NH2. The Fourier transform of these echo signals along two experimentally controllable time axes yields the two-dimensional (2D) IR spectra of the peptides from which structural and solvent effects and information about the phases of the contributions that give rise to the signals can be obtained. In addition, spectral interferometry of the free decay of the echo signal is reported for acyl-proline. These results completely characterize the fields generated during the vibrational photon echo and demonstrate all of the weak signal IR analogues of NMR using three pulses.
The Third-Order IR Echo Field
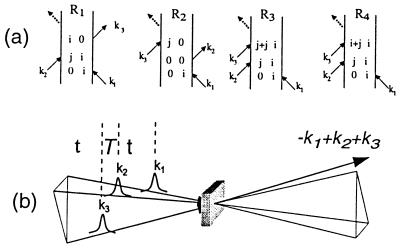
Three phase-locked IR pulses, labeled 1, 2, and 3, and with wavevectors k1, k2, and k3 are incident on the sample at time intervals τ, between 1 and 2, and T, between 2 and 3 (see Fig. 1). They create a polarization P(t;τ,T) in the sample for times t after the third pulse (7). This sample polarization generates an in quadrature electric field E(t;τ,T), the characterization of which is the aim of the current experiments. The IR photon echo emitted in the phase-matched direction −k1+k2+k3 for a system of vibrators involves a number of intermediate coherences or Feynman paths (27). The angle phase matching guarantees the separation of the echo signal from other nonlinear processes. For a pair of structurally inequivalent vibrators a and b, such as in a dipeptide, whose coupling is less than their energy separation, the important paths are shown in Fig. 1. If the transition dipoles of the a and b amide fundamentals are set to unity, the transition dipoles from the one- to the two-particle states, a and b (see Fig. 1), are also unity, and the transitions from v = 1 to v = 2 states of either oscillator have dipoles of length  (1). After averaging over the isotropic angular distribution of transition dipoles and choosing the example T = 0, the complex field generated by impulsive excitation is obtained from the sum of all of the diagrams of Fig. 1 using the notation outlined earlier (27), as follows:
 |
 |
1 |
The fundamental frequencies are ωi, the overtones are at 2ωi − Δi, and the combination tone is at ωa + ωb − Δij. The projection of one of the amide I transition dipoles onto the other is cosθ. Only one of the first set of terms in Eq. 1 is needed for a single oscillator (26). The coupling between amide units comes in through the terms containing the off-diagonal, or mixed mode, anharmonicity Δij, weighted by the angular function. In general, the relaxation functions G(τ,t) will depend on the nature of the dynamics of each of the amide modes including population relaxation, dephasing, orientational relaxation, and spectral diffusion. As seen from the Feynman diagrams the system always contains 0-a or 0-b coherence (0-a represents a coherence between the ground and a-fundamental states) during time τ while during time t it may be transferred into coherences between the fundamental and two-quantum states, or into the a-0 and b-0 coherences. In general, all of these coherences have different dynamics. Some more general forms of the relaxation for vibrators are given in ref. 26.
Figure 1.
(a) Feynmann diagrams for the third-order photon echo signal generated in the −k1+k2+k3 direction. i and j are the states a or b in a two-oscillator model, i + i is an overtone state, and i + j is a combination band. (b) Pulse sequence and geometry used in the generation of the three-pulse photon echo.
In an ideal heterodyne experiment, the signal field interferes on the detector with a short local oscillator field pulse ELO(tLO − t) centered at t = tLO. The slow square law detector integrates the signal over t. The heterodyne signal remaining after subtraction of the local oscillator intensity measures Re{E(τ,tLO)}. Both τ and tLO can be scanned independently. In general, the real generated field consists of sine and cosine parts (i.e., it has a phase) that can be separately measured for a given τ from the real and imaginary parts of the Fourier transform of the signal along the t axis. The complex 2D IR spectrum is obtained from the Fourier transform of the Re{E(τ,t)}, along τ and t, yielding frequency axes Ωτ and Ωt.
Alternatively, a spectral interferogram is obtained when the signal plus local oscillator fields are dispersed in a monochromator, a procedure that amounts to a Fourier transform of the signal along the t axis. After subtraction of the local oscillator spectrum, the interferogram remains as the Fourier transform of Re{E(τ,t)} along the t axis. Assuming that the monochromator is ideal, this approach is more economical because it requires only a scan over τ (rather than t and τ) to obtain the 2D spectrum.
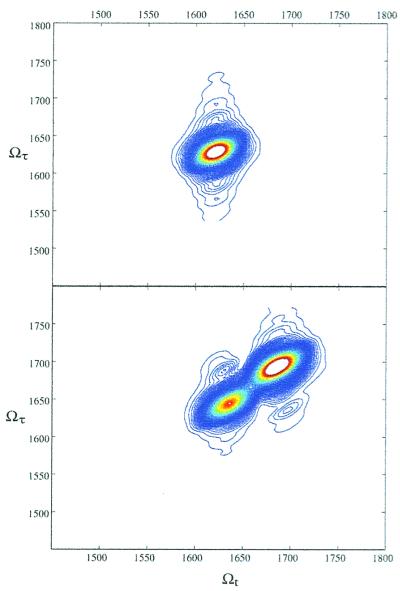
Fig. 2 shows simulations of the signals with parameters typical of peptides. The simulation for a single oscillator is shown in Fig. 2 Upper. In this spectrum, there are peaks, at {Ωτ,Ωt} = {ωi,ωi} and {ωi,ωi − Δi}. When the system consists of two or more vibrators, as in Fig. 2 Lower, two types of peaks arise. The peaks on the diagonal, at {ωi,ωi} and {ωi,ωi − Δ} are from the first sum in Eq. 1 and represent single oscillator spectra. Other types of peaks occur at points {ωi,ωj} and {ωi,ωj − Δij} (i ≠ j), which are cross peak terms from the second sum in Eq. 1. The frequency and intensity of these cross peaks are related to the size of the couplings between the oscillators, which are in turn related to the spatial locations and relative orientations of the vibrators, and hence to the molecular structure.
Figure 2.
Simulations of absolute values of 2D-IR spectra, with a dephasing time of 900 fs, static inhomogeneous broadening of 9.5 cm−1, and an anharmonicity of 16 cm−1. (Upper) The 2D-IR spectrum for a single oscillator such as NMA-d, showing a single diagonal peak. (Lower) The 2D-IR spectrum for two oscillators, with a coupling of 5 cm−1.
Experimental Methods
Femtosecond IR pulses (120-fs duration, 1-μJ energy, 1-kHz repetition rate, 150-cm-1 bandwidth, 1,600-cm-1 center frequency) were generated by mixing the signal and idler pulses from an 800-nm pumped optical parametric amplifier (26) in a AgGaS2 crystal. This beam was split into three equal excitation beams (≈300 nJ each), k1, k2, and k3, and a fourth beam (≈3 nJ), which was used a the local oscillator (LO) beam. The timing of the k1, k3, and LO beams could be varied with a mechanical translation stage with respect to the k2 beam. The signal contains oscillations at the frequencies of the vibrators, which are around 1,600 cm−1, and so have a period of 20 fs. Experimental time steps were kept below 10 fs to completely sample these oscillations. The generated echo emitted in the −k1+k2+k3 direction (see Fig. 1) was combined with the local oscillator field at a calcium fluoride beam splitter. The combined beams were focused onto the slits of a 0.28-m monochromator. Spectral interferometry signals were measured by a 32-element mercury-cadmium-telluride (MCT) array. Heterodyne echo signals were measured by placing a single-channel MCT detector at the exit slits of the monochromator, and rotating the grating to zero order, so that it reflects all frequencies onto the detector. To correct for scattered light, and allow for subtraction of the local oscillator intensity, the k3 beam was chopped at one-half of the laser repetition rate.
NMA-d was made by repeatedly dissolving NMA in D2O, allowing it to equilibrate, and then evaporating the D2O. Acyl-proline-NH2 was used as received from Bachem. Samples were dissolved in D2O or CHCl3 such that the optical density of the amide IR transition was ca. 0.3, and the samples were placed in a cell between CaF2 windows, spaced 25 μm apart.
Results
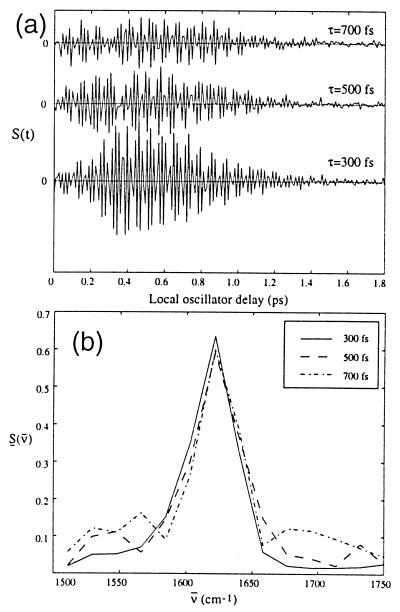
Fig. 3 shows a heterodyne echo scan for NMA-d as a function of the local oscillator delay, for several values of time τ. For all of the measurements discussed in this paper, the time T, the delay between pulses 2 and 3 is set to zero. The variations of signal with T will be discussed in a future publication. The measured signal for finite pulse widths is a convolution of the emitted electric field with the local oscillator field.‡ The observed echo signal is shown in Fig. 3a as a function of the local oscillator delay time, measured with respect to the third laser pulse. The signal shows oscillations with a period of 20 fs, corresponding to the vibrational frequency of 1,620 cm−1. This oscillation has an envelope that is a function of the time t. The Fourier transform of this signal gives the frequency spectrum of the emitted field (see Fig. 3b). This spectrum shows a peak at 1,620 cm−1, the frequency of the amide stretch, and the width of this peak is insensitive to the time τ.
Figure 3.
Heterodyne photon echo signals for NMA-d in D2O at several values of time τ as a function of the time tLO. (a) Time-dependent interferograms of the echo signal. (b) Fourier transforms along the t axis showing the normalized spectra of the signal.
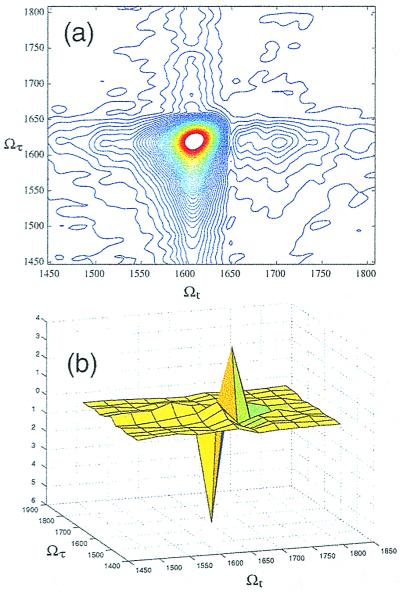
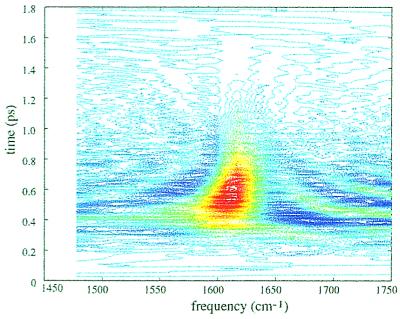
When the time variable τ is varied at fixed tLO, an oscillatory signal also is generated. The complete two-time signal involves scanning over all τ for each possible value of tLO. The Fourier transform, in both time dimensions, of this two-time signal is the complex 2D frequency spectrum (the 2D-IR spectrum). The absolute value of the 2D-IR spectrum for NMA-d is shown in Fig. 4a. NMA-d has only one oscillation in this region of the spectrum, and so we see only one resonance in the 2D-IR spectrum. Fig. 4b shows the real part of the 2D-IR spectrum, corresponding to the real part of the dielectric susceptibility, we see that the v = 0 → v − 1 and v = 1 → v = 2 portions of the spectrum are separated because they have a different sign. Thus we see two peaks with opposite signs in the Ωt direction, but only a single peak in the Ωτ direction. These data also can be examined by plotting the Wigner distribution of the time-dependent signal (see Fig. 5 legend). This distribution is shown in Fig. 5 for NMA-d in D2O, and it shows that there is a time-dependent frequency shift in the echo signal field.
Figure 4.
2D-IR spectra for NMA-d in D2O. (a) The absolute value of the 2D-IR spectrum, showing a single peak in both frequency dimensions. The asymmetry in the signal (compare simulation of Fig. 2) is sensitive to the choice of the center frequency of the laser pulses in relation to the resonances. (b) The real part of the 2D-IR spectrum, showing the fundamental and anharmonically shifted peaks, which have opposite signs.
Figure 5.
A plot of the Wigner distribution for the NMA-d heterodyne echo signal, showing a time-dependent frequency shift in the echo field. For a real signal S(t), the Wigner distribution is defined as w(ν̄, t) = ∫−∞∞ dt′S(t − t′/2)S(t + t′/2)ei2πcν̄t′. The laser pulse shows a chirp-free, symmetric Wigner distribution.
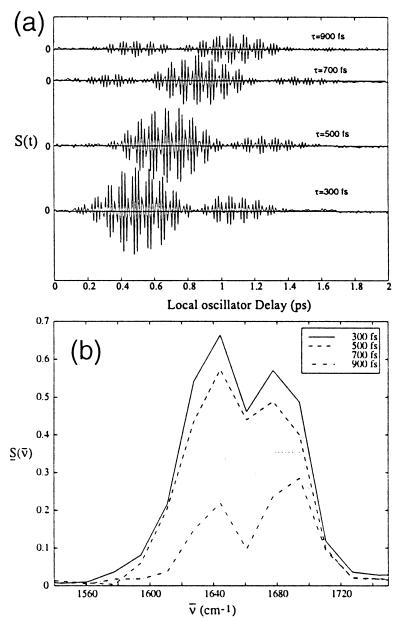
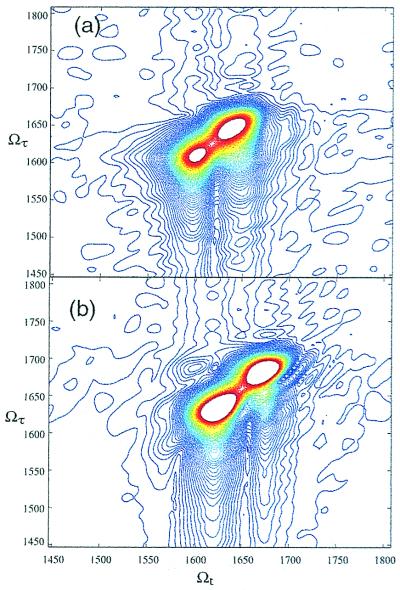
These same experiments have been performed on systems with more than one amide unit. Fig. 6 shows the heterodyne echo signal for the acyl-proline dipeptide in chloroform. Here again there is an oscillation with a period of 20 fs, and also a second lobe, which appears about 1 ps after the first one. This is caused by the interference between the two oscillations at 1,610 cm−1 and 1,645 cm−1. When this signal is Fourier-transformed across the local oscillator delay, we obtain the spectra in Fig. 6b, which show the signals from both of the amide oscillators and their decay as a function of τ. When the data are collected as a function of both of the delays, t and τ, and then Fourier-transformed along both time axes, the complex 2D-IR spectra for the acyl-proline are obtained. Fig. 7 shows the absolute value of these spectra for acyl-proline in D2O and chloroform. The spectra in both solvents show diagonal peaks at the frequencies of the oscillators. The 2D spectrum in chloroform also shows peaks off of the diagonal, in the spectral region where cross peaks are expected as described above. No off-diagonal peaks were seen in the 2D-IR data of acyl-proline in D2O.
Figure 6.
Heterodyne photon echo signals for acyl-proline-NH2 in chloroform at several values of the time τ as a function of time tLO. (a) Time-dependent echo signal and (b) the Fourier transforms showing the spectra of the echo signal.
Figure 7.
2D-IR spectra of acyl-proline-NH2, in (a) D2O, showing diagonal peaks at 1,620 and 1,670 cm−1, and (b) chloroform, which shows similar diagonal peaks, but also off-diagonal peaks. Because of the anharmonicity, the ellipses are not pointing exactly along the diagonal.
Discussion
The origin of the 2D-IR spectrum is exemplified by the case of two vibrators, a and b, separated in frequency by more than their coupling. The initial step, pulse 1, excites the coherent superpositions 0-a and 0-b, which evolve for time τ. In the second step pulses 2 and 3, with T = 0, transfer these coherences into their conjugates, a-0 or b-0, or into superpositions of v = 1 and v = 2 states. If the second step generates the a-0 or b-0 coherence, then the same oscillations will occur along the τ and t axes and therefore the 2D spectra, along Ωτ and Ωt, will be diagonal. If, after initial excitation of the 0-a coherence, the next step produces the mixed mode (two-particle state), an a-peak will appear in Ωτ and a b-peak in Ωt. These cross peaks will only be manifest if the a and b modes are coupled in some way, so the 2D-IR spectrum provides a quantitative measure of this coupling.
The simplest example of these heterodyned spectra is a molecule that has only one mode (say, a) in the spectral region of interest. In this case, the response is a sum of the R1, R2, and R3 terms from Fig. 1. The system responds with a frequency of ωa during the time τ for all of the diagrams, and with frequencies of either ωa via R1 and R2 or ωa − Δa via R3 during the time t. Therefore, the 2D Fourier transform of the total signal will have a single peak in the Ωτ dimension, from the ωa term, but will have two peaks in the Ωt dimension, separated by the anharmonicity Δa. This corresponds to the expectation for NMA-d, which is simulated in Fig. 2 Upper and for which data are shown in Fig. 4. For systems, such as hemoglobin-CO, in which the anharmonicity is large (24 cm−1) compared with the peak width (14 cm−1), it was possible to see the peaks at ωi and ωi − Δi by frequency resolving the photon echoes (28). In the case of NMA-d the two peaks are only visible in the real part of the spectrum (see below) but not in the absolute value of the spectrum. Fig. 4a shows the absolute value of the 2D-IR spectrum of NMA-d. The anharmonicity of 16 cm−1 is not resolved, and the spectrum shows a single peak alone the Ωt axis. Nevertheless the very existence of this third-order echo signal depends on the presence of anharmonicity as can be seen from the first terms in Eq. 1, which would vanish if Δ = 0.
Eq. 1 predicts that the fields at ωa and ωa −Δa should have opposite signs. In a heterodyne measurement, the electric field is measured directly, and so this sign information can be obtained. The measured echo signal, S(t) shown in Fig. 3a is the real part of the complex generated field, E(τ,t) + E*(τ,t). The double Fourier transform of this signal is related to the complex susceptibility, the real part of which is a 2D spectrum, S(Ωτ,Ωt), which exposes the signs of the contributions (Feynman pathways) to the signal. Fig. 4b shows the real part of the 2D-IR spectrum of NMA-d. The sign difference between the two peaks is apparent and assists in the spectral resolution. The two peaks for NMA-d in the Ωt axis are clearly separated by the anharmonicity of 16 cm−1 (see Fig. 4b) although the frequency resolution is inadequate to fully resolve them in a conventional spectrum. Further information about the echo signal can be derived from the Wigner distribution W(V-,t) of the signal (29) shown in Fig. 5. The plot of W(V-,t) shows the time-dependent frequency shift of the signal. In the example of NMA-d the mean frequency of the emitted field is shifting to higher values with increasing t. The signal consists of two peaks, corresponding to the transitions v = 0 → v = 1 at ωi, and v = 1 → v = 2 at ωI − Δi. As time progresses, W(V-,t) at the lower frequency, corresponding to the v = 1 → v = 2 transition, diminishes faster than at the higher frequency, corresponding to the v = 0 → v = 1 transition. This result can be caused by the faster dephasing of the coherence between v = 1 and v = 2 states arising because of the faster population relaxation of v = 2 compared with v = 1. In harmonic systems, the v = 2 state decays twice as fast as the v = 1 state.
For molecules with more than one amide group, the signal is more complex. It now contains a sum of contributions for each oscillator as well as from their coupling, as formulated in Eq. 1. In the case of zero coupling, Δij = 0, the terms in the second sum go to zero, and only diagrams R1, R2, and R3 from Fig. 1 where i = j need to be considered. The signal is then a sum of isolated vibrator signals, which corresponds to the diagonal of the 2D-IR spectrum. The 2D-IR spectrum for acyl-proline in D2O shown in Fig. 7a exhibits this behavior. The data show peaks on the diagonal, at 1,620 and 1,670 cm−1, but no other signals. This result indicates that there is no coupling manifested between the two oscillators. In the case of nonzero coupling, the terms in the second sum in Eq. 1 need to be included. These terms will exhibit oscillations at different frequencies during the different time periods τ and t, and so the 2D-IR spectrum should show off-diagonal peaks at {ωi,ωj} and at {ωi,(ωj − Δij)}. These two peaks have opposite signs, so when Δij is small, they will cancel each other out in the real part of the 2D-IR spectrum. However, when the coupling is large enough, there will be two peaks, with opposite signs. Thus we can tell by the frequency separation of the cross peaks the exact value of the coupling element. The intensity of the cross peaks in the absolute value of the 2D-IR spectrum also enables the measurement of the coupling between the peaks. The data for the acyl-proline molecule chloroform (see Fig. 7b) shows off-diagonal peaks in its absolute value 2D-IR spectrum, as expected for the signature of the coupling between the two oscillators. In CHCl3, acyl-proline-NHMe has an internal hydrogen bond and adopts mainly a C7 structure whereas in D2O the structure is less well defined (30). The electrostatic dipole-dipole coupling between amide units is calculated to be smaller for the C7 structure than for other structures so that the absence of 2D-IR coupling peaks in D2O is possibly due to there being different structures for the -NH2 and -NHMe acylprolines. The separation of the amide vibrational peaks of acyl-proline in CHCl3 is much larger (60 cm−1) than the estimated coupling (≈3 cm−1), a fact that could not be deduced from the linear IR spectrum.
An important feature of photon echo measurements is their spectral line narrowing capability. The generated field arises in general from an inhomogeneous distribution of vibrational frequencies representing the range of chemical environments and structures of the amide groups. Eq. 1 therefore must be averaged over this distribution to obtain the observed field. The effect of this averaging, represented by <…>, is readily seen if the first terms in Eq. 1 are written in the form:
 |
2 |
For simplicity we are assuming the vibrational dephasing is in the motional narrowing limit and that there is a slowly varying, essentially static inhomogeneous distribution of frequencies. In reality the inhomogeneous distribution may be time dependent as in the case of N3- (26) and standard methods have been developed to handle this case also (7).
This result (Eq. 2) shows that the effect of the inhomogeneous distribution of frequencies, ωi, only shows up on the time axis (τ-t), assuming there is no fluctuation of the anharmonicity (28). When the double Fourier transform is performed, the resulting 2D-IR spectrum is broadened by this distribution only along the axis Ωτ = Ωt (the diagonal axis of the 2D-IR spectrum). Along the perpendicular axes, Ωτ = const. − Ωt, the spectrum should show no inhomogeneous broadening and can be optimally resolved.
In the NMA-d 2D-IR spectrum, the signal has similar width in both diagonals, and so static inhomogeneous broadening is absent from this spectrum. As a result the echo field is not noticeably delayed as τ is increased (Fig. 3a). In the spectrum of the acyl-proline, however, the diagonal peaks have an elliptical shape, with their longest axis in the Ωτ = Ωt direction. Along this axis the full inhomogeneous width of the transition is displayed, while in the dimension perpendicular to this, the spectral line is narrowed. In this case the signal is a true echo that is progressively delayed as τ increases (see Fig. 6a). This line narrowing is particularly important because in solution, the amide band will be in general inhomogeneously broadened, which causes peaks in the spectrum to overlap. This line narrowing effect optimizes the resolution of peaks in the 2D spectrum.
The frequency fluctuations of a vibrator depend on its solvent environment. Thus each vibrator should have its own relaxation function G(τ,t), dependent on its spatial location, chemical, and solvent environment. It has been shown in previous work (28) on hemoglobin-CO that the relaxation functions for the different vibrational coherences were the same. This result implies that the inhomogeneity is in the harmonic part of the potential and varies little between the vibrational states. These differences in local perturbations can be measured from the dependence of the echo spectrum on the time τ. Such an experiment measures the effects of dephasing dynamics on each oscillator and on the coupling between them. The spectra for acyl-proline shown in Fig. 6b show the peak at 1,640 cm−1 decays much faster then the peak at 1,680 cm−1. Previous work has suggested that in nonpolar solvent, an internal hydrogen bond forms between the N-terminus end and the acyl CO group (30). The two amide groups are therefore in very different environments, which is clearly signaled by their different dephasing dynamics. Experiments of this type will contribute significantly to obtaining microscopic views of peptide conformational dynamics and spatial aspects of solvent effects.
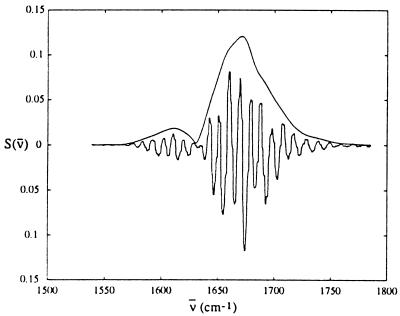
A related technique to the measurement of heterodyned echoes is the measurement of spectral interferometry of the echo signals. Here instead of measuring the frequency integrated signal at a number of local oscillator delay times, the frequency-dependent signal at a single value of the local oscillator delay time is measured by dispersing the signal plus local oscillator fields in a monochromator. The signal after subtracting the intensity spectrum of the local oscillator is then the product of the echo spectrum, the local oscillator spectrum, and an oscillation whose frequency depends on the time delay of the local oscillator relative to the echo field. This interferometric signal is shown in Fig. 8 for acyl-proline. Fourier analysis of the oscillatory part of the signal recovers the spectrum of the echo field as also shown in Fig. 8. This spectrum shows peaks at 1,610 and 1,670 cm−1, the two frequencies of the acyl-proline dipeptide. These measurements provide complementary information to the heterodyne experiments, but allow more rapid data collection, because of the use of the detector array.
Figure 8.
Spectral interferometry of the echo signal for acyl-proline in D2O, with the local oscillator delayed 1.5 ps from the echo signal. Shown are both the measured interferometric signal and the processed signal, which represents the emitted electric field of the echo. This signal shows peaks at 1,610 and 1,670 cm−1 corresponding to the frequencies of the two amide units.
Conclusions
The use of phase-controlled femtosecond IR pulses enables the full measurement of 2D vibrational spectra. These measurements are the direct IR analogues of the multidimensional spectra measured in NMR experiments including multiple quantum transitions. They require phase matching and heterodyne mixing techniques to isolate and measure the electric field of vibrational photon echo signals as a function of three possible time variables. The Fourier transformed 2D-IR spectra provide information on couplings between modes and hence on peptide structures. The experimental time scale is less than a few picoseconds so there is no significant averaging of the signals by any structural dynamics slower than this. Spectra that are free from inhomogeneous broadening were observed for acyl-proline-NH2. On the contrary, the amide transition of NMA-d showed no fixed inhomogeneous distribution of vibrational frequencies, so its inhomogeneous distribution is probably dynamic on the observation time scale. The measurement of the electric field of the echo enables separation of peaks in the real and imaginary parts of the echo spectrum on the basis of their signs, as shown in the 2-D spectrum of NMA-d (Fig. 4b). These methods show great promise for elucidating the dynamics of structures in biology.
Acknowledgments
We thank Drs. P. A. Aufinrud and S. Gnanakavan for helpful comments. This research was supported by the National Institutes of Health and National Science Foundation, a National Institutes of Health postdoctoral fellowship to M.T.Z., and the Research Resource NIHRR-13456.
Abbreviations
- NMA-d
N-methyl-acetamide
- 2D
two-dimensional
- LO
local oscillator
- IR
infrared
Footnotes
Article published online before print: Proc. Natl. Acad. Sci. USA, 10.1073/pnas.140227997.
Article and publication date are at www.pnas.org/cgi/doi/10.1073/pnas.140227997
The convolution of the local oscillator and echo field is defined as: E(τ, tLO) = ∫−∞∞ E (τ, t)ELO(t−tLO)dt.
References
- 1.Hamm P, Lim M, Hochstrasser R M. J Phys Chem B. 1998;102:6123–6138. [Google Scholar]
- 2.Hamm P, Lim M, DeGrado W F, Hochstrasser R M. Proc Natl Acad Sci USA. 1999;96:2036–2041. doi: 10.1073/pnas.96.5.2036. [DOI] [PMC free article] [PubMed] [Google Scholar]
- 3.Hamm P, Lim M, DeGrado W F, Hochstrasser R M. J Phys Chem A. 1999;103:10049–10053. [Google Scholar]
- 4.Zhang W M, Chernyak V, Mukamel S. J Chem Phys. 1999;110:5011–5028. [Google Scholar]
- 5.Munowitz M. Coherence and NMR. New York: Wiley; 1988. [Google Scholar]
- 6.Tanimura Y, Mukamel S. J Chem Phys. 1993;99:9496–9511. [Google Scholar]
- 7.Mukamel S. Principles of Nonlinear Spectroscopy. New York: Oxford Univ. Press; 1995. [Google Scholar]
- 8.Okumura K, Tanimura Y. J Chem Phys. 1997;106:1687–1698. [Google Scholar]
- 9.Okumura K, Tanimura Y. Chem Phys Lett. 1998;295:298–304. [Google Scholar]
- 10.Jimenez R, Mourik F, Yu J Y, Fleming G R. J Phys Chem B. 1997;101:7350–7359. [Google Scholar]
- 11.Leeson D T, Wiersma D A, Fritsch K, Friedrich J. J Chem Phys. 1997;101:6331–6340. [Google Scholar]
- 12.Tominaga K, Yoshihara K. Phys Rev Lett. 1995;74:3061–3064. doi: 10.1103/PhysRevLett.74.3061. [DOI] [PubMed] [Google Scholar]
- 13.Steffen T, Duppen K. Phys Rev Lett. 1996;76:1224–1227. doi: 10.1103/PhysRevLett.76.1224. [DOI] [PubMed] [Google Scholar]
- 14.Steffen T, Fourkas J T, Duppen K. J Chem Phys. 1997;105:7364–7382. [Google Scholar]
- 15.Steffen T, Fourkas J T, Duppen K. J Chem Phys. 1997;106:3854–3864. [Google Scholar]
- 16.Weiss S, Mycek M-A, Bigot J-Y, Schmitt-Rink S, Chemla D S. Phys Rev Lett. 1992;69:2685–2688. doi: 10.1103/PhysRevLett.69.2685. [DOI] [PubMed] [Google Scholar]
- 17.Kim D-S, Shah J, Damen T C, Schäfer W, Jahnke F, Schmitt-Rink S, Köhler K. Phys Rev Lett. 1992;69:2725–2728. doi: 10.1103/PhysRevLett.69.2725. [DOI] [PubMed] [Google Scholar]
- 18.Vohringer P, Arnett D C, Yang T-S, Scherer N F. Chem Phys Lett. 1995;237:387–398. [Google Scholar]
- 19.Pshenichnikov M S, Duppen K, Wiersma D A. Phys Rev Lett. 1995;74:674–677. doi: 10.1103/PhysRevLett.74.674. [DOI] [PubMed] [Google Scholar]
- 20.Boeij W P D, Pshenichnikov M S, Wiersma D A. Chem Phys. 1998;233:287–309. [Google Scholar]
- 21.Goodno G D, Miller R J D. J Phys Chem A. 1999;103:10619–10629. [Google Scholar]
- 22.Goodno G D, Astinov V, Miller R J D. J Phys Chem A. 1999;103:10630–10643. [Google Scholar]
- 23.Gallagher S M, Albrecht A W, Hybl J D, Landin B L, Rajaram B, Jonas D M. J Opt Soc Am B. 1998;15:2338. [Google Scholar]
- 24.Likforman J-P, Joffre M, Thierry-Mieg V. Opt Lett. 1997;22:1104–1106. doi: 10.1364/ol.22.001104. [DOI] [PubMed] [Google Scholar]
- 25.Tokmakoff A, Fayer M D. J Chem Phys. 1995;103:2810–2826. [Google Scholar]
- 26.Hamm P, Lim M, Hochstrasser R M. Phys Rev Lett. 1998;81:5326–5329. [Google Scholar]
- 27.Hamm P, Lim M, DeGrado W F, Hochstrasser R M. J Chem Phys. 2000;112:1907–1916. [Google Scholar]
- 28.Asplund M C, Lim M, Hochstrasser R M. Chem Phys Lett. 2000;323:269–277. [Google Scholar]
- 29.Cohen L. In: Time-Frequency Analysis. Oppenheimer A V, editor. Madison, WI: Prentice–Hall; 1995. p. 113. [Google Scholar]
- 30.Madison V, Kopple K D. J Am Chem Soc. 1980;102:4855–4863. [Google Scholar]


