

Abstract
Background
Glutamine (Gln) may become conditionally indispensable during critical illness. The short-term metabolic effects of enteral versus parenteral Gln supplementation are unknown in this clinical setting.
Objectives
We studied metabolic effects of intravenous (IV) alanyl-Gln dipeptide (AG) supplementation and enteral (EN) AG supplementation on plasma Gln concentration, antioxidant status, plasma lymphocyte subset number, gut permeability and nitrogen balance in adult critically ill patients requiring tube feeding compared to a control group not receiving Gln supplementation.
Methods
In a double-blind, pilot clinical trial, forty-four medical and surgical ICU patients received identical Gln-free tube feedings 24 h/day and were randomized to either isonitrogenous control (n=15), EN AG (n=15) or IV AG (n=14) groups (AG). Twelve patients were discontinued from the study. The goal AG dose was 0.5 g/kg/day. Biochemical and metabolic endpoints were measured at baseline and on day 9 (plasma Gln, antioxidant indices, lymphocyte subsets; serum IGF-1 and IGF binding protein-3; intestinal permeability). Nitrogen balance was determined between study days 6 to 8.
Results
Illness severity indices, clinical demographics, enteral energy and nitrogen intake and major biochemical indices were similar between groups during study. Plasma Gln was higher in the IV AG (565±119 μM, mean±SEM) vs the EN AG (411±27μM) group by day 9 (P=0.039); however, subjects in the IV AG group received a higher dose of AG (IV AG 0.50 versus EN AG 0.32±0.02 g/kg/day; P<0.001). EN AG subjects showed a significant increase in plasma γ-tocopherol levels over time and maintained plasma γ-tocopherol concentrations. There were no differences between groups for plasma concentrations of vitamin C, glutathione, malondialdehyde (MDA), T-lymphocyte subsets, intestinal permeability or nitrogen balance.
Conclusions
This study showed that alanyl-Gln administration by enteral or parenteral routes did not appear to affect antioxidant capacity or oxidative stress markers, T-lymphocyte subset (CD-3, CD-4, CD-8) number, gut barrier function or whole-body protein metabolism compared to unsupplemented ICU patients requiring enteral tube feeding. Enteral Gln appeared to maintain plasma tocopherol levels in this pilot metabolic study.
Keywords: glutamine, enteral nutrition, parenteral nutrition, critical illness
Introduction
Catabolic states are associated with high levels of oxidative stress, body protein wasting, antioxidant depletion, impaired intestinal barrier function and immuno-suppression [1, 2]. Glutamine (Gln) is the most abundant free amino acid in the body [3]. It serves as a major metabolic fuel for rapidly dividing intestinal epithelial cells and lymphocytes and is a precursor for the biosynthesis of glutathione (GSH), one of the major antioxidants in the body [4, 5]. During critical illness, Gln may become conditionally indispensable as evidenced by the fall in plasma and tissue concentration apparently as a result of Gln utilization exceeding endogenous production [5–7]. Previous studies suggest that improved plasma Gln concentrations may be beneficial for patients with critical illnesses to improve GSH biosynthesis in tissues [8], nitrogen balance [9], immune function [10–12], intestinal permeability [13] and the incidence of hospital-acquired infection [9, 11].
Gln at doses up to 40 g/day is known to be safe when administered with enteral or parenteral nutrition (EN or PN, respectively) [7–9,13]; however, it is unclear which route of delivery is superior. There is evidence suggesting that Gln supplementation in PN may be superior to the enteral route in terms of clinical outcomes [11] and repletion of plasma Gln [12]. However, in critically ill patients possessing active intestinal function and receiving EN, whether Gln should be given enterally or parenterally is not clear as data comparing the metabolic effects of intravenous Gln versus enteral Gln in critically ill patients are lacking [14–15]. Therefore, the purposes of this study were to compare metabolic effects of alanyl-Gln given by enteral and parenteral routes versus an unsupplemented control group and to obtain initial data on the potential effects of route of Gln administration. We hypothesized that parenteral administration of alanyl-Gln dipeptide (AG) would result in higher blood concentrations of Gln and would therefore be associated with superior effects on antioxidant status, immune function and nitrogen balance in adult critically ill patients requiring tube feeding.
Patients and methods
Study subjects
This randomized, double-blind, placebo-controlled study was conducted at Emory University Hospital (EUH), Atlanta, GA. This study was approved by the Institutional Review Board of Emory University and the GCRC Scientific Advisory Committee. Study subjects requiring non-elemental tube feeding for at least 8 days were identified by the Nutrition and Metabolic Support Service (NMSS) of EUH, who were consulted on all patients receiving enteral tube feeding at EUH. Additional inclusion criteria included subjects whom were between 18 and 90 years of age and had functional access for enteral tube feeding and central venous access for administration of the test amino acid solutions. Subjects were excluded from analysis in this metabolic study if the subject had any of the following conditions before study entry or developed it during the study period: (1) active uncontrolled infection, (2) uncontrolled congestive heart failure, (3) significant hepatic dysfunction (defined as total bilirubin > 5.0 mg/dl), (4) significant renal dysfunction (demonstrated as clinical/biochemical evidence of evolving acute renal failure or requirement for dialysis therapy), (5) severe metabolic acidosis (venous pH < 7.2), (6) hemodynamic instability (defined as currently requiring two or more vasopressor agents to maintain adequate blood pressure), (7) active GI bleeding or gastric outlet obstruction, (8) history of small intestinal or gastric resection, (9) an operation anticipated or occurred during the 8 day period after study entry; (10) requirement of PN support in addition to enteral feeds; and (11) the subject consumed more than 30% of their caloric and protein goals orally for two consecutive days. Informed consent was obtained from all subjects or their legally authorized representative.
Study procedures
Eligible subjects were assigned by the EUH research pharmacist in a double-blind, block randomization format (generated by the GCRC research statistician) to one of three study groups: control, intravenous Ala-glutamine (IV-AG) and enteral Ala-glutamine (EN-AG) on the basis of APACHE II score at study entry (Figure 1). During the 8-day study period, all subjects received standard polymeric tube feeds (Nutren 1.0®, Ross-Abbot, Columbia, OH) plus intravenous (i.v.) or enteral Gln dipeptide supplementation or placebo. Subjects in the IV-AG group received a continuous 24-hour central venous infusion of 20% L-Ala-L-Gln dipeptide (Dipeptamin®; Fresenius-Kabi, Bad Homberg, Germany) at 0.5 g/kg/day and no additives to the tube feedings. Subjects in the EN-AG group received i.v. normal saline (placebo) plus enteral Ala-Gln powder (Fresenius-Kabi) mixed in the daily tube feedings by the GCRC nutritionist at a daily dose of 0.5 g/kg/day. The control subjects were given intravenous 15% Clinisol® (Baxter, Deerfield, IL) at 0.5 g/kg/day and no additives to the tube feedings. The masked intravenous test solutions were prepared and delivered by the EUH IV pharmacy to the clinical unit. The study enteral feedings were prepared by the GCRC research nutritionist according to the randomization code provided by the research pharmacist and delivered to the clinical unit daily. The study subjects and all other research and clinical personnel were blinded to the randomization.
Figure 1. Study design.
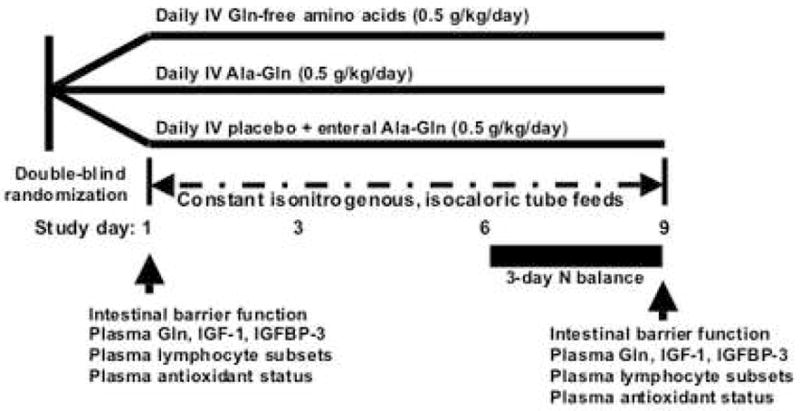
Eligible medical and surgical ICU subjects were assigned in a double-blind, block randomization format to one of three isonitrogenous, isocaloric study groups; control (tube feeds + daily intravenous Gln-free amino acids), intravenous alanyl-Gln dipeptide (IV AG; tube feeds + daily intravenous Gln dipeptide) or enteral alanyl-Gln dipeptide (EN AG; tube feeds + daily enteral Gln dipeptide added to tube feeds). All patients received a standard polymeric tube feeding formula. Block randomization was based on APACHE II illness severity. Major endpoints were determined at baseline and again on study day 9 and nitrogen balance was estimated between study days 6 and 9.
The tube feeding rate in all subjects was calculated to provide energy at 27 kcal/kg/day as Nutren 1.0®. The goal of protein/amino acid provision was targeted at 1.7 g/kg/day (1.2 g/kg/day from the base tube feeding formulation and additional 0.5 g/kg/day from the study amino acid solution). The goal dose of enteral feeds was achieved over a 48 hour period as tolerated. If subjects advanced to consume oral diet, the amount of caloric and protein from oral liquids and foods was recorded (done by NMSS stuff). Subjects who were able to consume more than 30% of their caloric and protein goals via oral diet for two consecutive days were dropped from the study.
Subjects were followed for 9 days; routine serum and plasma laboratory tests were obtained, when necessary, for standard clinical monitoring. At baseline and again at day 9, plasma concentrations of Gln, glutamate (Glu), alanine (Ala), GSH, vitamin C, α-tocopherol, γ-tocopherol, zinc, malondialdehyde (MDA; an index of oxidative stress via lipid peroxidation), glutathione peroxidase (GSHPX), total lymphocyte counts and lymphocyte subsets were measured as was intestinal barrier function to oral lactulose/mannitol. Serum concentrations of insulin- growth factor-1 (IGF-1) and IGF-binding protein-3 (IGF-BP3) were measured as mediators of the action of IGF-1, a major anabolic hormone which is decreased during catabolic illness [16]. A 3-day nitrogen balance study was performed between study days 6 to day 8. Baseline serum C-reactive protein (CRP) concentration was determined as an index of the systemic inflammatory response. Blood samples were saved on ice prior to centrifugation at 3,000 rpm and 4°C for 15 min and stored at −80°C until analysis. Plasma for GSH determination was obtained using heparinized syringes and processed as outlined below.
Blood concentrations of amino acids, IGF-1 and IGF-BP3
At baseline and day 9, morning (0900–1100 hr) venous blood samples were obtained for plasma and serum measures. Plasma Gln, Glu and Ala concentrations were determined by ion exchange chromatography using an amino acid analyzer (Beckman, System 6300) in the Emory University Medical Genetics Core Laboratory, Atlanta, GA. Serum concentrations of IGF-1 and IGF-BP3 were determined using a standard radioimmunoassay kit at the Emory Yerkes National Primate Research Center Core Laboratory.
Indices of antioxidant capacity
Plasma concentrations of GSHPX [17] and MDA [18] were determined enzymatically. Vitamin C concentrations were determined by high performance liquid chromatography (HPLC) [19]. Plasma α- and γ-tocopherol concentrations were measured via reversed-phase HPLC [20]. Plasma zinc concentrations were determined by atomic absorption spectroscopy [21]. The former antioxidant measures were performed in the Antioxidants Research Laboratory of the Jen Meyer USDA Human Nutrition Research Center on Aging (by JBB).
Peripheral lymphocytes and lymphocyte subsets
Plasma was obtained on day 1 and day 9 for total lymphocyte counts (by Coulter counting). Counts of lymphocyte subset counts, including total T-lymphocyte (CD-3), T-helper (CD-4), and T-suppressor (CD-8) cell number were determined by flow cytometry analysis in the Hematology Laboratory of the EUH Department of Pathology.
Determination of plasma GSH concentrations
Plasma GSH concentrations were determined via HPLC following iodoacetic acid and dansyl chloride derivatization as previously described in detail by Jones et al [22].
Intestinal permeability
Previous studies indicate the safety and usefulness of the lactulose/mannitol intestinal permeability test to assess gut function in hospitalized patients [23, 24]. In this study, 10 grams of lactulose and 5 grams mannitol were mixed in 200 ml distilled water. The sugar solution was instilled via the feeding tube over 5 minutes and subject’s urine samples were collected for the subsequent 5 hours. The urinary excretion of lactulose and mannitol were determined using HPLC by Dr. John Meddings (University of Alberta) and the ratio of urinary lactulose and mannitol concentration calculated as the index of intestinal permeability [23, 24].
Nitrogen balance
In order to determine potentially differential effects of parenteral and enteral Gln on whole-body protein metabolism, a three-day nitrogen balance study was conducted from day 6 to day 9. Subjects had three consecutive 24-hour urine samples collected from the morning of day 6 until the morning of day 9. Urinary concentrations of nitrogen, corrected for creatinine, were determined by chemiluminescence (Antek, Inc.) in the GCRC Core Laboratory. Estimated nitrogen balance was calculated as the difference between total nitrogen intake and total nitrogen output in urine. Nitrogen intake was calculated from the nitrogen provided in the actual measured intake of daily tube feeds for each subject, plus the nitrogen delivered via the intravenous control or alanyl-Gln solutions (IV AG group) or via enteral alanyl-Gln in the EN AG group. A correction factor of 3 g nitrogen/day was used in all subjects as an estimate of stool and insensible nitrogen losses. The 3-day cumulative nitrogen balance data was used to calculate the mean daily nitrogen balance for each individual.
Serial illness severity scoring
We used the Sequential Organ Failure Assessment (SOFA) score at baseline and day 9 as the primary index of illness severity over time [25].
Sample size determination
A power analysis using published data from catabolic adult patients receiving Gln-free or Gln-supplemented PN was carried our prior to study initiation to determine the sample size goal. The change in nitrogen balance (7, 9) and change in total lymphocyte counts (10), were used as primary endpoints. The analysis determined that 15 patients per group would provide 80% power to determine the minimal detectable difference of 0.7 g/d (19% change) in nitrogen balance and of 183 cells/μL in total lymphocyte count (55% change) between Gln-supplemented parenteral nutrition and standard nutrition.
Statistical analysis
Data are reported as mean ± SEM and were analyzed by the investigators (ML, KAE and TRZ). One-Sample Kolmogorov-Smirnov Test was used to examine the normality of each variable. One way analysis of variance (ANOVA) was used to compare values between the three treatment groups at baseline and on day 9. Paired sample t-tests were used to examine values from baseline to day 9. A Bonferroni adjustment (P=0.017) was used for the within group comparisons on change for the hypothesis-generating secondary outcomes.
Results
This study was initiated in September 1999. In May 2003, the study was terminated and the data analyzed because study drug was no longer available. Forty-four subjects were enrolled, but 12 of the subjects were discontinued from the study before the day 9 measurements (6 randomized to the control group, 3 to the IV AG group, and 3 to the EN-AG group. Reasons for subject drop-out were: 1) tube-feedings were no longer required or indicated (n=4), subject transferred to other hospital (n=5), development of acute renal failure (n=1), and hemodynamic instability (n=2). As a result, nine subjects were assigned to the control group, 11 to the IV AG group and 12 to the EN AG group.
Baseline characteristics of the 32 subjects who completed follow-up are summarized in Table 1. There were no significant differences in demographics, blood glucose, creatinine and total bilirubin concentrations or illness severity scores among the three treatment groups (p > 0.05). There were no differences between study groups for 1) the number of patients on mechanical ventilation at study end (control 5 of 9; IV-AG 6 of 11 and EN-AG 9 of 12, respectively); 2) the mean change in SOFA score from entry until study end (control -2.3±0.7; IV-AG -2.7±0.7 and EN-AG -1.4±0.8, respectively; or 3) the mean day 9 blood glucose, serum creatinine and serum total bilirubin concentrations, respectively (not shown). There was a modest difference in the day 9 SOFA score between the IV-AG group and the EN-AG groups (control 2.9±0.8, IV-AG 2.2±0.6 and EN-AG 5.2±1.2; p=0.044). However, this difference was attributed to the values from one subject in the EN-AG group, whose SOFA score at entry was 12 and 14 on day 9, and who died 2 days after study completion. There were no other study subject deaths from the entry day until day 28 after entry.
Table 1.
Characteristics of subjects at study entry
| Control (n=9) | IV AG (n=11) | EN AG (n=12) | |
|---|---|---|---|
| Age (yr) | 61.2±4.8 | 58.8±4.6 | 59.3±4.0 |
| Gender (M/F) | 5/4 | 6/5 | 8/4 |
| BMI | 27.2±1.7 | 24.3±1.9 | 28.0±2.8 |
| Pre-study days in ICU (days) | 16±5 | 8±1 | 14±3 |
| Patients on mechanical ventilation (#) | 9 | 10 | 12 |
| Serum CRP (mg/dL) | 15 ±4 | 13 ±2 | 13 ±3 |
| Serum total bilirubin (mg/dL) | 1.8±0.7 | 0.5±0.1 | 1.1±0.1 |
| Serum creatinine (mg/dL) | 0.9±0.1 | 0.8±0.1 | 1.1±0.2 |
| Blood glucose (mg/dL) | 136±11 | 135±8 | 135±10 |
| APACHE II score | 12.1±2.0 | 14.3±1.4 | 14.8±1.9 |
| SOFA score | 5.2±0.7 | 4.9±0.6 | 6.6±1.1 |
| Diagnosis | |||
| Cardiovascular dysfunction and surgery | 3 | 2 | 4 |
| Cerebrovascular accident | 2 | 4 | 4 |
| Pancreatitis | 2 | 1 | 0 |
| Respiratory dysfunction and infection | 1 | 3 | 2 |
| Other | 1 | 1 | 2 |
Data as mean ± SEM; NS for all comparisons between groups.
Subjects in the three treatment groups received a similar amount of calories and protein from tube feedings during the 8-day metabolic study period (Table 2). The actual delivered tube feeding kcal intake in all groups was about 70–75% of the initial kcal goal per kg/day, given well-known factors that led to temporary tube feeding discontinuation in ICU patients (e.g. GI intolerance, nil per os for diagnostic tests or therapeutic interventions etc.). The subjects in the IV AG group received the goal dose of AG (0.50 g/kg/day); however, the mean alanyl-Gln dose delivered in the EN AG group was less (0.32±0.02 g/kg/day, p<0.001 vs IV AG group), as AG was mixed daily into the enteral tube feeding administration bag (Table 2). Clinical outcomes (not endpoints of the study) and major conventional blood laboratory indices were also similar among the three groups during the study period (Table 2). In addition, plasma ammonia (not shown) and serum CRP concentrations were similar between treatment groups (Table 1).
Table 2.
Clinical and nutritional indices during 8-day study period
| Control | IV AG | EN AG | |
|---|---|---|---|
| Study tube feeding kcal intake (kcal/day) | 1468±84 | 1527±105 | 1363±103 |
| Study tube feeding kcal intake (kcal/kg/day) | 20.0±1.6 | 20.1±1.7 | 18.1±1.3 |
| Study tube feeding protein intake (g/day) | 59±3 | 61±4 | 55±4 |
| Study tube feeding protein intake (g/kg/day) | 0.79±0.06 | 0.82±0.07 | 0.73±0.05 |
| Study alanyl-Gln intake (g/kg/day) | - | 0.50 | 0.32±0.02* |
| Days on ventilator | 6±1 | 5±1 | 6±1 |
| ICU days | 6.9±0.9 | 7.6±0.7 | 8.1±0.4 |
| ARDS incidence (n) | 0 | 0 | 1 |
| Antibiotic days | 12±3 | 13±3 | 15±3 |
| Diarrhea days | 2.5±0.9 | 1.4±0.4 | 1.4±0.5 |
| Mean glucose (mg/dL) | 145±9 | 143±6 | 145±12 |
| Mean BUN (mg/dL) | 32.7±6.3 | 26.8±2.6 | 34±5.1 |
| Mean creatinine (mg/dL) | 0.8±0.1 | 0.7±0.1 | 1.0±0.1 |
| Mean total bilirubin (mg/dL) | 1.7±0.8 | 0.7±0.1 | 0.9±0.2 |
| Mean SGOT (U/L) | 64±20 | 65±20 | 53±10 |
| Mean SGPT (U/L) | 50±11 | 73±34 | 58±27 |
| White blood cell count (103/μL) | 14.4±1.6 | 15.8±1.2 | 12.9±1.3 |
Data as mean ± SEM;
p=0.001 IV AG versus EN AG.
At baseline, plasma Gln concentrations were low in all study subjects (Figure 2) consistent with catabolic stress, compared with normal values of 550–800 μM [3]. After 8 days of treatment, plasma Gln concentrations were higher in IV AG group compared to the control and EN-AG groups, who did not receive intravenous Gln (Figure 2, p=0.039). The plasma concentrations of Glu and Ala were within the normal ranges and were similar between the three groups at baseline (Glu: control: 97 ± 24, IV AG: 81 ± 25, EN AG: 83 ± 15 μM; Ala: control: 209 ± 30, IV-AG: 215 ± 20, EN AG: 223 ± 31 μM). The concentrations of Glu and Ala were not changed from baseline to day 9 (data not shown). IGF-1 concentrations were similar and below normal between groups at baseline and were unchanged at day 9 (not significant between groups). Compared with baseline values, subjects in the control group showed a minor increase in serum IGFBP-3 concentrations at day 9 (baseline 1005±190 verse day 9 1255±176 ng/mL; p=0.046), whereas values in the Gln groups were unchanged over time.
Figure 2. Plasma glutamine concentrations.
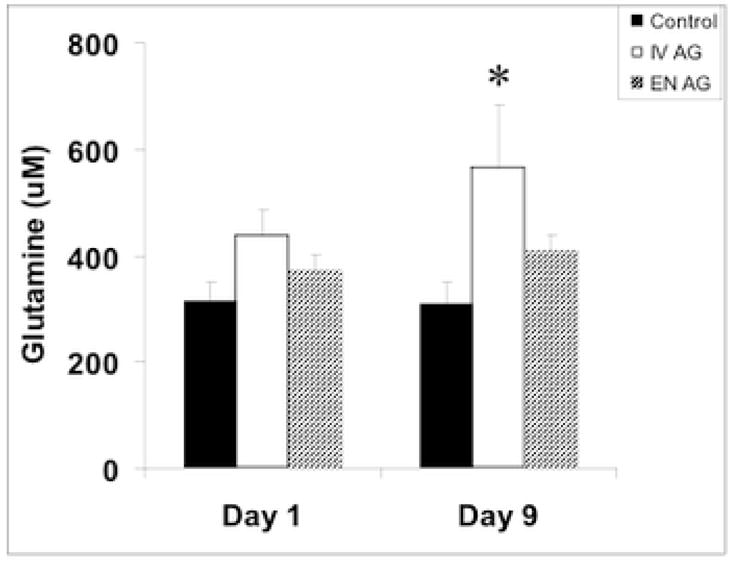
Plasma glutamine concentrations were higher in the IV AG group versus the control and EN-AG groups after 8 days of treatment. * p=0.039 versus baseline values.
Plasma antioxidant indices in the three treatment groups were similar at baseline (Figure 3). The concentrations of MDA, vitamin C and GSH were unaltered with any of the three metabolic treatments at day 9. However, GSHPX concentrations were decreased in EN AG group at this timepoint (p=0.032). Enteral Ala-Gln was associated with improved plasma γ-tocopherol levels (p=0.019) and maintained γ-tocopherol levels at day 9 compared to baseline values (Figure 3). In contrast, in the control and IV AG groups, plasma γ-tocopherol levels were unchanged but plasma γ-tocopherol levels were decreased at day 9 compared to baseline (IV AG: p=0.024; control: p=0.011) (Figure 3). Zinc concentrations were significantly improved in control subjects (p= 0.049) and in subjects receiving intravenous AG (p=0.006).
Figure 3. Plasma indices of antioxidant capacity.
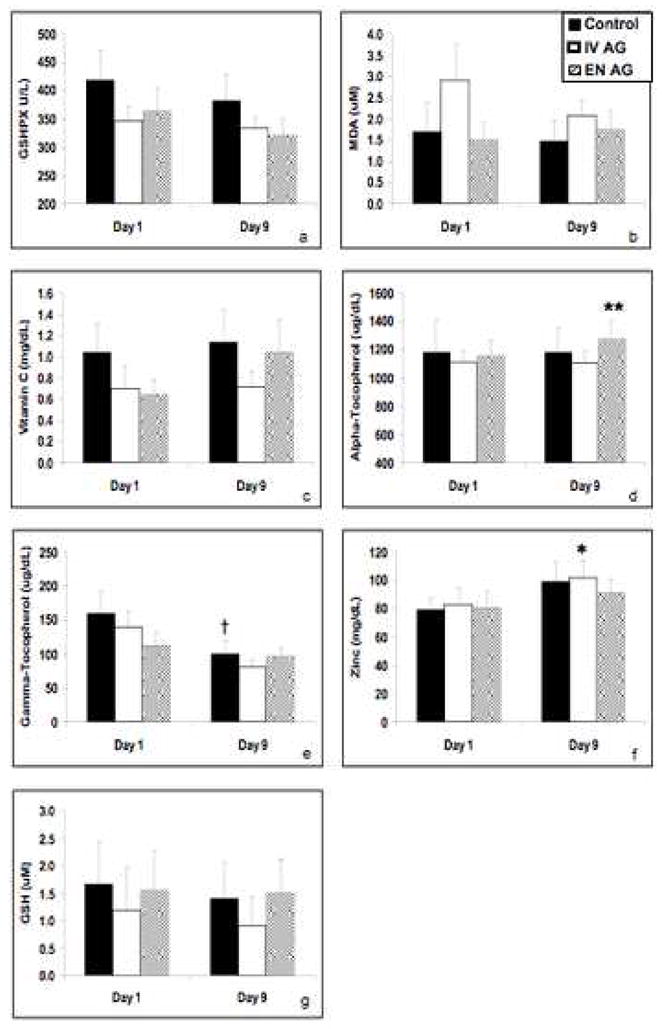
Compared with the baseline values, plasma glutathione peroxidase GSHPX was decreased in the enteral alanyl-Gln group (panel a). However, enteral alanyl-Gln supplementation increased plasma α-tocopherol concentrations (panel d) and maintained plasma γ-tocopherol concentrations (panel e), compared to the other two study groups, in which no change in plasma α-tocopherol or a fall γ-tocopherol occurred. Plasma zinc concentrations were increased from baseline to day 9 in the control group and IV alanyl-Gln group, while no change was observed in the enteral AG group (panel f). Plasma GSH concentrations remained unchanged among the three treatment groups (panel g). * p=0.049; ** p=0.019; † p=0.011 versus baseline values.
The plasma lymphocyte profile data is summarized in Table 3. On day 1, subjects in the IV AG group exhibited higher levels of total lymphocytes, CD-3 and CD-8 lymphocyte subsets versus the EN AG group. On day 9 total lymphocyte count number, CD-3, CD-4 and CD-8 lymphocyte counts were similar between groups and no change over time occurred within any of the three study groups. However, the mean total lymphocyte count did increase between days 1 and 9 by approximately 200 cells/μL in the EN AG group.
Table 3.
Lymphocyte subsets at baseline and day 9
| Day 1 | Day 9 | |||||
|---|---|---|---|---|---|---|
| Control (n=9) | IV AG (n=8) | EN AG (n=9) | Control (n=8) | IV AG (n=9) | EN AG (n=9) | |
| Total lymphocyte count (#) | 1493±140 | 1603±171 * | 931±143 | 1326±186 | 1460±210 | 1135±174 |
| CD-3 (#) | 795±125 | 1183±168 ** | 681±118 | 831±153 | 1096±212 | 813±148 |
| CD-4 (#) | 549±80 | 857±147 | 494±87 | 559±101 | 902±225 | 568±109 |
| CD-8 (#) | 190±41 | 457±95 † | 176±42 | 252±58 | 533±169 | 231±58 |
Data as mean ± SEM;
p=0.009;
p=0.044;
p=0.007 versus control and EN-AG group by ANOVA. CD-3= total T-lymphocytes; CD-4 = total helper T-lymphocytes; CD-8= total suppressor T-lymphocytes.
Intestinal barrier function estimated by the intestinal permeability to lactulose/mannitol was not changed from baseline to day 9. Compared with control group, neither intravenous nor enteral AG altered intestinal permeability during the 8-day supplementation period (data not shown). Negative nitrogen balance occurred in the subjects in the three treatment groups (control: −6.90 ± 1.75, IV AG: −6.42 ± 2.03 and EN AG: −5.33 ± 1.66 g/day, respectively). Although the subjects in the EN AG group showed a tendency for less net body nitrogen loss, this was not statistically significant versus the other groups. Thus, estimated nitrogen balance was unaltered by intravenous or enteral AG (p > 0.05) during the 3-day period of measurement in this short-term metabolic study.
Discussion
Little data are available comparing the metabolic effects of Gln when given by enteral versus parenteral routes (14, 26). Also, metabolic results with enteral Gln administration have been inconsistent across studies (27, 28). The current study is the first to directly compare whether intravenous AG was superior to enteral AG in terms of short-term metabolic endpoints in tube-fed ICU patients. Consistent with previous findings [6, 11, 12], we observed below-normal baseline plasma Gln concentrations in these critically ill patients. The plasma Gln concentrations were 30% higher compared to baseline values in individuals receiving intravenous AG compared to patients receiving enteral tube feeding supplemented with AG or control unsupplemented tube feeding a after 8-days of supplementation. This difference with regard to the IV AG and EN AG groups could possibly be explained by the different mean dose of AG between these supplemented groups. However, despite supplementation of tube feeds with Gln (0.32±0.02 g/kg/d), the plasma Gln concentration was unchanged in this group, possibly due to splanchnic bed Gln metabolism [29]. These data suggest that higher enteral doses of Gln are needed to increase plasma Gln concentrations in some ICU patients.
Several previous studies indicate that Gln supplemented parenteral nutrition improves nitrogen balance in catabolic patients [7, 9], but no study, to our knowledge, has evaluated nitrogen balance with different routes of Gln administration versus a control group. Subjects in the current study exhibited marked negative nitrogen balance between study days 6–9. This net body nitrogen loss reflects the protein-catabolic nature of the underlying critical illnesses, as well as probable underfeeding as a function of actual metabolic needs for energy and protein in the study subjects. However, this level of enteral nutrition is typical of what is achieved in ICU settings. In this metabolic milieu, no differences in nitrogen balance between treatment groups occurred although the enteral AG group tended to have less nitrogen loss. Further, AG given by either route did not affect serum IGF-1 or IGF-BP3 levels, which mediate protein-anabolic processes in critical illness [16, 30]. Thus, an important finding of our study is that short-term (8-day) Gln dipeptide administration (0.33 to 0.5 g/kg/day) by either enteral or parenteral routes did not attenuate body nitrogen loss in these clinically well-matched, catabolic patients requiring tube feeding. A post-hoc power analysis (by KAE) shows that we were underpowered to detect a 4 g/day difference in nitrogen balance between groups, which would require 30 subjects per group. However, this pilot trial provides useful hypothesis-generating data for planning of subsequent studies of Gln supplementation in ICU patients.
Gln may increase immune cell number and/or improve immune cell function as this amino acid is utilized as a major fuel substrate by immune cells [5, 10, 11, 31, 32]. However, in the current study neither enteral nor parenteral alanyl-Gln supplementation given for 8 days altered circulating total lymphocyte cell number or total T-lymphocytes (CD-3), helper CD-4 cells or suppressor CD-8 cell number subsets. A post-hoc power calculation, based on the changes of total lymphocyte count we observed from day 1 to day 9, suggest a need for 20 patients per group to detect mean change differences between groups of 300 cells/μL (80% power, alpha =0.05). Ten patients per group ensure 75% power to detect mean change differences between groups of 400 cells/μl (80% power, alpha = 0.05). Therefore, this pilot trial had a reasonable chance of detecting a mean change difference of 400 cells/μL between the control group and IV AG group. It is possible that the lack of Gln effects on lymphocyte subsets were due to the immunosuppressive effects of the underlying illness and the short-term nature of the serial measurements, as adaptive immune functions such as changes in lymphocyte number likely take several weeks to develop. Data on long term enteral versus parenteral Gln effects on responses to systemic inflammation, such as circulating or tissue cytokines, would also be of interest [33–34].
Numerous animal studies and a few studies in catabolic patients have shown that enteral Gln improves gut barrier function as measured by bacterial translocation in animals [35] and gut permeability to sugar markers in humans [13]. In the current study, the lactulose/mannitol urinary excretion ratio was approximately twice as high as in a group of 10 healthy controls in our laboratory (not shown), but was unaffected by Gln dipeptide administration by either route.
Catabolic illnesses are commonly associated with oxidative stress and decreased antioxidant capacity [15, 21, 36–38]. Gln supplementation has been shown to improve tissue and blood GSH concentration in animal models of critical illness, possibly by serving as a precursor to glutamate, a constituent of the tripeptide GSH [35]. In this study, there were no differences in concentrations of plasma GSH, vitamin C or MDA (an index of lipid peroxidation) over time. Of interest, both the control and the IV AG groups exhibited an increase in plasma zinc levels compared to the EN AG group. Although little data on Gln-zinc nutritional interactions are available, one study showed that binary PN solutions containing glucose and amino acids significantly increased zinc uptake by fibroblasts in vitro [39]. Thus, it is possible that enteral versus parenteral Gln differentially affects zinc utilization by intestinal fibroblasts, as a possible mechanism for the differences in serum zinc levels observed between groups. Enterally administered Gln dipeptide was associated with significantly improved plasma α-tocopherol levels and maintained γ-tocopherol levels at day 9 compared to baseline. The mechanisms underlying this effect are unclear at this time. Of note, a recent study in rats showed that enteral Gln promote triglyceride absorption and lymphatic fat transport [40], effects which theoretically may facilitate fat-soluble tocopherol absorption and represent a potential mechanism for this effect of enteral Gln.
Limitations of the current study design include the small sample size, 25% dropout rate and low power to detect potentially important between group differences in mean change in lymphocyte count or nitrogen balance differences. We designed this metabolic study to focus largely on changes in endpoints from baseline to day 9 and not on clinical outcomes. Nonetheless, the drop-out rate (represented by individuals whom did not complete day 9 measures) could introduce possible selection bias as an additional limitation. However, these pilot data provide important estimates of the standard deviation for the study outcomes (both within- and between-patient estimates of the standard deviation) for planning future studies. Other limitations include subject heterogeneity in terms of primary diagnosis, and the modestly lower dose of Gln received in the enteral versus parenteral Gln-supplemented groups. The blinded nature of the study prevented adjustment of enteral Gln dosing as a function of tube feeding tolerance during the course of the study. The inclusion of the control group allowed us to compare effects of both enteral and parenteral Gln supplementation against control subjects who did not receive any Gln supplementation. Because of the small sample size, we could not perform statistical analysis by grouping the patient population as a function of primary diagnosis. It is certainly possible that longer periods of Gln supplementation and endpoint determination are needed to detect metabolic (or clinical) effects of enteral versus parenteral Gln administration may be needed.
Conclusions
In this pilot study, intravenous alanyl-Gln appears to be superior to enteral alanyl-Gln administration as a method to increase systemic plasma Gln concentrations in catabolic ICU patients. Enteral Gln also appeared to maintain plasma α- and γ-tocopherol levels in these individuals. Route of Gln administration otherwise did not appear to differentially effect antioxidant capacity or oxidative stress markers, T-lymphocyte subsets, intestinal permeability, IGF-1 levels or nitrogen balance. However, given the small sample size and the relatively lower dose of Gln provided enterally versus parenterally, this study should be considered hypothesis-generating to inform subsequent studies on the effects of route of Gln administration in critically ill patients.
Acknowledgments
The authors thank the Emory GCRC research staff, the Emory University Hospital ICU nurses and Ms. Susan Rogers of the Emory University Hospital Investigational Drug Service for their help with the protocol. The authors gratefully acknowledge Ewald Schlotzer, PhD, of Fresenus-Kabi, and Carolyn Accardi and Nisha Dave for their assistance. This study was supported by NIH R03 DK54823, Emory General Clinical Research Center M01 RR00039, a grant from Fresenius-Kabi, and a grant from the American College of Gastroenterology (to TRZ) and USDA Agricultural Research Service Cooperative Agreement 58–1950–4–40 (to JBB). None of the study sponsors played a role in the study design, in the collection, analysis and interpretation of data; in the writing of the manuscript; and in the decision to submit the manuscript for publication. Authors NB, DPG, CFE, NMD, LH, and JRG carried out the studies; ML, KE and TRZ performed data analyses and drafted the manuscript; JBM, JBB, DPJ and LH carried out the sample analyses; DPG, LML, DPJ and TRZ participated in the design of the study; ML and TRZ performed the statistical analysis. All authors read and approved the final manuscript.
Footnotes
Publisher's Disclaimer: This is a PDF file of an unedited manuscript that has been accepted for publication. As a service to our customers we are providing this early version of the manuscript. The manuscript will undergo copyediting, typesetting, and review of the resulting proof before it is published in its final citable form. Please note that during the production process errors may be discovered which could affect the content, and all legal disclaimers that apply to the journal pertain.
References
- 1.Debaveye Y, Van den Berghe G. Risks and benefits of nutritional support during critical illness. Annu Rev Nutr. 2006;26:513–538. doi: 10.1146/annurev.nutr.26.061505.111307. [DOI] [PubMed] [Google Scholar]
- 2.Crimi E, Sica V, Williams-Ignarro S, Zhang H, Slutsky AS, Ignarro LJ, et al. The role of oxidative stress in adult critical care. Free Radic Biol Med. 2006;40:398–406. doi: 10.1016/j.freeradbiomed.2005.10.054. [DOI] [PubMed] [Google Scholar]
- 3.Bergstrom J, Furst P, Noree LO, Vinnars E. Intracellular free amino acid concentration in human muscle tissue. J Appl Physiol. 1974;36:693–697. doi: 10.1152/jappl.1974.36.6.693. [DOI] [PubMed] [Google Scholar]
- 4.Boelens PG, Nijveldt RJ, Houdijk AP, Meijer S, van Leeuwen PA. Glutamine alimentation in catabolic states. J Nutr. 2001;131:2569S–2577S. doi: 10.1093/jn/131.9.2569S. [DOI] [PubMed] [Google Scholar]
- 5.Wischmeyer PE. The glutamine story: where are we now? Curr Opin Crit Care. 2006;12:142–148. doi: 10.1097/01.ccx.0000216582.87674.a4. [DOI] [PubMed] [Google Scholar]
- 6.Jackson NC, Carroll PV, Russell-Jones DL, Sonksen PH, Treacher DF, Umpleby AM. The metabolic consequences of critical illness: acute effects on glutamine and protein metabolism. Am J Physiol. 1999;276:E163–170. doi: 10.1152/ajpendo.1999.276.1.E163. [DOI] [PubMed] [Google Scholar]
- 7.Stehle P, Zander J, Mertes N, Albers S, Puchstein C, Lawin P, et al. Effect of parenteral glutamine peptide supplements on muscle glutamine loss and nitrogen balance after major surgery. Lancet. 1989;1:231–233. doi: 10.1016/s0140-6736(89)91254-3. [DOI] [PubMed] [Google Scholar]
- 8.Flaring UB, Rooyackers OE, Wernerman J, Hammarqvist F. Glutamine attenuates post-traumatic glutathione depletion in human muscle. Clin Sci. 2003;104:275–282. doi: 10.1042/CS20020198. [DOI] [PubMed] [Google Scholar]
- 9.Ziegler TR, Young LS, Benfell K, Scheltinga M, Hortos K, Bye R, et al. Clinical and metabolic efficacy of glutamine-supplemented parenteral nutrition after bone marrow transplantation. A randomized, double-blind, controlled study. Ann Intern Med. 1992;116:821–828. doi: 10.7326/0003-4819-116-10-821. [DOI] [PubMed] [Google Scholar]
- 10.Ziegler TR, Bye RL, Persinger RL, Young LS, Antin JH, Wilmore DW. Effects of glutamine supplementation on circulating lymphocytes after bone marrow transplantation: a pilot study. Am J Med Sci. 1998;315:4–10. doi: 10.1097/00000441-199801000-00002. [DOI] [PubMed] [Google Scholar]
- 11.Novak F, Heyland DK, Avenell A, Drover JW, Su X. Glutamine supplementation in serious illness: a systematic review of the evidence. Crit Care Med. 2002;30:2022–2029. doi: 10.1097/00003246-200209000-00011. [DOI] [PubMed] [Google Scholar]
- 12.Long CL, Borghesi L, Stahl R, Clark JA, Geiger JW, DiRienzo DB, et al. Impact of enteral feeding of a glutamine-supplemented formula on the hypoaminoacidemic response in trauma patients. J Trauma. 1996;40:97–102. doi: 10.1097/00005373-199601000-00018. [DOI] [PubMed] [Google Scholar]
- 13.Zhou YP, Jiang ZM, Sun YH, Wang XR, Ma EL, Wilmore D. The effect of supplemental enteral glutamine on plasma levels, gut function, and outcome in severe burns: a randomized, double-blind, controlled clinical trial. JPEN. 2003;27:241–245. doi: 10.1177/0148607103027004241. [DOI] [PubMed] [Google Scholar]
- 14.Melis GC, Boelens PG, van der Sijp JR, Popovici T, De Bandt JP, Cynober L, et al. The feeding route (enteral or parenteral) affects the plasma response of the dipetide Ala-Gln and the amino acids glutamine, citrulline and arginine, with the administration of Ala-Gln in preoperative patients. Br J Nutr. 2005;94:19–26. doi: 10.1079/bjn20051463. [DOI] [PubMed] [Google Scholar]
- 15.Dhaliwal R, Heyland DK. Nutrition and infection in the intensive care unit: what does the evidence show? Curr Opin Crit Care. 2005;11:461–467. doi: 10.1097/01.ccx.0000176693.85260.cd. [DOI] [PubMed] [Google Scholar]
- 16.Timmins AC, Cotterill AM, Hughes SC, Holly JM, Ross RJ, Blum W, et al. Critical illness is associated with low circulating concentrations of insulin-like growth factors-I and -II, alterations in insulin-like growth factor binding proteins, and induction of an insulin-like growth factor binding protein 3 protease. Crit Care Med. 1996;24:1460–1466. doi: 10.1097/00003246-199609000-00006. [DOI] [PubMed] [Google Scholar]
- 17.Paglia DE, Valentine WN. Studies on the quantitative and qualitative characterization of erythrocyte glutathione peroxidase. J Lab Clin Med. 1967;70:158–169. [PubMed] [Google Scholar]
- 18.Lash LH, Hagen TM, Jones DP. Exogenous glutathione protects intestinal epithelial cells from oxidative injury. Proc Natl Acad Sci. 1986;83:4641–4645. doi: 10.1073/pnas.83.13.4641. [DOI] [PMC free article] [PubMed] [Google Scholar]
- 19.Behrens WA, Madere R. A highly sensitive high-performance liquid chromatography method for the estimation of ascorbic and dehydroascorbic acid in tissues, biological fluids, and foods. Anal Biochem. 1987;165:102–107. doi: 10.1016/0003-2697(87)90206-5. [DOI] [PubMed] [Google Scholar]
- 20.Bieri JG, Tolliver TJ, Catignani GL. Simultaneous determination of alpha-tocopherol and retinol in plasma or red cells by high pressure liquid chromatography. Am J Clin Nutr. 1979;32:2143–2149. doi: 10.1093/ajcn/32.10.2143. [DOI] [PubMed] [Google Scholar]
- 21.Jonas CR, Puckett AB, Jones DP, Griffith DP, Szeszycki EE, Bergman GF, et al. Plasma antioxidant status after high-dose chemotherapy: a randomized trial of parenteral nutrition in bone marrow transplantation patients. Am J Clin Nutr. 2000;72:181–189. doi: 10.1093/ajcn/72.1.181. [DOI] [PubMed] [Google Scholar]
- 22.Jones DP, Carlson JL, Samiec PS, Sternberg P, Jr, Mody VC, Jr, Reed RL, et al. Glutathione measurement in human plasma. Evaluation of sample collection, storage and derivatization conditions for analysis of dansyl derivatives by HPLC. Clin Chim Acta. 1998;275:175–184. doi: 10.1016/s0009-8981(98)00089-8. [DOI] [PubMed] [Google Scholar]
- 23.Ziegler TR, Smith RJ, O’Dwyer ST, Demling RH, Wilmore DW. Increased intestinal permeability associated with infection in burn patients. Arch Surg. 1988;123:1313–1319. doi: 10.1001/archsurg.1988.01400350027003. [DOI] [PubMed] [Google Scholar]
- 24.Bjarnason I, MacPherson A, Hollander D. Intestinal permeability: an overview. Gastroenterology. 1995;108:1566–1581. doi: 10.1016/0016-5085(95)90708-4. [DOI] [PubMed] [Google Scholar]
- 25.Ferreira FL, Bota DP, Bross A, Mélot C, Vincent JL. Serial evaluation of the SOFA score to predict outcome in critically ill patients. JAMA. 2001;286:1754–1758. doi: 10.1001/jama.286.14.1754. [DOI] [PubMed] [Google Scholar]
- 26.Fish J, Sporay G, Beyer K, Jones J, Kihara T, Kennedy A, et al. A prospective randomized study of glutamine-enriched parenteral compared with enteral feeding in postoperative patients. Am J Clin Nutr. 1997;65:977–983. doi: 10.1093/ajcn/65.4.977. [DOI] [PubMed] [Google Scholar]
- 27.Houdijk AP, Rijnsburger ER, Jansen J, Wesdorp RI, Weiss JK, McCamish MA, et al. Randomized trial of glutamine-enriched enteral nutrition on infectious morbidity in patients with multiple trauma. Lancet. 1998;352:772–776. doi: 10.1016/S0140-6736(98)02007-8. [DOI] [PubMed] [Google Scholar]
- 28.Alpers DH. Glutamine: do the data support the cause for glutamine supplementation in humans? Gastroenterology. 2006;130(2 Suppl 1):S106–116. doi: 10.1053/j.gastro.2005.11.049. [DOI] [PubMed] [Google Scholar]
- 29.Haisch M, Fukagawa NK, Matthews DE. Oxidation of glutamine by the splanchnic bed in humans. Am J Physiol Endocrinol Metab. 2000;278:E593–602. doi: 10.1152/ajpendo.2000.278.4.E593. [DOI] [PubMed] [Google Scholar]
- 30.Gibson FAM, Hinds CJ. Growth hormone and insulin- like growth factors in critical illness. Intensive Care Medicine. 1997;23:369–378. doi: 10.1007/s001340050343. [DOI] [PubMed] [Google Scholar]
- 31.Boelens PG, Houdijk AP, Fonk JC, Nijveldt RJ, Ferwerda CC, Von Blomberg-Van Der Flier BM, et al. Glutamine-enriched enteral nutrition increases HLA-DR expression on monocytes of trauma patients. J Nutr. 2002;132:2580–2586. doi: 10.1093/jn/132.9.2580. [DOI] [PubMed] [Google Scholar]
- 32.Manhart N, Vierlinger K, Spittler A, Bergmeister H, Sautner T, Roth E. Oral feeding with glutamine prevents lymphocyte and glutathione depletion of Peyer’s patches in endotoxemic mice. Ann Surg. 2001;234:92–97. doi: 10.1097/00000658-200107000-00014. [DOI] [PMC free article] [PubMed] [Google Scholar]
- 33.Coeffier M, Marion R, Leplingard A, Lerebours E, Ducrotte P, Dechelotte P. Glutamine decreases interleukin-8 and interleukin-6 but not nitric oxide and prostaglandins e(2) production by human gut in-vitro. Cytokine. 2002;18:92–97. doi: 10.1006/cyto.2002.1027. [DOI] [PubMed] [Google Scholar]
- 34.Boelens PG, Houdijk APJ, Fonk JCM, Puyana JC, Haarman HJTM, von Blomberg-van der Flier BME, et al. Glutamine-enriched enteral nutrition increases in vitro interferon-gamma production but does not influence the in vivo specific antibody response to KLH after severe trauma. A prospective, double blind, randomized clinical study. Clinical Nutrition. 2004;23:391–400. doi: 10.1016/j.clnu.2003.09.002. [DOI] [PubMed] [Google Scholar]
- 35.Ziegler TR, Evans ME, Fernandez-Estívariz C, Jones DP. Trophic and cytoprotective nutrition for intestinal adaptation, mucosal repair and barrier function. Ann Rev Nutr. 2003;23:229–261. doi: 10.1146/annurev.nutr.23.011702.073036. [DOI] [PubMed] [Google Scholar]
- 36.Flaring UB, Rooyackers OE, Hebert C, Bratel T, Hammarqvist F, Wernerman J. Temporal changes in whole-blood and plasma glutathione in ICU patients with multiple organ failure. Intensive Care Med. 2005;31:1072–1078. doi: 10.1007/s00134-005-2687-0. [DOI] [PubMed] [Google Scholar]
- 37.Alonso de Vega JM, Diaz J, Serrano E, Carbonell LF. Oxidative stress in critically ill patients with systemic inflammatory response syndrome. Crit Care Med. 2002;30:1782–1786. doi: 10.1097/00003246-200208000-00018. [DOI] [PubMed] [Google Scholar]
- 38.Bulger EM, Maier RV. Antioxidants in critical illness. Arch Surg. 2001;136:1201–1207. doi: 10.1001/archsurg.136.10.1201. [DOI] [PubMed] [Google Scholar]
- 39.Harraki B, Guiraud P, Rochat MH, Faure H, Richard MJ, Fussellier M, et al. Effect of taurine, L-glutamine and L-histidine addition in an amino acid and glucose solution on the cellular bioavailability of zinc. Biometals. 1994;7:237–243. doi: 10.1007/BF00149554. [DOI] [PubMed] [Google Scholar]
- 40.Schwimmer JB, Ee L, Zheng S, Tso P. Glutamine promotes triglyceride absorption in a dose-dependent manner. Am J Physiol Gastrointest Liver Physiol. 2002;282:G317–323. doi: 10.1152/ajpgi.2002.282.2.G317. [DOI] [PubMed] [Google Scholar]