

Abstract
We investigated the biological response of chondrocytes isolated from different zones of articular cartilage and their cellular behaviors in poly (ethylene glycol)-based (PEG) hydrogels containing exogenous type I collagen, hyaluronic acid (HA), or chondroitin sulfate (CS). The cellular morphology was strongly dependent on the extracellular matrix component of hydrogels. Additionally, the exogenous extracellular microenvironment affected matrix production and cartilage specific gene expression of chondrocytes from different zones. CS-based hydrogels showed the strongest response in terms of gene expression and matrix accumulation for both superficial and deep zone chondrocytes, but HA and type I collagen-based hydrogels demonstrated zonal-dependent cellular responses.
Keywords: Articular cartilage, Zonal Organization, Chondrocyte, Hydrogel, Extracellular matrices, Gene Expression
Introduction
Zonal organization of articular cartilage (AC) allows chondrocytes to reside in unique extracellular microenvironments as well as maintain unique expression and organization of extracellular macromolecules for proper functioning of the tissue [1–3]. Previous studies have reported significant phenotypic differences between superficial zone chondrocytes (SZC) and deep zone chondrocytes (DZC) in regards to cell size, matrix gene expression, and extracellular matrix components [1–6]. In addition, efforts of regenerating cartilage using zone specific cells, called stratified tissue engineering, have demonstrated that chondrocytes from different regions respond differently to mechanical forces [7]. Stratified cartilage tissue construct with organizational features similar to normal AC and enhanced biomechanical properties were generated via utilizing SZC and DZC [8–10].
Although several studies have investigated the phenotypic changes of articular chondrocyte subpopulations to recreate the zonal organization of cartilage, there have been no reports investigating the unique gene expression patterns of articular chondrocytes to different microenvironments created by ECM components in three-dimensional (3D) culture [6, 10–12]. Zonal articular chondrocytes lose their phenotype when removed from their native microenvironment; therefore, appropriate microenvironments are necessary for chondrocytes from different zones to secrete and organize matrix. Chondrocytes seeded on collagen gel maintained their phenotype and showed enhanced biological activity in conjunction with growth factors or soluble factors [13, 14]. CS has shown to play an important role in controlling chondrocyte phenotype by regulating intracellular signaling, cell recognition, and the connection of ECM components to cell-surface glycoproteins [15]. Various in vitro effects of HA on chondrocytes have also been reported [16–19]. To this end, we investigated the biological responses of the SZC and DZC in poly(ethylene-glycol) (PEG)-based hydrogels comprised of varying ECM components: type I collagen (Col), hyaluronic acid (HA), or chondroitin sulfate (CS).
Materials and Methods
Chondrocyte isolation
Full thickness articular cartilage (AC) was dissected from the patellofemoral groove and distal femoral condyles of 5–8 week old bovine legs. The superficial zone and deep zone of AC were harvested as previously described [9]. In brief, the top 10% of full thickness cartilage was harvested as superficial zone and bottom 10–15% was harvested as deep zone cartilage. The cartilage pieces were incubated in Dulbeco’s Modified Eagle’s Medium (DMEM, GIBCO, Grand Island, NY, U.S.A.) containing 0.2% collagenase (Worthington Biochemical Corporation, Lakewood, NJ, U.S.A.) and 5% fetal bovine serum (Hyclone) for 16 hours at 37°C and 5% CO2 to isolate chondrocytes. The cell suspension was then filtered through a 70 μm nylon filter (Cell Strainer; Falcon, Franklin Lakes, NJ, U.S.A.) and washed three times with Phosphate Buffered Saline (PBS) containing 100 U/ml penicillin and 100 μg/ml streptomycin. Isolated cells were plated on tissue culture plates at a cell density of 1×10⁴ cells/cm2 and cultured until 90% confluence.
Cell size distribution
Cell size distributions were determined by counting the number of cells with diameters ranging between 7 μm and 25μm with a Coulter counter (Beckmann Coulter, Miami, Fl). Histograms were used to examine average cell volume for each sub-population.
Photoencapsulation
Primary SZC and DZC were encapsulated into four types of hydrogels: poly(ethylene glycol)-diacrylate (PEGDA), PEGDA + type 1 collagen (PEG-Col), PEGDA + hyaluronic acid (PEG-HA), and PEGDA + chondroitin sulfate (PEG-CS). The PEGDA hydrogel solution was prepared by mixing 10% (w/v) PEGDA (Nektar, Huntsville, AL) in sterile phosphate-buffered saline (PBS) with penicillin (100 U/ml) and streptomycin (100 mg/ml) (GIBCO). Hydrogels with exogenous ECM components were prepared by mixing 50/50 volume of 20% (w/v) poly(ethylene glycol)-diacrylate (PEGDA) solution with either bovine type I collagen solution (neutralized with 0.1N NaOH and brought up to a concentration of 2 mg/ml by adding PBS) or hyaluronic acid (HA) solution (5 mg/ml in PBS), as described previously [20]. PEG-CS hydrogels were prepared by co-polymerizing methacrylated chondroitin sulfate (CSMA) and PEGDA according to procedures described in Li et al. [21]. The SZCs and DZCs were gently mixed with the polymer solution at a concentration of 2×10⁷ cells/ml. The photoinitiator, Igracure 2959, was added to the cell-hydrogel solution and mixed thoroughly to make a final concentration of 0.05% (w/v). Photopolymerization of 100 μl cell-polymer-photoinitiator suspension was conducted using 365-nm light (4.5 mW/cm2) for 5 minutes. The constructs were then cultured at 37 °C with 5% CO2 in 2.5 ml chondrocyte growth medium as described previously [9].
Biochemical assays
DNA assay was performed as previously described [20]. Proteoglycan content was determined by detecting CS using dimethylmethylene blue spectrophotometric assay at A525, as previously described [20]. Chondroitin sulfate C (Sigma-Aldrich, St. Louis, MO) dissolved in de-ionized water was used for the standard curve. For measurement of proteoglycan produced by cells in PEG-CS hydrogels, acellular PEG-CS hydrogels were used as a blank.
Histology
Hydrogel constructs were fixed in 4% paraformaldehyde, dehydrated in serial ethanol dilutions, and paraffin embedded. Constructs were processed into 5μm sections and stained with hematoxylin and eosin, and Safranin-O.
Actin Staining
Hydrogel constructs were fixed in 4% paraformaldehyde and cut into 1 mm sections and then permeabilized for 30 minutes with 0.1% Triton X-100 in DPBS. Subsequently, the samples were incubated with TRITC-conjugated Phalloidin diluted 1:500 in 1% BSA/DPBS for an hour at room temperature (Chemicon). Nuclei were counterstained with DAPI for 10 minutes at room temperature (Chemicon). Images were collected with Zeiss LSM 510 Meta Confocal microscope.
Electron microscopy
Hydrogel constructs were fixed for 1 hour at room temperature in 100 mM cacodylate solution containing 2.5% glutaraldehyde. The hydrogel constructs were treated with Palade’s OsO4 for 1 hour. The constructs were then washed three times with 100 mM cacodylate, and incubated overnight in Kellenberger’s uranyl acetate. The constructs were dehydrated and embedded in Epon. Sections were cut on Leica ULCTRACUT UCT ultramicrotome, post-stained in uranyl acetate, and observed in Philips EM420 transmission electron microscope (TEM).
RNA isolation and real-time PCR
Total RNA was extracted with Trizol and reverse-transcribed into cDNA using SuperScript First-Strand Synthesis System (Invitrogen). Real Time-PCR reactions were performed using the SYBR Green PCR Mastermix and the ABI Prism 7700 Sequence Detection System (Perkin Elmer/Applied Biosystems, Rotkreuz, Switzerland) for the following genes: aggrecan (F-tgaggagggctggaacaagtacc, R-ggaggtggtaattgcagggaaca, 60°C; 305bp), Type II collagen (F-tttcccaggtcaagatggtc, R- cttcagcacctgtctcacca, 60°C 377bp), Link Protein (F-gctctgtgcaatatcccatc, R-cccacttttgcaatctgagc, 60°C; 232bp), Superficial Zone Protein (F-gagcagacctgaatccgtgtatt, R-ggtgggttcctgtttgtaagtgta), HAS1 (F-ggcacccactgcaccttt, R-cgaggtgtacttggtggcatag), HAS2 (F-ggattatgtacaggtttgtgattcaga, R-acctccaaccatgggatcttc), and β-actin (F-tggcaccacaccttctacaatgagc; R-gcacagcttctccttaatgtc) as a reference.
Statistical Analysis
Data are expressed as mean ± standard deviation (SD). Statistical significance was determined by analysis of variance (ANOVA single factor) with P<0.05 or P<0.01.
Results
Zonal Cell Isolation and Cell Size
The superficial zone (SZ) cartilage was approximately upper 10% and the deep zone (DZ) cartilage was approximately bottom 10% of full thick cartilage (Fig. 1A). Cells from superficial and deep zone AC maintain distinct cellular morphology in native cartilage tissue. Safranin-O staining for negatively charged proteoglycans indicates the varying degrees of ECM deposited by DZC and SZC (Fig. 1B, C). SZC have a flattened or ellipsoid-shaped morphology and align parallel to the surface of the AC. Conversely, DZC are round and maintain a larger cytoplasmic volume compared to SZC. Initial plating and expansion of freshly isolated SZC and DZC show that these cells maintain distinct cellular cytoplasmic volumes, as indicated by cell areas (Fig. 1D, E, F). Size distribution of chondrocyte sub-population indicated that SZC are smaller than the DZC (Fig. 1G). SZC have mean cell volume of 2169 μm3 while DZC have 2952 μm3.
Figure 1.
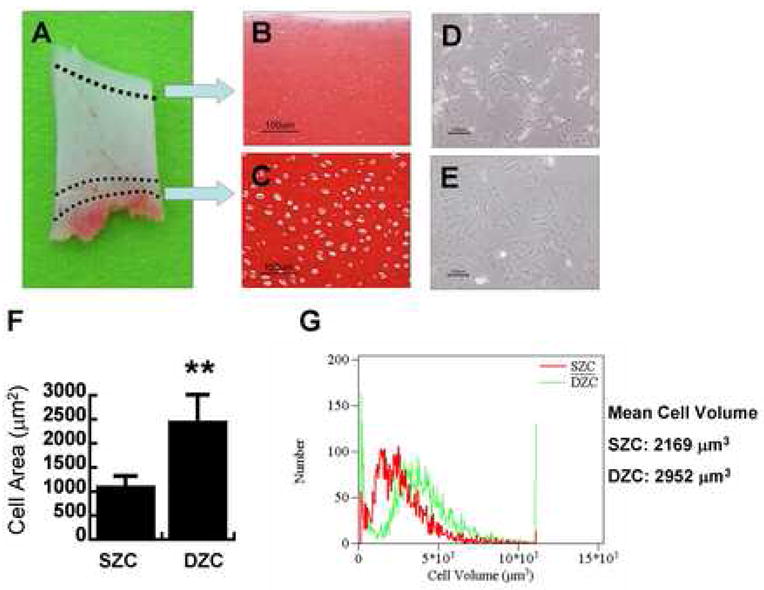
Histology of cartilage sections and morphology of cells isolated from superficial and deep zones of articular cartilage. (A) Cartilage was taken from the patellofemoral groove and distal femoral condyles and top 10% and bottom 10–15% of the tissues were harvested to islate superficial and deep zone chondrocytes. Superficial zone chondrocytes stained weakly for Safranin-O (B) and maintained smaller cell area when plated (D). Deep zone chondrocytes (DZC) stained intensely for safranin-O (C) and maintained larger cell area compared to superficial zone chondrocytes (SZC) when plated on tissue culture dishes (E). (F) Cell area was measured using Metamorph image software. (G) Cell size distribution of SZC and DZC. Bar = 100 μm, ** P<0.01, SZC: Superficial zone chondrocytes, DZP: Deep zone chondrocytes
Microenvironment induced changes in cell morphology
Primary chondrocytes were encapsulated in four different hydrogels containing: PEGDA, PEG-Col, PEG-HA, and PEG-CS. The cell morphology and intracellular structure of the encapsulated chondrocytes varied depending upon the ECM microenvironment (ECM-containing hydrogels). Figure 2 shows the typical cell morphology after 7 days of encapsulation in different ECM containing hydrogels. In general, chondrocytes cultured in PEGDA hydrogels had a round morphology without any significant cytoplasmic actin cytoskeleton structures (Fig. 2A). However, chondrocytes had distinct organization of cortical actin fibers in the cytoplasmic region when cultured in PEG-Col hydrogels (Fig. 2B). Cell sprouting and actin cytoskeleton reorganization were observed in the presence of HA (Fig. 2C). Finally, chondrocytes in CS-based hydrogels displayed a relatively round morphology with significantly higher cytoplasmic volume than in PEGDA hydrogels (Fig. 2D). TEM imaging revealed varying intracellular structure of chondrocytes with the hydrogel composition (Fig. 2E–H). Chondrocytes in CS-based hydrogels displayed exocytic vacuoles, indicating higher rate of pericellular matrix accumulation (Fig. 2H).
Figure 2.
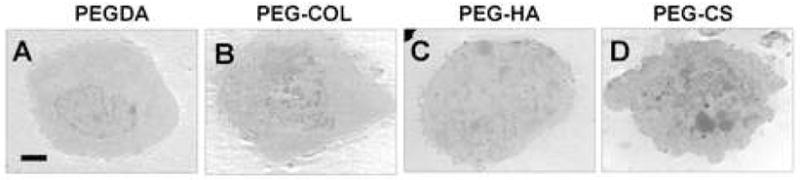
Distinct cellular morphologies were induced by the various extracellular microenvironments, independent of zonal variation. Confocal image of actin cytoskeleton staining of chondrocytes (SZC) encapsulated in PEGDA (A), PEG-Col (B), PEG-HA (C), and PEG-CS (D) hydrogels after 7 days of culture. Actin: Phalloidin (Red), Nucleus: DAPI (Blue). Morphological analysis of chondrocytes encapsulated in PEGDA (E), PEG-Col (F), PEG-HA (G), and PEG-CS (H) via electron microscopy. (A–D, Bar = 100 μm; E–H, Bar= 10 μm)
Histological evaluation of chondrocytes after 3 weeks of culture indicated that DZC maintained higher matrix accumulation in the hydrogel. In addition, the diameter of pericellular matrix visualized with H&E staining was larger in the DZC compared to the SZC. Accumulation of cell secreted proteoglycan was evident in PEGDA and PEG-Col hydrogels with clear evidence of pericellular accumulation of newly synthesized proteoglycans (Fig. 3A, B, E, and F). In contrast, incorporation of newly synthesized proteoglycans around the pericellular region was not evident in PEG-HA hydrogels (Fig. 3C, G), probably due to the displacement of newly-synthesized proteoglycans by exogenous HA [22]. PEG-CS hydrogels stained positive for Safranin-O due to CS content in the hydrogel (Fig. 3D, H); however, H&E staining demonstrated pericellular matrix accumulation by both SZC and DZC (Fig. 3L, P).
Figure 3.
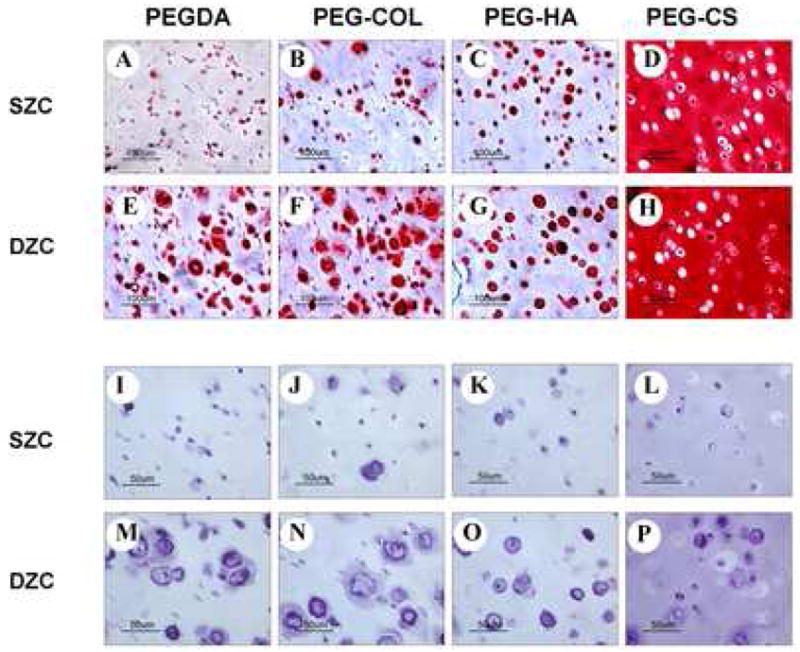
Histology of hydrogels encapsulated with different zonal chondrocytes after 3 weeks in culture: Safranin-O staining (A–H) and H&E staining (I–P). Deep cells maintained higher matrix accumulation and larger pericellular area than superficial cells. (Bar = 100 μm)
Matrix synthesis and cell proliferation
Biochemical analysis of DZC and SZC was consistent with the histological observation (Fig. 4A). DZC maintained higher matrix production compared to SZC in all hydrogels. Significant GAG accumulation by DZC was observed in hydrogels containing exogenous collagen and CS. Interestingly, DZC in both PEG-HA and control PEGDA hydrogels resulted in similar GAG accumulation. Exogenously added type I collagen did not have any significant influence on SZC as indicated by the GAG accumulation data (Fig. 4A). However, microenvironments created by HA and CS resulted in higher matrix accumulation by SZC, with the highest observed in PEG-CS hydrogels. While type I collagen and HA microenvironments resulted in varying degrees of response by the SZC and DZC, the CS microenvironment resulted in maximum accumulation of matrix by both cell types.
Figure 4.

(A) Glycosaminoglycan (GAG) production significantly increased in DZC after culture. (B) Extracellular microenvironments inhibited cell proliferation. The DNA content of the constructs was normalized by dry weight for comparison. *P<0.05, **P<0.001
Proliferation rate of the cells within various hydrogels was determined by measuring the DNA content (Fig. 4B). DZC maintained higher proliferation in PEGDA hydrogels compared to their counterparts with different ECM components. The relative proliferative capacities of DZC and SZC in hydrogels containing different ECM components were lower than control hydrogels, without significant difference between the cell types (SZC vs. DZC).
Gene expression
RNA isolated from SZC or DZC in PEGDA, PEG-Col, PEG-HA, and PEG-CS was subjected to real-time PCR analysis to quantify differences in gene expression after 3 weeks in culture. DZC expressed higher expression levels of aggrecan, type II collagen, and link protein genes compared to the SZC, independent of hydrogel composition (data not shown). All the genes are normalized to the respective chondrocyte sub-population in PEGDA control hydrogels (Fig. 5). CS-containing hydrogels resulted in the highest expression of aggrecan and type II collagen genes by both SZC and DZC relative to PEGDA hydrogels (Fig. 5A–D). The presence of exogenous type I collagen and HA upregulated aggrecan and type II collagen gene expressions in SZC; however, exogenous type I collagen and HA downregulated both aggrecan and type II collagen gene expressions in DZC. Link protein gene expression of DZC and SZC was modulated by their respective hydrogel microenvironments (Fig. 5E, F). Link protein gene expression of SZC and DZC in hydrogels containing type I collagen was upregulated while the HA microenvironment downregulated the link protein gene expression of both SZC and DZC. On the contrary, CS microenvironments resulted in differential gene expression of link protein. Presence of CS in the hydrogels downregulated the gene expression of link protein in SZC but it upregulated the expression in DZC. Our results demonstrate that chondrocytes from different zones of AC have unique gene expression patterns depending on their surrounding microenvironment.
Figure 5.

Real-time PCR of matrix protein aggrecan expression (A, B), type II collagen (C, D), and link protein (E, F) transcripts were quantified by using SYBR green fluorescence after 21 day of culture. Expression levels were normalized to levels of β-actin and relative amounts of mRNA were normalized to respective cartilage sub-populations in PEGDA hydrogels. SZC: Superficial zone chondrocytes, DZP: Deep zone chondrocytes. * P<0.05; ** P<0.01
Response of ECM on the lubricating protein expression
The mechanical functions of the superficial zone are to resist shear stresses produced by joint motion and to provide a smooth, nearly frictionless surface. Expression of SZP (also known as lubricin or PG4), HAS1, and HAS2 have previously shown to be specific to the articular surface. Therefore, we further investigated whether exogenous ECM components would modulate the expression of SZP, HAS1, and HAS2 by SZC. In general, SZC in PEG-HA and PEG-CS demonstrated highest expression of SZP (Fig. 6A). SZP expression was not modulated in PEG-Col. HAS1 and HAS2 expression are enhanced by CS-microenvironment, while SZC in PEG-Col and PEG-HA showed moderate increase to no response (Fig. 6B, C).
Figure 6.
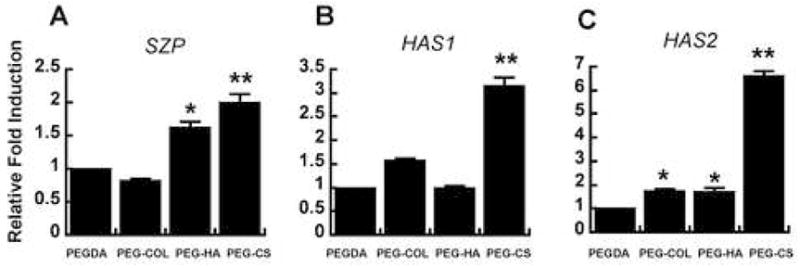
Relative mRNA expression of (A) PRG4, (B) HAS1, and (C) HAS2 of SZC o bovine chondrocytes in ECM-hydrogels. Data were normalized to the expression level of the cells in the PEGDA hydrogels.
Characterization of acellular ECM-hydrogels
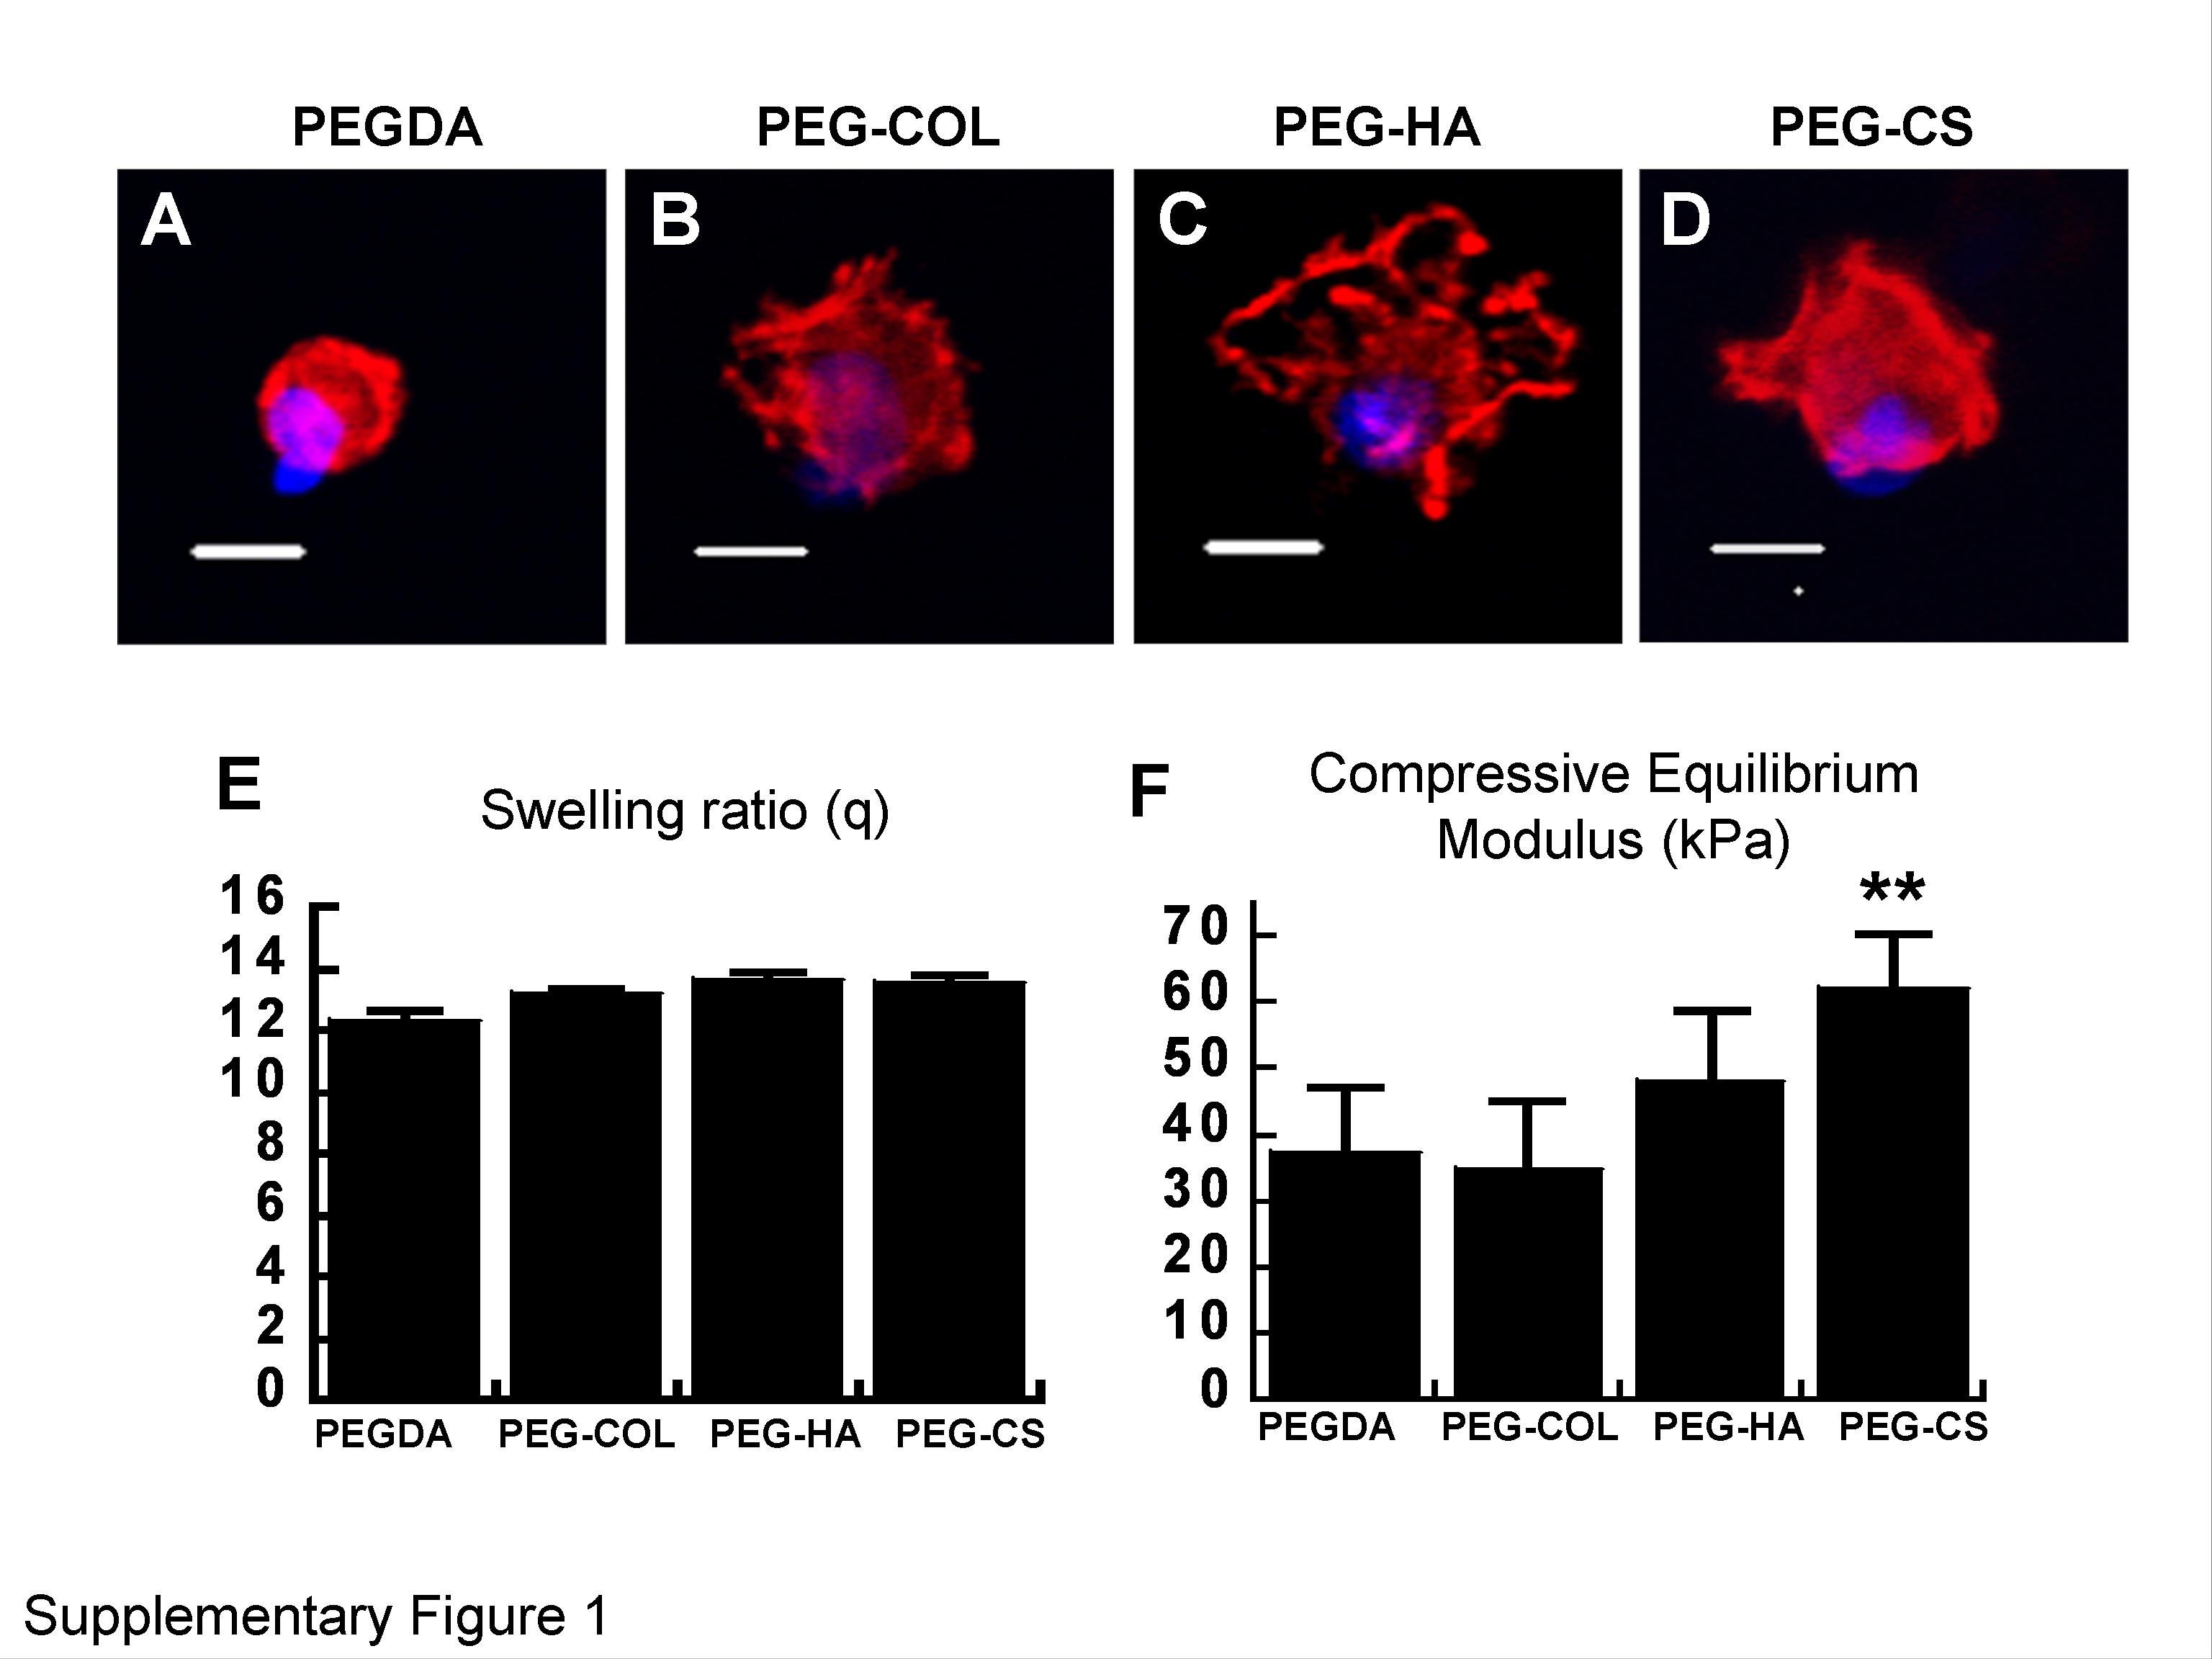
Type I collagen and HA were introduced to the PEGDA hydrogel by creating semi-interpenetrating networks (semi-IPN) where PEGDA forms the chemically crosslinked network. Since the retention of CS within the PEGDA hydrogels was limited due to its small molecular weight, we have used methacrylated CS to create chemical crosslinks. Acellular hydrogels were characterized for their swelling behavior and stiffness (Supplementary Figure 1A, B). All hydrogels had similar swelling ratios indicating comparable water content. The compressive modulus of PEGDA and PEG-Col was comparable and this may be attributed to the small weight contribution of type collagen 1 to the total polymer content of the hydrogel. Although the modulus of PEG-HA appeared to be higher than PEGDA but it is not statistically significant, possibly due to the heterogeneity of the PEG-HA hydrogels. PEG-CS hydrogels had significantly higher compressive modulus as seen from Supplementary Figure 1B. This could be explained based on: (i) higher polymer concentration of PEG/CS hydrogels (20% w/v), and (ii) presence of ionic sulfate groups and their mutual repulsion that keep polymer chains apart and results in higher stiffness.
Discussion
Previous studies have shown that chondrocytes from different zones of cartilage express unique ECM components within the AC which allows proper functioning of the tissue [1, 6]. The current study represents an attempt to examine the interactions between ECM components and chondrocytes isolated from different zones of AC in 3D in vitro culture. Chondrocytes isolated from SZ and DZ of bovine AC maintained their distinct cell volume and cell morphology after initial plating on tissue culture plate and encapsulating in PEGDA hydrogels. DZC were more active in matrix production compared to the SZC (Fig. 4A). Chondrocytes isolated from different zones also had varying proliferation rates [11]. Our results show that DZC maintain a higher proliferative rate compared to SZC in PEGDA hydrogels. Interestingly, when chondrocytes were encapsulated in hydrogels with type I collagen, HA, or CS, both SZC and DZC maintained similar proliferation rates. We have found zonal dependent variation in chondrocyte phenotypes such as cell size and matrix production. In addition, DZC expressed higher levels of aggrecan, type II collagen, and link protein genes compared to SZC in control PEGDA hydrogels (Supplementary Figure 2). This observation is in accord with a recent study by Hidata et. al. which has demonstrated that zonal variation of cells exist even in the immature cartilage, independent of donor age [23].
In this study, CS showed the greatest response in terms of gene expression and matrix accumulation in both SZC and DZC. SZC in PEG-CS hydrogels retained the highest expression of PRG4, HAS1, and HAS2. Chondrocytes exposed to HA and type I collagen showed varying effects depending on the zonal variation of cell sources. Previous study by Nishimoto et al. has demonstrated that exogenous CS increased mRNA expression of type II collagen and aggrecan while high molecular weight HA markedly decreased the mRNA expression of both aggrecan and type II collagen of chondrocytes [19]. Similarly, our study shows that exogenous CS increased mRNA expression of type II collagen and aggrecan in both SZC and DZC compared to the cells in PEGDA hydrogels. In addition, exogenous CS promoted link protein gene expression of DZC while it inhibited link protein gene expression in SZC. Interestingly, high molecular weight HA used in our study promoted a response only in SZC which upregulated aggrecan expression and matrix accumulation. Effects of HA on DZC were minimal. Exogenous type I collagen resulted in significantly higher matrix accumulation by DZC, while minimal induction was observed by SZC. The gene expression profiles indicate that transcription of major cartilage matrix proteins such as collagen type II, aggrecan, and link proteins are dependent on the zones of cartilage and extracellular microenvironments in which the cells are closely interacting.
We hypothesize that zonal chondrocytes express the matrix proteins that are appropriate for function of cartilage in zonal variable manner. Chondrocytes actively secrete morphogenetic factors that may influence neighboring cellular phenotype and differentiation and a recent study by Blanka et. al. showed that structurally organized zone-specific cells contribute to improved functional properties of engineered cartilage [10, 24]. Bilayered constructs demonstrated greater shear and compressive strength than homogenous cell constructs, demonstrating that zone-specific chondrocytes affect the biological and mechanical properties of engineered cartilage [10]. Current study demonstrated the qualitative and quantitative changes in the pattern of cell morphologies, gene expression, and matrix production of chondrocytes from different zones of AC in response to the ECM microenvironment, which may be utilized when designing stratified tissue engineering approaches to regenerate functional articular cartilage.
Supplementary Material
(A) Swelling ratio of acellular PEGDA, PEG-Col, and PEG-HA, and PEG-CS hydrogels. The wet weight was measured after incubating the hydrogels for 24 hrs in PBS at 37°C to reach equilibrium swelling. The swelling ratio was calculated as the ratio of the weight of the equilibrium hydrogel to its dry weight (25) Comparable swelling ratio was observed among different hydrogels (n = 4). (B) Mechanical characterization of acellular hydrogels: A compression fixture fitted to an Instron Universal Testing Machine was used to obtain stress-strain data on equilibrium swollen acellular hydrogels (n=5; dimensions 4mm height and 6mm diameter) and the Young’s modulus was calculated from the linear region of the stress-strain curve. The tests were done at a crosshead speed of 10mm/min. ** P<0.01
Real-time PCR comparison of SZC and DZC after 21 days of culture in PEGDA hydrogels. DZC express higher levels of matrix protein transcripts compared to SZC. Expression levels were normalized to levels of β-actin and relative amounts of mRNA were normalized to SZC in PEGDA hydrogels. SZC: Superficial zone chondrocytes, DZP: Deep zone chondrocytes
Acknowledgments
This study was supported by the National Institutes of Health (R01 EB05517) and the Arthritis Foundation. The authors are grateful to Dr. Zijun Zhang and Janice Lee for critical review and technical assistance.
Footnotes
Publisher's Disclaimer: This is a PDF file of an unedited manuscript that has been accepted for publication. As a service to our customers we are providing this early version of the manuscript. The manuscript will undergo copyediting, typesetting, and review of the resulting proof before it is published in its final citable form. Please note that during the production process errors may be discovered which could affect the content, and all legal disclaimers that apply to the journal pertain.
References
- 1.Aydelotte MB, Greenhill RR, Kuettner KE. Differences between sub-populations of cultured bovine articular chondrocytes. II. Proteoglycan metabolism. Connect Tissue Res. 1988;18:223–234. doi: 10.3109/03008208809016809. [DOI] [PubMed] [Google Scholar]
- 2.Aydelotte MB, Kuettner KE. Differences between sub-populations of cultured bovine articular chondrocytes. I. Morphology and cartilage matrix production. Connect Tissue Res. 1988;18:205–222. doi: 10.3109/03008208809016808. [DOI] [PubMed] [Google Scholar]
- 3.Siczkowski M, Watt FM. Subpopulations of chondrocytes from different zones of pig articular cartilage. Isolation, growth and proteoglycan synthesis in culture. J Cell Sci. 1990;97 (Pt 2):349–360. doi: 10.1242/jcs.97.2.349. [DOI] [PubMed] [Google Scholar]
- 4.Zanetti M, Ratcliffe A, Watt FM. Two subpopulations of differentiated chondrocytes identified with a monoclonal antibody to keratan sulfate. J Cell Biol. 1985;101:53–59. doi: 10.1083/jcb.101.1.53. [DOI] [PMC free article] [PubMed] [Google Scholar]
- 5.Darling EM, Athanasiou KA. Growth factor impact on articular cartilage subpopulations. Cell Tissue Res. 2005;322:463–473. doi: 10.1007/s00441-005-0020-4. [DOI] [PubMed] [Google Scholar]
- 6.Darling EM, Hu JC, Athanasiou KA. Zonal and topographical differences in articular cartilage gene expression. J Orthop Res. 2004;22:1182–1187. doi: 10.1016/j.orthres.2004.03.001. [DOI] [PubMed] [Google Scholar]
- 7.Shieh AC, Athanasiou KA. Biomechanics of single zonal chondrocytes. J Biomech. 2006;39:1595–1602. doi: 10.1016/j.jbiomech.2005.05.002. [DOI] [PubMed] [Google Scholar]
- 8.Klein TJ, Schumacher BL, Schmidt TA, Li KW, Voegtline MS, Masuda K, Thonar EJ, Sah RL. Tissue engineering of stratified articular cartilage from chondrocyte subpopulations. Osteoarthritis Cartilage. 2003;11:595–602. doi: 10.1016/s1063-4584(03)00090-6. [DOI] [PubMed] [Google Scholar]
- 9.Kim TK, Sharma B, Williams CG, Ruffner MA, Malik A, McFarland EG, Elisseeff JH. Experimental model for cartilage tissue engineering to regenerate the zonal organization of articular cartilage. Osteoarthritis Cartilage. 2003;11:653–664. doi: 10.1016/s1063-4584(03)00120-1. [DOI] [PubMed] [Google Scholar]
- 10.Sharma B, Williams CG, Kim TK, Sun D, Malik A, Khan M, Leong K, Elisseeff JH. Designing zonal organization into tissue-engineered cartilage. Tissue Eng. 2007;13:405–414. doi: 10.1089/ten.2006.0068. [DOI] [PubMed] [Google Scholar]
- 11.Darling EM, Athanasiou KA. Rapid phenotypic changes in passaged articular chondrocyte subpopulations. J Orthop Res. 2005;23:425–432. doi: 10.1016/j.orthres.2004.08.008. [DOI] [PubMed] [Google Scholar]
- 12.Hu JC, Athanasiou KA. Chondrocytes from different zones exhibit characteristic differences in high density culture. Connect Tissue Res. 2006;47:133–140. doi: 10.1080/03008200600685392. [DOI] [PubMed] [Google Scholar]
- 13.Wakitani S, Goto T, Young RG, Mansour JM, Goldberg VM, Caplan AI. Repair of large full-thickness articular cartilage defects with allograft articular chondrocytes embedded in a collagen gel. Tissue Eng. 1998;4:429–444. doi: 10.1089/ten.1998.4.429. [DOI] [PubMed] [Google Scholar]
- 14.Matsusaki M, Ochi M, Uchio Y, Shu N, Kurioka H, Kawasaki K, Adachi N. Effects of basic fibroblast growth factor on proliferation and phenotype expression of chondrocytes embedded in collagen gel. Gen Pharmacol. 1998;31:759–764. doi: 10.1016/s0306-3623(98)00105-0. [DOI] [PubMed] [Google Scholar]
- 15.Ayad S, Boot-Handford RP, Humphries MJ, Kadler KE, Shuttleworth CA. The Extracellular Matrix Facts Book. San Diego: Academic Press; 1994. [Google Scholar]
- 16.Allemann F, Mizuno S, Eid K, Yates KE, Zaleske D, Glowacki J. Effects of hyaluronan on engineered articular cartilage extracellular matrix gene expression in 3-dimensional collagen scaffolds. J Biomed Mater Res. 2001;55:13–19. doi: 10.1002/1097-4636(200104)55:1<13::aid-jbm20>3.0.co;2-g. [DOI] [PubMed] [Google Scholar]
- 17.Kawasaki K, Ochi M, Uchio Y, Adachi N, Matsusaki M. Hyaluronic acid enhances proliferation and chondroitin sulfate synthesis in cultured chondrocytes embedded in collagen gels. J Cell Physiol. 1999;179:142–148. doi: 10.1002/(SICI)1097-4652(199905)179:2<142::AID-JCP4>3.0.CO;2-Q. [DOI] [PubMed] [Google Scholar]
- 18.Takeuchi R, Saito T, Ishikawa H, Takigami H, Dezawa M, Ide C, Itokazu Y, Ikeda M, Shiraishi T, Morishita S. Effects of vibration and hyaluronic acid on activation of three-dimensional cultured chondrocytes. Arthritis Rheum. 2006;54:1897–1905. doi: 10.1002/art.21895. [DOI] [PubMed] [Google Scholar]
- 19.Nishimoto S, Takagi M, Wakitani S, Nihira T, Yoshida T. Effect of chondroitin sulfate and hyaluronic acid on gene expression in a three-dimensional culture of chondrocytes. J Biosci Bioeng. 2005;100:123–126. doi: 10.1263/jbb.100.123. [DOI] [PubMed] [Google Scholar]
- 20.Hwang NS, Varghese S, Zhang Z, Elisseeff J. Chondrogenic differentiation of human embryonic stem cell-derived cells in arginine-glycine-aspartate-modified hydrogels. Tissue Eng. 2006;12:2695–2706. doi: 10.1089/ten.2006.12.2695. [DOI] [PubMed] [Google Scholar]
- 21.Li Q, Williams CG, Sun DD, Wang J, Leong K, Elisseeff JH. Photocrosslinkable polysaccharides based on chondroitin sulfate. J Biomed Mater Res A. 2004;68:28–33. doi: 10.1002/jbm.a.20007. [DOI] [PubMed] [Google Scholar]
- 22.Kikuchi T, Yamada H, Fujikawa K. Effects of high molecular weight hyaluronan on the distribution and movement of proteoglycan around chondrocytes cultured in alginate beads. Osteoarthritis Cartilage. 2001;9:351–356. doi: 10.1053/joca.2000.0395. [DOI] [PubMed] [Google Scholar]
- 23.Hidaka C, Cheng C, Alexandre D, Bhargava M, Torzilli PA. Maturational differences in superficial and deep zone articular chondrocytes. Cell Tissue Res. 2006;323:127–135. doi: 10.1007/s00441-005-0050-y. [DOI] [PubMed] [Google Scholar]
- 24.Hwang NS, Varghese S, Puleo C, Zhang Z, Elisseeff J. Morphogenetic signals from chondrocytes promote chondrogenic and osteogenic differentiation of mesenchymal stem cells. J Cell Physiol. 2007 doi: 10.1002/jcp.21052. [DOI] [PubMed] [Google Scholar]
- 25.Varghese S, Lele AK, Mashelkar RA. Designing new thermoreversible gels by molecular tailoring of hydrophilic-hydrophobic interactions. Journal of Chemical Physics. 2000;112:3063–3070. [Google Scholar]
Associated Data
This section collects any data citations, data availability statements, or supplementary materials included in this article.
Supplementary Materials
(A) Swelling ratio of acellular PEGDA, PEG-Col, and PEG-HA, and PEG-CS hydrogels. The wet weight was measured after incubating the hydrogels for 24 hrs in PBS at 37°C to reach equilibrium swelling. The swelling ratio was calculated as the ratio of the weight of the equilibrium hydrogel to its dry weight (25) Comparable swelling ratio was observed among different hydrogels (n = 4). (B) Mechanical characterization of acellular hydrogels: A compression fixture fitted to an Instron Universal Testing Machine was used to obtain stress-strain data on equilibrium swollen acellular hydrogels (n=5; dimensions 4mm height and 6mm diameter) and the Young’s modulus was calculated from the linear region of the stress-strain curve. The tests were done at a crosshead speed of 10mm/min. ** P<0.01
Real-time PCR comparison of SZC and DZC after 21 days of culture in PEGDA hydrogels. DZC express higher levels of matrix protein transcripts compared to SZC. Expression levels were normalized to levels of β-actin and relative amounts of mRNA were normalized to SZC in PEGDA hydrogels. SZC: Superficial zone chondrocytes, DZP: Deep zone chondrocytes