Abstract
In natural tooth enamel fluoride is always present in the carbonated hydroxyapatite mineral and plays a key role in the prevention of tooth decay. In this study we aimed at mimicking this natural anti-caries ability of the tooth by developing new, effective anticaries materials using fluorapatite nanorods or nanowires. We therefore investigated the conditions necessary to synthesize fluorapatite nanorods of different size, shape and composition for future use either directly or indirectly, that is by incorporation into dental materials, in the treatment and prevention of caries. By controlling the chemical conditions, nanorods of desirable chemical composition and dimension were produced. The mechanism of how these structures were formed is also proposed.
Keywords: fluorapatite, nanorod, nanowire, hydrothermal
INTRODUCTION
Although the main mineral of tooth is a carbonated hydroxyapatite, natural teeth always contain fluoride to some extent, in the form of fluorapatite or fluor-carbonate-hydroxyapatite (eg. the tooth enameloid of shark is fluorapatite).1, 2 These compounds are believed to play a key role in the prevention and control of dental caries. Fluorapatite [Ca10(PO4)6F2, FA] is hexagonal with the highest symmetry found among the apatite minerals [space group: P6/m (175) with the lattice constants a = 9.3684 and c = 6.8841 ].3 The crystal structure can be considered as the Ca2+ and PO43− arranged around the central column of fluoride ions, which extends throughout the crystals in the [001] direction (c-axis).1, 4 The substitution of OH−, Cl−, CO32− or other ions for the F− usually leads to atomic displacements and lower symmetry, therefore compromising its chemical stability.4 Fluorapatite is chemically stable but is known to release fluoride as the pH in the oral cavity falls. It is believed that the reason for fluoride’s anticaries effect is due to its ability to partly transform the carbonated hydroxyapatite in enamel to thermodynamically more stable FA or fluor-hydroxyapatite (FHA) and then during the caries process the fluoride is released which changes the dynamics of the demineralization / remineralization process.5 Fluoride is the most electronegative of the elements, and it is of small ionic diameter with a high charge density which endows it with a great capacity to form strong ionic and hydrogen bonds. This provides the fluoride ion with a potential for interacting both with mineral phases and organic macromolecules, and because of these properties, particularly its small size, it can also act as a “structure former” in water. This can decrease the mobility of water molecules in solution and in hydration layers of proteins and apatite surfaces.6 On the other hand, fluoride substitutes directly for a column hydroxyl or occupies a hydroxyl vacancy in the hydroxyapatite crystals, which incurs a reduction in a and b lattice parameters in the crystal with a concomitant reduction in crystal energy. This generates a more stable structure and the acid solubility of the crystals decrease dramatically giving the crystals the anti-caries effect.1
We set out to mimic this natural anti-caries ability of teeth by developing new, effective anticaries materials using fluorapatite nanorods or nanowires. The advantage of these nanorods or nanowires is that the physico-chemical composition is the same as the hydroxyapatite crystals in the dental hard tissues. They also have the ability to release fluoride ions as the site specific pH drops which will help in preventing caries and aid in remineralisation. Further these nanorods / nanowires may be used directly to form a matrix to be placed in boney areas where there has been, for example, malunion, defects, and/or where bone augmentation is desirable. They could also be introduced into scaffolds containing the signaling molecules of bone, dentin, enamel, cementum and / or blood vessels for the repair of the type of conditions referred to earlier. Recently Yamagishi et al. has reported that it is possible to use the fluoridated-apatite to repair early caries lesions directly.7 We believe that the shape and chemical composition of well defined synthetic fluorapatite nanorods / nanowires have the potential to be layered over carious lesions.
The excellent biocompatibility of HA nanostructures has resulted in many studies focusing on their synthesis.8–14 This is mainly achieved by using surfactants,8 glutamic acid,9 EDTA,10 polyaspartate,11 biological proteins,12 etc. to control the nucleation and growth of crystals under varying synthetic conditions. However, there is little literature specially reporting the synthesis of 1-dimension fluorapatite nanostructures. In comparison to hydroxyapatite, the incorporation of fluoride makes the fluorapatite structure more stable, therefore, the reaction progresses more easily under relatively simple and mild reaction conditions.
In this paper we report the synthesis of fluroapatite nanorods and nanowires of various size and chemical composition under simple and relatively mild reaction conditions. Using scanning electron microscopy (SEM), energy-dispersive X-ray spectroscopy (EDS), transmission electron microscopy (TEM), Magic-Angle Spinning Nuclear Magnetic Resonance Spectroscopy (MAS-NMR), Fourier transform infrared spectroscopy (FTIR) and powder X-ray diffraction (XRD), the mechanism of how these structures formed was explored.
EXPERIMENTAL SECTION
Synthesis of FA nanostructures
Two methods were used to synthesize FA nanostructures. One is without the stabilizer EDTA, under ambient pressure, and usually produced short FA nanorods. This is a modification of our previous reported method of synthesizing hydroxyapatite nanorods.13 One hundred and four point six milligrams hydroxyapatite powder and 8.4 mg sodium fluoride were mixed with 100 mL distilled water. The suspensions were stirred continuously and HNO3 was added until the powder dissolved, after which the pH was adjusted to 2.4. Ammonium hydroxide was then added dropwise to 20 ml the above solution with continuous stirring until the desired pH between 6 – 11 was reached. The suspension was sealed in a plastic tube and kept in a water bath at 70°C for 5 days. In order to obtain the longer FA nanorods similar to those seen in human enamel, EDTA-Na4.4H2O was used to stabilize the Ca, allowing the slow release of Ca2+. The reaction is performed under mild hydrothermal conditions (121 °C, 2 atm) to dissociate the Ca2+ from EDTA-Ca complex. Typically, 1004.6 mg HA, 9044.8 mg EDTA-Na4.4H2O and 84 mg NaF were added to 100 mL distilled water. The suspension was stirred continuously and the pH was adjusted to 4–12 using HNO3. The temperature of the solution was raised to 121 °C at a pressure of 2 atm for six hours. All final suspensions were centrifuged and washed with distilled water (pH 7.4) 3 times. The resulting pellets were dried in vacuum before use.
Fourier Transform Infrared Spectroscopy (FTIR)
The infrared spectra of crystals was characterized by a PERKIN ELMER Spectrum BX FT-IR system (PerkinElmer Life and Analytical Sciences, Inc., Boston, MA, USA), using KBr pellet method. Scan Number: 8; Scan range: 400–4000cm−1; Resolution: 2 cm−1.
Magic-Angle Spinning Nuclear Magnetic Resonance Spectroscopy (MAS-NMR)
The 19F MAS-NMR measurements were conducted at a resonance frequency of 188.29 MHz using a FT-NMR spectrometer (DSX-200, Bruker, Germany). Spinning rates of the sample at a magic angle was 15 kHz. Recycle time was 120 s. The spectra for 19F were referenced to CaF2 taken as −108 ppm relative to the more common standard of CFCl3.
Transmission Electron Microscopy (TEM)
JEOL 2010F STEM/TEM analytical electron microscope (JEOL USA, Peabody, MA, USA) operating at 200kV and JEOL 3011 high resolution electron microscope (JEOL USA, Peabody, MA, USA) operating at 300 kV were used for normal TEM imaging, high-resolution transmission electron microscopy (HRTEM) and energy-dispersive X-ray spectroscopy (EDS) analysis. The sample was pipetted onto or transferred to holey-carbon film coated copper grids and dried before TEM measurement.
Scanning Electron Microscopy (SEM)
SEM analysis was conducted on a Philips XL30FEG Scanning Electron Microscope (FEI company, Hillsboro, OR, USA) operated at 15 kV (Resolution: 2.0nm at 30kV, 5.0nm at 1kV).
X-ray Diffraction Analysis (XRD)
Powder X-ray diffraction patterns of synthetic FA crystals were conducted on a Rigaka MiniFlex+ Diffractometer (Rigatu / USA, Inc., Denvers, MA, USA) using Cu Kα1 radiation (λ = 1.54056 ) at 30 kV and 15 mA.
RESULTS
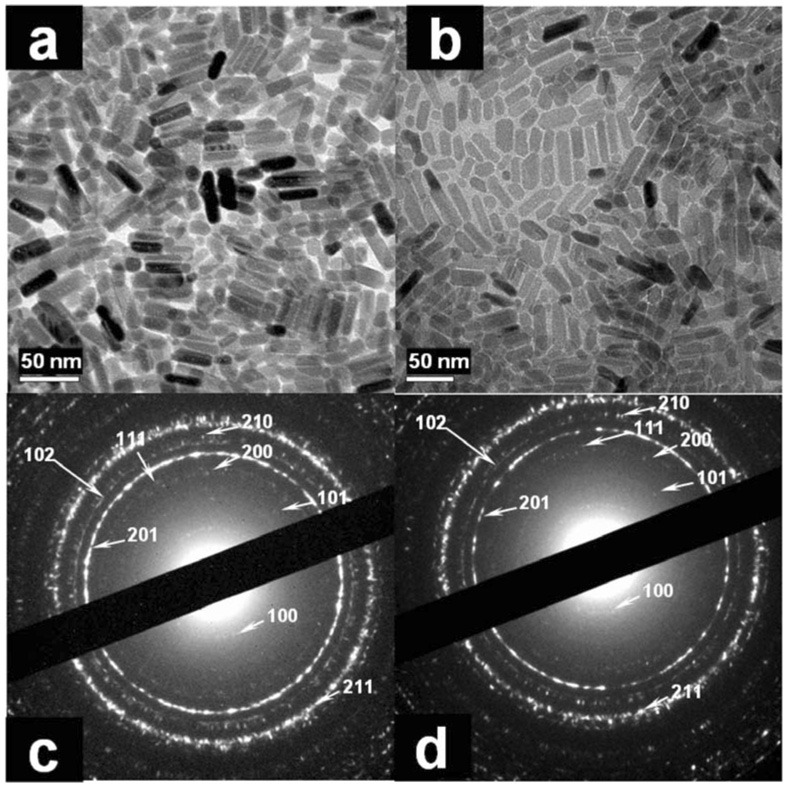
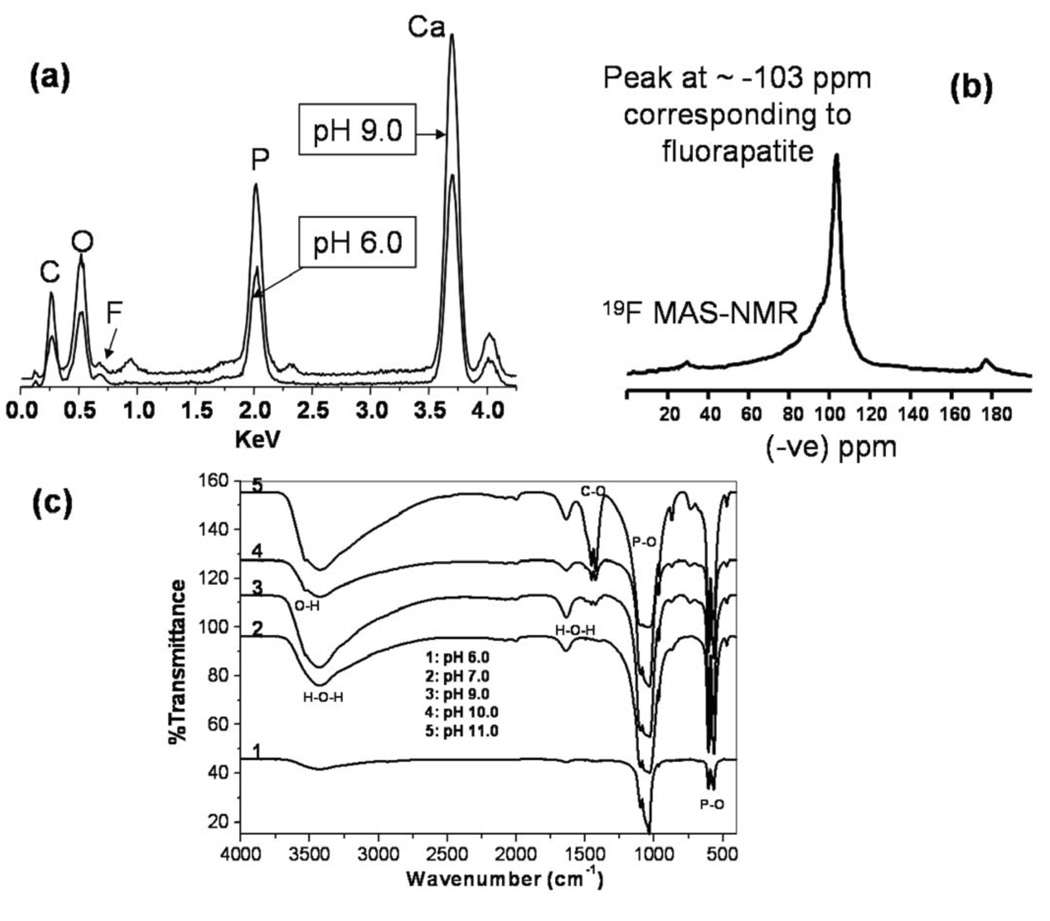
Figure 1 shows the synthetic crystals formed under ambient pressure without EDTA. This usually produced short FA nanorods. For instance, the synthetic crystals prepared at pH 6.0 or pH 11.0 and aged at 70°C for 5 days have a similar length of approximately 20–50 nm and a cross section of approximately 10 nm (Figure 1a and b). The corresponding selected area electron diffraction (SAED) patterns (Figure 1c, d) indicate that all these synthetic nanorods have a typical apatite crystalline structure. The EDS data (Figure 2a) shows that the Ca/P ratio is between 1.6–1.7, which approaches the theoretical ratio of FA (Ca/P = 1.67). The strong and sharp peak of 19F resonance at −103 ppm in 19F MAS-NMR measurement clearly evidences the presence of F in the nanorod (Figure 2b). The FTIR spectra (Figure 2c) shows the synthetic FA nanorods prepared at different pH’s. The P-O bond of the phosphate group’s stretching and bending vibration remained in the same position at 1096 cm−1, 1032 cm−1, 964 cm−1, 604 cm−1, 564 cm−1 for all pH’s, while the stretching vibration mode of the carbonates at 1424 cm−1, 1453 cm−1 and the stretching vibration mode of the OH ions at 3570 cm−1 increased as the pH increased.15 We have also tried precipitation of the above solution under mild hydrothermal conditions (121 °C and 2 atm). The crystals do not grow any longer even after autoclaving for 6 hours at 120 °C and under 2 atm pressure. Generally the longer crystals are difficult to synthesize using the above precipitation solution.
Figure 1.
TEM image of the synthetic crystals prepared at (a) pH6.0; (b) pH11.0; 70 °C, ambient pressure for 5 days; SAED pattern of the synthetic crystals prepared at (c) pH6.0; (d) pH11.0; lattice planes corresponding to several rings have been indicated in c and d.
Figure 2.
(a) EDS of FA nanorods prepared at different pH’s; (b) 19F MAS-NMR of FA nanorods prepared at pH 7.0; (c) FTIR spectra of synthetic FA crystals prepared at different pH’s.
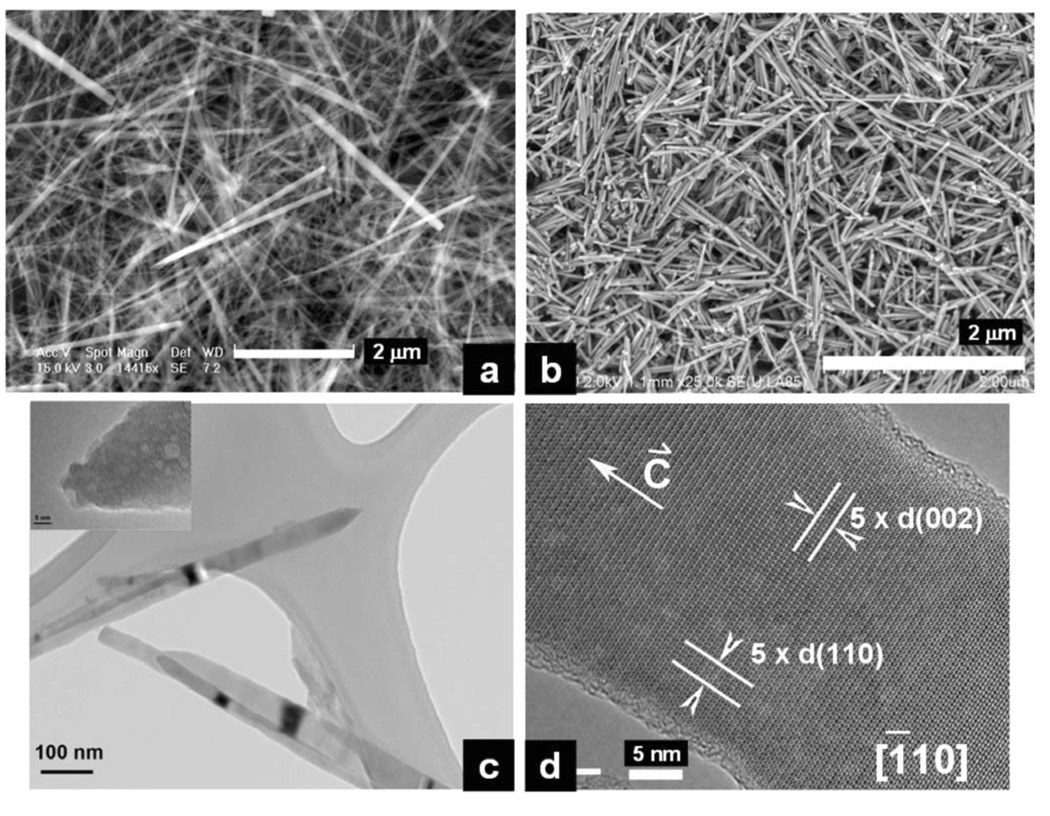
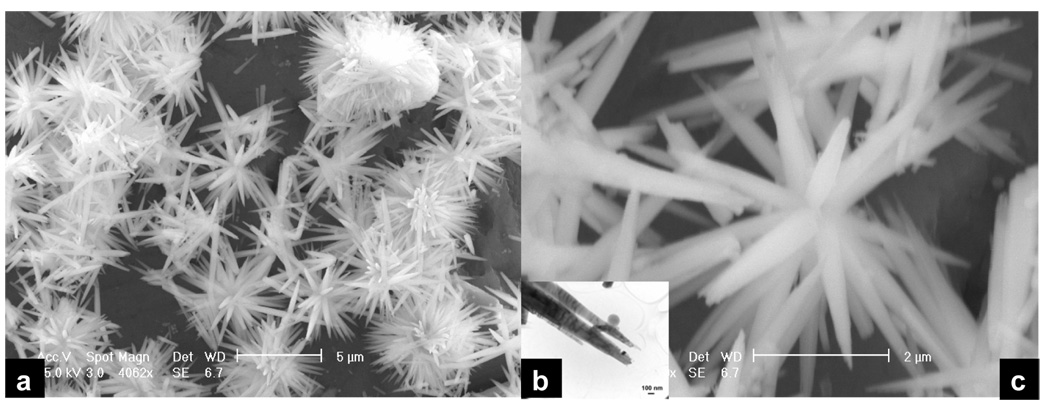
However, when the EDTA is added to the solution, we are able to produce longer FA crystals under mild hydrothermal conditions (121 °C and 2 atm). The solution precipitation is sensitive to pH. When the pH of the solution is in the range of 7–12, no precipitation occurs even after autoclaving. However when the pH of the solution is in the range of 4–6, precipitates are formed. Figure 3 shows that those crystals prepared at pH 6.0 in the presence of EDTA and treated for 6 hours hydrothermally have a length of approximately 1–5 µm and a cross section of approximately 30–100 nm (Figure 3a). These crystals have very similar dimensions to those enamel crystals isolated from rat incisors (Figure 3b).13, 16 The higher resolution TEM images show these crystals to be spear-like having a sharp point (Figure 3c). The HRTEM images of these crystals display a typical apatitic structure (Figure 3 e). In Figure 4 are images of the crystals obtained at pH 5.0 in the presence of EDTA and treated for 6 hours hydrothermally. They have a length of 1–5 µm and a cross section of approximately 30–100 nm but aggregate together. Figure 5 shows the crystals obtained at pH 4.0 in the presence of EDTA and treated for 6 hours. They form flower-like structures (Figure 5a and c), the extremities of which are made of many small branches (Figure 5b).
Figure 3.
(a) SEM image of long FA nanorods / nanowires prepared at pH 6.0 in the presence of EDTA and treated for 6 hours hydrothermally at a temperature of 121 °C and pressure of 2 atm; (b) SEM image of enamel crystals isolated from maturation stage of rat incisor enamel. The isolation methods see Chen et al., 2003 and 2005; (c) TEM image of the long needle-like synthetic FA nanorods / nanowires; (d) HRTEM image of the long synthetic FA nanorods / nanowires.
Figure 4.
SEM image of long FA nanorods / nanowires prepared at pH 5.0 in the presence of EDTA and treated for 6 hours hydrothermally at a temperature of 121 °C and pressureof 2 atm. (a) low power of SEM image shows many nanorods / nanowires are from a common nucleate; (b), (c) high power of SEM images of the nanorods / nanowires.
Figure 5.
SEM image of long FA nanorods / nanowires prepared at pH 4.0 in the presence of EDTA and treated for 6 hours hydrothermally at a temperature of 121 °C and pressure of 2 atm. (a) low power SEM image show the flower-like structures; (b) TEM image shows that each end of the branch of the flower-like structure is made of many small branches; (c) SEM image of one of the flower-like structure.
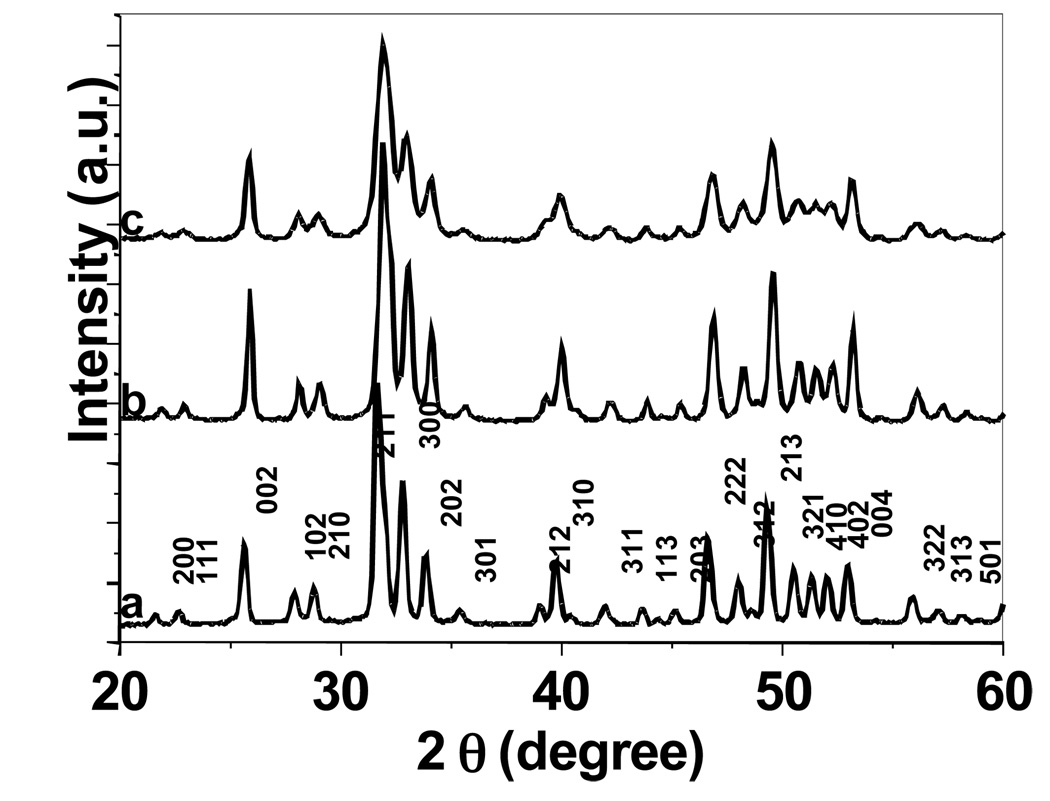
In order to further confirm the phase composition and crystallinity of these synthetic crystals produced with or without the presentation of EDTA, we have conducted powder X-ray diffraction pattern analysis (Figure 6). All of the diffraction peaks can be readily indexed to a pure hexagonal phase with the lattice constants a = 9.381 and c = 6.912 , which is in accordance with that of synthetic fluorapatite.3 However, the crystals prepared under low pH (Figure 6a) have a better crystallinity than those of prepared at neutral pH (Figure 6b) and at high pH (Figure 6c). Several of the peaks in Figure 6c are much broader than those seen in Figure 6a. This is reasonable as the crystals prepared under pH 4.0 with the presence of EDTA are much larger than those prepared under pH 10.0 without EDTA.
Figure 6.
Power X-ray diffraction (XRD) patterns of synthetic FA crystals prepared at a) pH 4.0 with the presence of EDTA; b) pH 7.0 without EDTA; c) pH 10.0 without EDTA.
DISCUSSION
The FTIR spectra showed that the P-O bond of the phosphate group’s stretching and bending vibration remained in the same position at 1096 cm−1, 1032 cm−1, 964 cm−1, 604 cm−1, 564 cm−1 for all pH’s. This indicates that all these prepared nanorods retained the same apatite crystalline structure at the experimental pH range of 6–11. The stretching vibration mode of the carbonates at 1424 cm−1, 1453 cm−1 and the stretching vibration mode of the OH ions at 3570 cm−1 increased as the pH increased. This shows that the crystals have incorporated more carbonate and hydroxyl ions at high pH than those at low pH. The carbonate increase is possibly due to the absorption of carbon dioxide from the air at high pH. The crystals prepared at pH = 11 appeared to be carbonated fluor-hydroxyapatite with a very sharp peak at 1424 and 1453 cm−1 and a peak at 3570 cm−1. This result indicates that abundant carbonate and hydroxyl ions were incorporated into the FA crystals at high pH, although the crystalline structure of apatite was maintained.
It should be noted that the F signal is not strong in energy-dispersive X-ray spectra (Figure 2a). This is because of high energy TEM electron beam damage during the EDS data acquirement. Fluorine is a light element and is easily released when bombarded by the high energy electron beam.17 However, 19F MAS-NMR data clearly shows the strong and sharp peak of 19F resonance at −103 ppm (Figure 2b). This is the typical 19F chemical shift of fluorapatite.18 Furthermore chemical analysis of these synthetic crystals also confirmed that the ratio of Ca/P/F is close to the theoretical value of Ca5(PO4)3F.
The precipitatation of FA is senstive to the pH of solutions. When the FA is formed without the presence of EDTA, the pH increase will result in the release of PO4 3− and F− from their other forms H3PO4, H2PO4−, HPO42− and HF. This will help the formation of Ca5(PO4)3F. As the pH increased, the OH− will incorporate into the crystals to form Ca5(PO4)3(F, OH). Also the carbonates dissolved from the atmosphere will incorporate into the fluorapatite since the specific structure and chemistry of apatite allow for numerous substitution of cations and anions for Ca2− , PO4 3− and F− or OH−.19 Interestingly in comparison to our previous study on HA formation,13 under the same pH the FA has incorporated more carbonates into its crystal structure than those of HA. This is probably because of the co-precipitation of F− and CO32− into the apatite structure to replace the PO43−.20 This will lead to the formation of fluor-carbonate-hydroxyapatite which is thought to be the main composition of biological apatite of human tooth enamel.
The formation of FA crystals is determined by two processes. One is the initiation of nucleation and the other is the continued growth of the nucleate. Without the presence of the EDTA, when the pH of solution is increased by adding ammonium hydroxide, a large quantity of FA crystals will quickly nucleate from the highly supersaturated FA solution. The free ions are quickly consumed and therefore, the crystal growth will cease, which usually leads to the formation of the short nanorods. Because of the very low solubility of the FA crystal and low concentration of the free Ca2+ and PO43− ions in the solution, even under the mild hydrothermal conditions the dimension of FA crystals will not change dramatically.
In the presence of EDTA, the EDTA will chelate strongly with Ca2+. Under low temperature, the Ca2+ is stabilized by EDTA which will dramatically decrease the concentration of free Ca2+ in the solution. Thus even under the high pH, the solution is clear and no precipitates formed due to the low supersaturation of the solution. The chelating ability of EDTA to Ca2+ also depends on the pH of the solution. EDTA can exist in seven forms: H6Y2+, H5Y+, H4Y, H3Y−, H2Y2−, HY3− and Y4−. Because the most negative anions like Y4− are the ligand species with the strongest complexing ability, the larger the fraction of more negative anions, the more stable of the complex. When the pH value of the solution is above 7, the more negative anions HY3−, Y4− will predominate, therefore with increasing pH, the stability of the complex is improved.10 This is why at high pH, even under the mild hydrothermal conditions, Ca2+ is not released and this prevented the formation of the FA. Only at low pH, is it possible to release enough Ca2+ for the formation of FA. At low pH for example pH 4, the chelated Ca2+ is not stable under hydrothermal conditions resulting in the explosive release of Ca2+ which produces a large quantity of nucleates and / or nucleates of a large size. These large nucleates will aggregate together and adopt a spherical structure in order to keep their surface energy low. Each spherical structure will have many active growth sites and the further release of the Ca2+ will result in the growth of the FA crystals from these sites. Since the size of each nucleate on the spherical aggregate is large, many defects will form during the nucleate’s fast growth, that will produce small branches at the end of the crystal. This is similar to that described in a recent report concerning ZnO’s branching growth structure.21 The enhancement of the stability of Ca-EDTA complex with the increase of the pH to 5 will result in the formation of smaller spherical structures containing smaller nucleates for further growth compared to those at pH 4. Due to the small size of nucleates, only single nanorod (or nanowire) forms from each nucleate. Therefore we cannot see the branching structures from the nanowires in Figure 4. When the pH is increased to 6, because of the stronger chelating of Ca2+ to EDTA, the nucleates are both small in size and in quantity. Each individual nucleate will develop into individual single nanorods (or nanowires). This leads to the formation of individual well-separeated, long nanorod (or nanowires) formation as shown in Figure 3. The FA crystals may grow faster in one of the polar [001] directions (either Ca2+ positive face or PO4 3− negative face). The fastest growth direction will form the leading tip due to diffusion-limited growth, which results in a spear-like crystal formation with one end of the crystal being sharper than the other.10, 22, 23
In summary, the present work shows we are able to synthesize FA nanorod / nanowire of different composition, shape and size at low temperature or mild hydrothermal conditions by simply controlling the pH and using EDTA as a stabilizer in the precipitation solution. These nanorods and / or nanowires may have potential use in dentistry and medicine.
ACKNOWLEGEMENTS
The author (H. Chen) thanks Dr. David J. Wood and Dr. Robert G. Hill for their valuable discussion on the MAS-NMR of fluorapatite; Mr. Jim Liddle from Hitachi High Technologies America for imaging the enamel crystals; Ms. Ying Qi and Mr. Jihua Chen for XRD analysis. This investigation was supported by USPHS Research Grant DE121899, DE015599 from the National Institute of Dental Research, National Institutes of Health, Bethesda, MD 20892 and the Department of Cariology, Restorative Sciences and Endodontics, the University of Michigan. The JEOL-2010F STEM/TEM used for this investigation was funded by National Science Foundation Grant DMR-9871177.
REFERENCES
- 1.Robinson C, Kirkham J, Shore RC, editors. Dental Enamel – Formation to Destruction. Boca Raton, FL: CRC Press; 1995. [Google Scholar]
- 2.Dahm S, Risnes S. Calcif Tissue Int. 1999;65:459. doi: 10.1007/s002239900733. [DOI] [PubMed] [Google Scholar]
- 3.Bayliss P, Erd DC, Mrose ME, Sabina AP, Smith DK, editors. Mineral Powder Diffraction File Data Book. Swarthmore, PA, USA: JCPDS International Centre for Diffraction Data; 1986. p. 383. Powder Diffraction File Number: 15–876. [Google Scholar]
- 4.Smith DK. In: Hydroxyapatite and Related Materials. Brown PW, Constantz B, editors. Boca Raton, FL: CRC Press; 1994. p. 29. [Google Scholar]
- 5.Clarkson BH. Adv. Dent. Res. 1991;5:41. doi: 10.1177/08959374910050010501. [DOI] [PubMed] [Google Scholar]
- 6.Robinson C, Connell S, Kirkham J, Brookes SJ, Shore RC, Smith AM. Caries Res. 2004;38:268. doi: 10.1159/000077766. [DOI] [PubMed] [Google Scholar]
- 7.Yamagishi K, Onuma K, Suzuki T, Okada F, Tagami J, Otsuki M, Senawangse P. Nature. 2005;433:819. doi: 10.1038/433819a. [DOI] [PubMed] [Google Scholar]
- 8.Cao M, Wang Y, Guo C, Qi Y, Hu C. Langmuir. 2004;20:4784. doi: 10.1021/la0498197. [DOI] [PubMed] [Google Scholar]
- 9.Zhang HG, Zhu QS, Wang Y. Chem. Mater. 2005;17:5824. [Google Scholar]
- 10.Liu J, Li K, Wang H, Zhu M, Xu H, Yan H. Nanotechnology. 2005;16:82. [Google Scholar]
- 11.Peytcheva A, Colfen H, Schnablegger H, Antonietti M. Colloid Polym. Sci. 2002;280:218. [Google Scholar]
- 12.Beniash E, Simmer JP, Margolis HC. Journal of Structural Biology. 2005;149:182. doi: 10.1016/j.jsb.2004.11.001. [DOI] [PubMed] [Google Scholar]
- 13.Chen H, Clarkson BH, Sun K, Mansfield JF. J. Colloid Interface Sci. 2005;288:97. doi: 10.1016/j.jcis.2005.02.064. [DOI] [PubMed] [Google Scholar]
- 14.Suchannek W, Yoshimura W. J. Mater. Res. 1998;13:94. [Google Scholar]
- 15.Koutsopoulos S. J. Biomed. Mater. Res. 2002;62:600. doi: 10.1002/jbm.10280. [DOI] [PubMed] [Google Scholar]
- 16.Chen H, Chen Y, Orr BG, Banaszak-Holl MM, Majoros I, Clarkson BH. Langmuir. 2004;20:4168. doi: 10.1021/la0303005. [DOI] [PubMed] [Google Scholar]
- 17.Cameron M, Wang LM, Crowley KD, Ewing RC. In: Bailey GW, Small JA, editors. Proceedings of the 50th Annual Meeting of the Electron Microscopy Society of America; San Francisco, California: San Francisco Press; 1992. p. 378. [Google Scholar]
- 18.Miller JM. Progress in Nuclear Magnetic Resonance Spectroscopy. 1996;28:255. [Google Scholar]
- 19.Hughes JM, Rakovan J. Reviews in Mineralogy and Geochemistry. 2002;48:1. [Google Scholar]
- 20.Knudsen AC, Gunter ME. Reviews in Mineralogy and Geochemistry. 2002;48:361. [Google Scholar]
- 21.Wang RC, Liu CP, Huang JL, Chen SJ. Appl. Phys. Lett. 2005;86:251104. [Google Scholar]
- 22.Wang ZL, Kong XY, Zuo JM. Phys. Rev. Letts. 2003;91:185502. doi: 10.1103/PhysRevLett.91.185502. [DOI] [PubMed] [Google Scholar]
- 23.Sander LM. Contemporary Physics. 2000;41:203. [Google Scholar]


