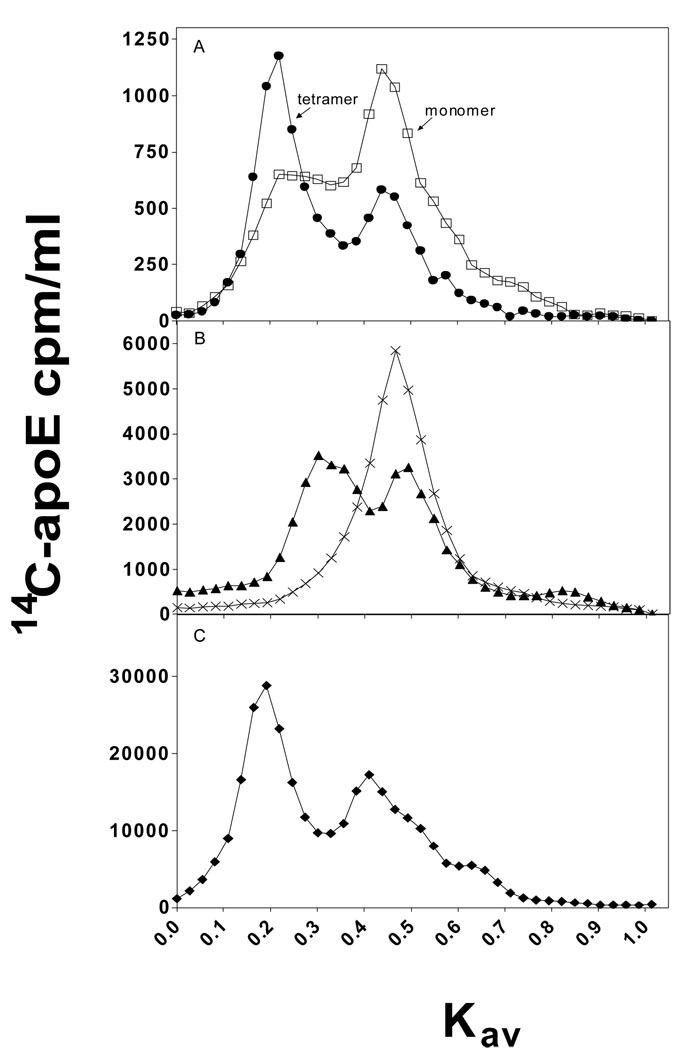
Fig. 6. Elution profiles upon gel filtration of apoE3 and apoE4 variants on a Superdex 200 column.
Proteins at a concentration of 5 µg/ml (Panel A and B) or 50 µg/ml (Panel C) were subjected to gel filtration. (A) Full-length apoE3 (●), full-length apoE4 (□); (B) apoE3 (1–272) (▲), apoE4 (1–272) (×); (C) apoE4(E255A) (◆). Representative profiles from at least 3 independent experiments using different batches of protein are shown.

