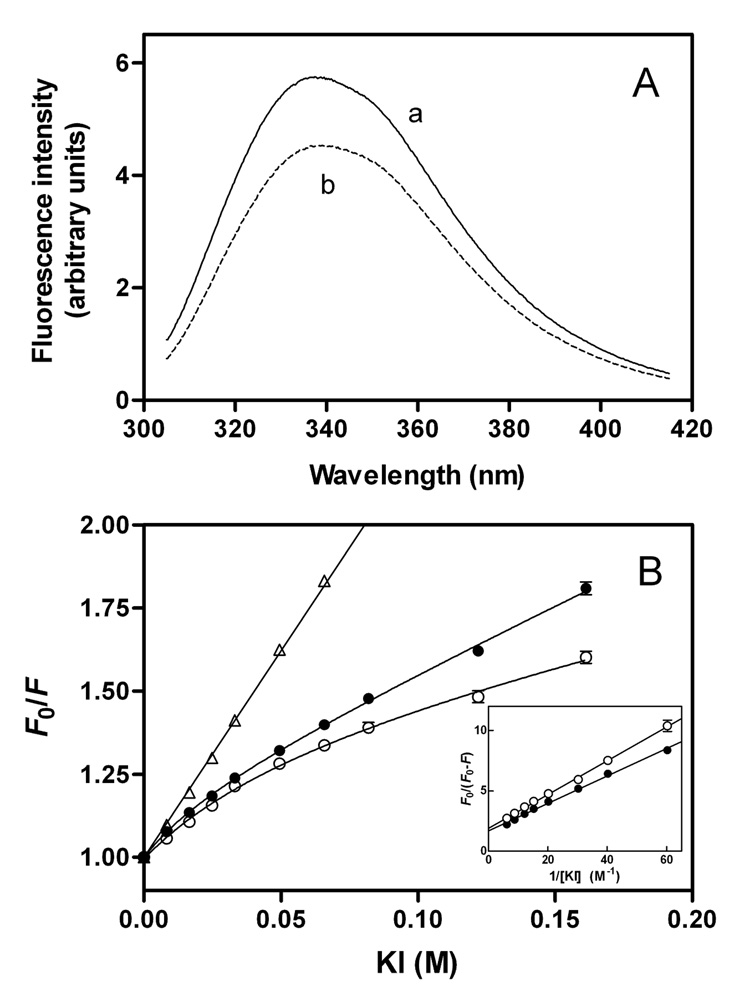
Fig. 7. Fluorescence spectroscopy of apoE3 and apoE4 single Trp mutants.
Solutions of the proteins (100 µg/ml) were excited at 295 nm to obtain the emission fluorescence from W264. (A) Fluorescence spectra for apoE3 W@264 (a) and apoE4 W@264 (b). (B) Stern-Volmer plot comparing quenching by KI of W264 fluorescence from apoE3 (○) and apoE4 (●). The data for N-acetyltryptophanamide are also shown for comparison (△). The inset shows a modified Stern-Volmer plot. The results from 2–4 independent experiments, each done in triplicate, are shown.

