Abstract
Results are presented illustrating the use of tip enhanced Raman spectroscopy and imaging in a top-illumination geometry. A radially polarized beam is used to generate an electric field component in the direction of beam propagation, normal to the surface, resulting in a 5× increased enhancement compared to a linearly polarized beam. This multiplicative enhancement facilitates a discrimination of the near field signal from the far field Raman background. The top illumination configuration facilitates the application of TERS for investigating molecules on a variety of surfaces, such as Au, glass, and Si. The near field Raman spectrum is presented of Si(100), rhodamine B, brilliant cresyl blue, and single wall carbon nanotubes. Sufficient enhancement is obtained to permit a sub-diffraction limited resolution Raman imaging of the surface distribution of large bundles of carbon nanotubes of various diameters.
Keywords: TERS, Raman, near-field, microscopy, imaging, vibrational spectroscopy, radial polarization
Introduction
Tip enhanced Raman spectroscopy (TERS) is rapidly developing into a viable method of exploring chemical and molecular properties of nanostructures.1-4 Vibrational spectroscopy has long been recognized as a useful method for identifying chemical and molecular properties of samples based on a material's intrinsic vibrational modes.5 Although infrared and Raman spectroscopies are accepted as non-perturbing, label free methods of characterization, the ability to distinguish the signal of a nanostructure from the surrounding signal is challenging due to limits established by the Abbe diffraction criterion. Raman spectroscopy, with visible excitation, commonly exhibits spatial resolutions of few hundreds of nanometers. In the presence of nanoparticles, large enhancements have been observed in Raman signals, suggesting highly sensitive, possibly single molecule, detection6 In TERS, a sharp tip or a nanoparticle affixed to a cantilever is used to generate a local lightning rod effect, generating a near-field enhancement.4,7,8 TERS, also referred to as apertureless near field Raman spectroscopy, is similar to surface enhanced Raman spectroscopy, in which light incident on a metal nanostructure results in a local electric field enhancement that amplifies the Raman scattering from molecules by several orders of magnitude, commonly 104.9 The magnitude and range of the enhanced electric field is related directly to the size and shape of the tip combined with the characteristics of the laser beam illuminating the tip, often allowing sub-diffraction limit spatial resolution.
The sensitivity of TERS has been demonstrated as a spectroscopic method detecting, for example, resonantly enhanced dyes,10,11 carbon nanotubes,8,12 DNA,13-15 bacteria cells,16 and strained Si.17 A significant problem that has limited the utility of TERS thus far is the deconvolution of the large far-field signal excited by the entire laser spot from the smaller signal attendant to the localized enhancement of the tip. In the simplest case, the absence of a measurable far-field signal, the signal enhancement near the tip results in a detectable Raman signal representing the near field effect. Under these optimal conditions, carbon nanotubes were imaged and distinguished by diameter based on differences in their radial breathing mode frequencies.12 Other approaches have been demonstrated to enable discrimination of the near field signal from the far field background. One approach used for IR and florescence imaging is optical homodyne and hetrodyne detection. These techniques take advantage of non-linear tip-sample interactions in the near field. Using lock-in techniques, optical signals generated at the AFM tip tapping mode frequency (and its higher harmonics) can be extracted from a larger background signal.4 While these schemes have been demonstrated to work well for single channel imaging, it comes at the cost of spectroscopic information. Other approaches have demonstrated that differences in the polarization of the near-field and far-field signals can be used to enhance the contrast between them.9
TERS enhancement depends specifically upon the orientation of the electric field along the tip axis4 On opaque surfaces, this is readily accomplished using side illumination optics where the angle of incident light can be adjusted to insure optimal coupling.18 The spot size resulting from side illumination, however, is larger than at normal incidence, giving rise to a larger far-field signal that increases the background observed along with near field signal. For microscopes with NA < 1.3, illumination normal to the surface presents a different challenge, since the resulting focused linearly polarized beam does not possess a significant field polarized along the tip axis. It has been demonstrated, however, that a field polarized along the tip axis is established for the focused radially polarized beam of the Hermite-Gaussian mode.19 The use of such a radially polarized beam was reported to produce substantial enhancement in near field scattering using a bottom illuminated configuration, i.e. the tip is illuminated through a transparent sample.20,21 In the present work, we demonstrate the use of a radially polarized beam in a top-illumination configuration. The increased interaction between the radially polarized beam and the tip results in a larger near field signal, which when combined with the minimized far field signal, permits the determination of the near field signal and allows sub-diffraction limited imaging on both transparent and opaque samples.
Experimental
Si(100) wafers, rhodamine B, and brilliant cresyl blue were purchased from Sigma Aldrich and used as received without further purification. Glass substrates were soaked in nitric acid and rinsed without copious amounts of double-distilled water prior to use. Au substrates were prepared by thermal evaporation of 20 Å Cr followed by 300 Å Au onto a clean Si(100) wafer. Rodamine B and brilliant cresyl blue samples were prepared by soaking the appropriate substrate in a 10 μM ethanolic solution for at least 2 hours, followed by rinsing with absolute ethanol to remove non-adsorbed dye molecules. Single walled carbon nanotubes (SWCNT) produced by the high pressure CO (HiPCO) method were used in these studies. SWCNT's were dispersed onto substrates by sonicating the substrate in a SWCNT-benzene suspension.
The TERS microscope is comprised of a Nanonics Multiview 2000 AFM and a Renishaw In Via Raman microscope as illustrated in Figure 1 and similar to that originally reported by Sun and Shen.22,23 For TERS measurements, the Raman microscope utilizes an Olympus 50× long working distance objective with a working distance of 15 mm and a NA = 0.45. The excitation laser source is a 514 nm diode laser, providing approximately 3 mW of power incident on the sample. The Raman spectrometer is equipped with a 514 nm edge filter for rejection of Rayleigh scattering and an 1800 grooves/mm grating to spectrally resolve the collected scattered light onto the CCD camera. The AFM is equipped with a Nanonics Supertips, LTD. TERS probe consisting of a Au-Ag or Au spherical nanoparticle, of less than 200nm diameter, affixed to a glass cantilever mounted on a tuning fork. The AFM is operated utilizing phase feedback in a tapping mode. This configuration provides minimal contact between the probe and the sample.
Figure 1.
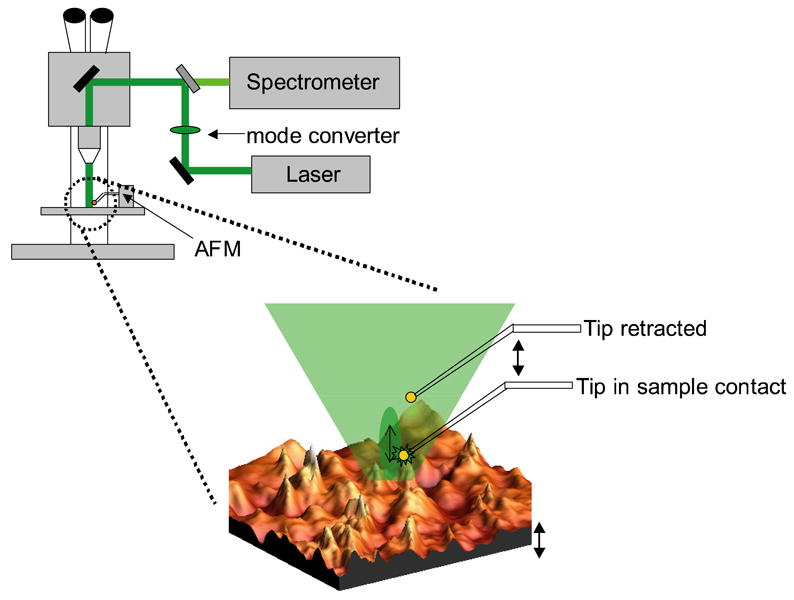
A schematic illustration of the top-illumination experimental set-up, the AFM is mounted on the sample stage of an upright microscope. The mode converter inserted in the excitation beam path radially polarizes the laser beam. At the sample (blow-up region) this results in electric field component normal to the surface interacting with the tip. The near field is measured when the tip is in sample contact, while displacing the tip vertically with the upper piezo device permits measurement of the far field signal. The lower piezo device maintains the sample position with respect to the laser focus and engaged tip. Double-headed arrows indicate the independent piezo devices.
The laser beam mode was converted from a linearly polarized Gaussian mode into a radially polarized Hermite-Gaussian mode via a constructed mode converter as described in the literature.24 Briefly, the mode converter is constructed from 2 quartz half-wave plates for 514 nm light. One wave plate is cut into quadrants with the fast axis parallel/perpendicular to the cut. A second waveplate is cut into quadrants at 45° with respect to the fast axis. The mode converter is then assembled such that each quadrant rotates the polarization of light away from the center of the beam. The mode converter was inserted in the path of the laser beam before the dichroic mirror separating the excitation and collection paths. The mode quality was improved via a spatial filter formed by focusing the light through a pinhole and recollimating the transmitted radiation. The polarization characteristics of the radially polarized beam were verified at the output of the microscope objective.
Near field enhancement is determined by the difference between the TERS signal obtained with the AFM tip near the sample surface and the far field signal when the AFM tip is retracted from the surface. For quantifying the enhancement, a vibrational mode is fit to a Lorentz line shape with a cubic baseline correction using Grams AI 7.02. The determined peak areas are then used for comparative purposes. TERS imaging is accomplished using the piezo device controlling the sample to control height feedback of the AFM, while the piezo device controlling the tip is used to reproducibly retract and reposition the tip to measure the far-field spectral component. The hyperspectral imaging cube is created by pausing the AFM image collection at a selected interval and collecting a TERS spectrum, with the tip near surface, and a far field spectrum, with the tip retracted from the surface. Subtraction of the far-field spectrum, obtained with the tip retracted, from the TERS spectrum obtained with the tip near the surface generates the desired near-field spectrum. TERS images at selected frequencies are generated from the baseline corrected peak height of features in the near field spectrum. Processing of AFM images was accomplished using WSxM 4.0.
Results and Discussion
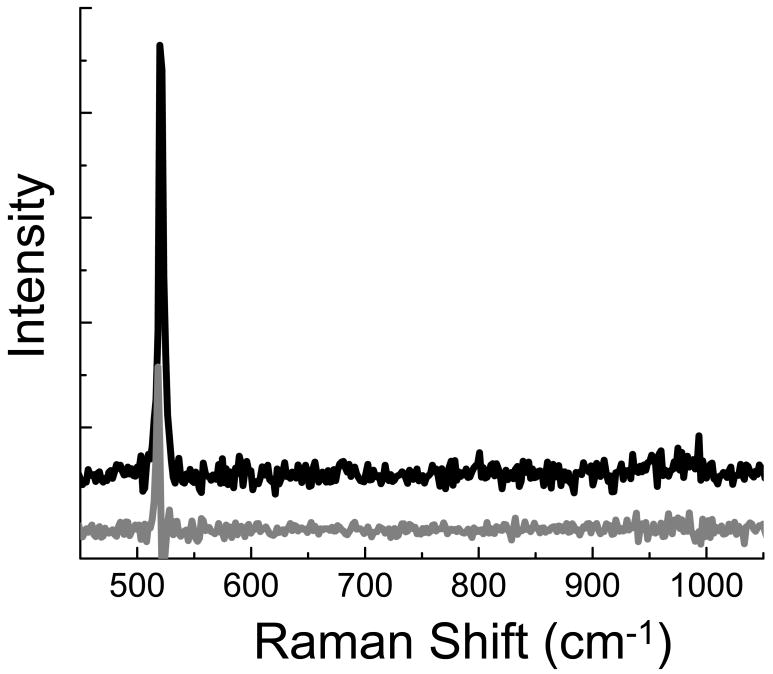
To characterize the effectiveness of the radially polarized beam for enhancing the Raman signal, TERS spectra were acquired from a Si(100) sample. TERS spectra were acquired using the mode converter to produce a radially polarized beam and the linearly polarized beam characteristic of the laser. Due to the high attendant signal resulting from bulk Si and the larger sampling volume examined in the far-field, withdrawing the tip produces a small, but measurable, decrease in the observed signal. The large far-field background in this example arises from the larger area of the laser focus combined with micrometer range penetration of the exciting laser beam which generates additional scattered photons from the bulk Si, as compared to the enhanced electric field area near the apex of the tip. The enhancement, however, can clearly be visualized by subtraction of the far field spectrum, obtained with the tip retracted, from the spectrum measured with tip near the surface. Shown in Figure 2 are the near field signals observed after subtraction of the far field signal. The radially polarized beam clearly produces a larger enhancement of the Si phonon at 520 cm-1 than is observed using linearly polarized illumination. Tight focusing of the radially polarized beam has been shown to generate a strong electric field polarized along laser beam propagation direction within the focus.19 The results here indicate that even under mild focusing, NA 0.45, a sufficient electric field component is generated along the illumination axis to yield an increased enhancement. The peak area of 520 cm-1 Si phonon was determined from a fit to a Lorentz lineshape. Comparison of the Si phonon peak areas indicates the radially polarized beam results in an average enhancement 5× greater than that observed with linearly polarized laser irradiation.
Figure 2.
Enhancement spectra generated using a radially polarized beam (black, upper) and a linearly polarized beam (gray, lower). The spectra are offset for clarity.
It is commonly noted in the TERS literature8 that the TERS enhancement is sensitive to the positioning of the tip with respect to the laser focus. Our experience indicates that locating the tip with respect to the laser spot is simplified using radially polarized light. This is not surprising as studies indicate, contrary to a linearly polarized beam, the focused radially polarized beam produces a substantial field component normal to the surface, along the direction of laser beam propagation.19 This field component is necessary for efficient coupling to and driving of the metallic nano-optic tip and thus generating the enhanced electric field.
A potential drawback of the illumination geometries with the tip and laser on the same side is shadowing effects, in which the tip obscures the laser from the sample and results in a variation of the far field signal. In a side-illumination geometry, these effects are unavoidable and result in a larger far-field signal with the tip retracted than is present with the tip in sample contact. In the presence of a large far field signal, this additional far field signal can mask the enhanced signal from the tip region. In the top-illumination geometry, we note shadowing to be less troublesome. In our configuration the tip does shadow part of the surface, but by retracting along the propagation direction of the laser, the shadowing on the sample appears relatively constant and does not result in noticeable variation of the far-field signal during tip retraction.
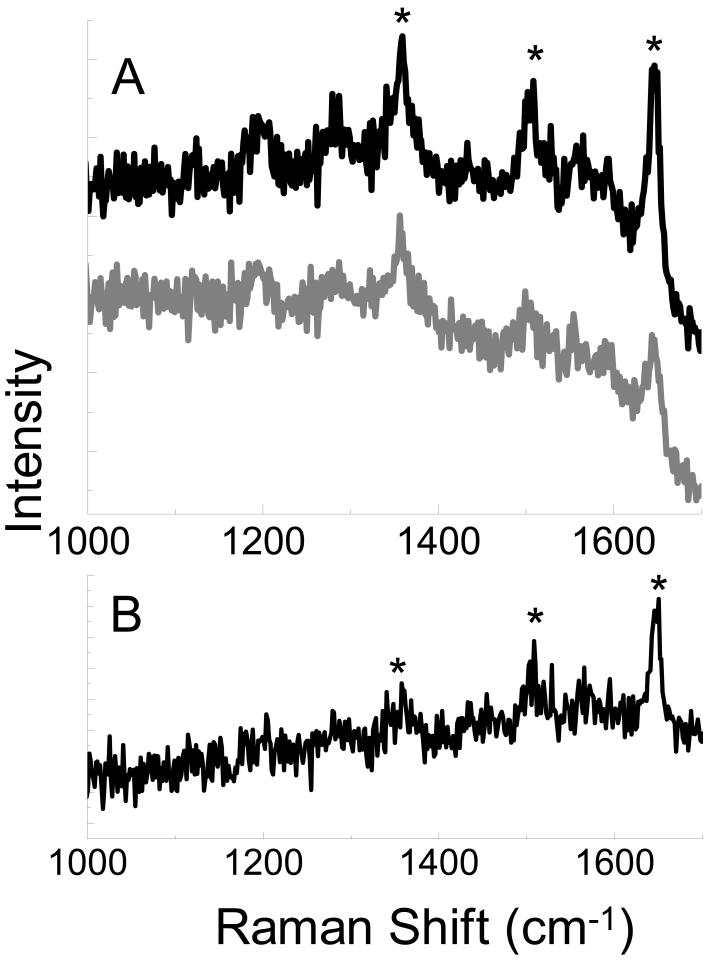
A significant advantage of the top-illumination configuration is the ability to interrogate both optically transparent and opaque surfaces. In addition to Si, Au and glass surfaces were also investigated. Figure 3a shows spectra obtained from rhodamine B on a Au film with the tip engaged with the sample and subsequently retracted 500 nm from the surface. It is worth noting, that the large fluorescence signal inherent to rhodamine is largely quenched by interactions with the Au substrate, in agreement with previous reports.10 Figure 3b shows the straightforward subtraction to produce the TERS enhancement spectrum. In the enhanced spectrum, the three prominent peaks at 1650, 1505, and 1360 cm-1, are evident. Attempts to observe the Raman spectrum of rhodamine B on glass are complicated by the large fluorescence background. The fluorescence signal is observed to dominate the spectrum with both the tip near the surface and retracted. This large fluorescence signal is not surprising due to the excitation wavelength's proximity to rhodamine B's adsorbtion maxima at 543 nm. The large fluorescence signal is observed to overwhelm the Raman peaks, preventing discrimination above the noise. The subtraction of the far field spectrum from the TERS spectrum does not exhibit any Raman peaks detectable above this noise (data not shown).
Figure 3.
TERS spectrum obtained from rhodamine B on Au with the AFM tip near the surface (black, A) and the far field spectrum obtained with the tip retracted from the surface (gray, A). Subtraction of the far field signal leaves the near field portion of the spectra (B). * denotes peaks at 1360, 1505, and 1650 cm-1 associated with rhodamine B.
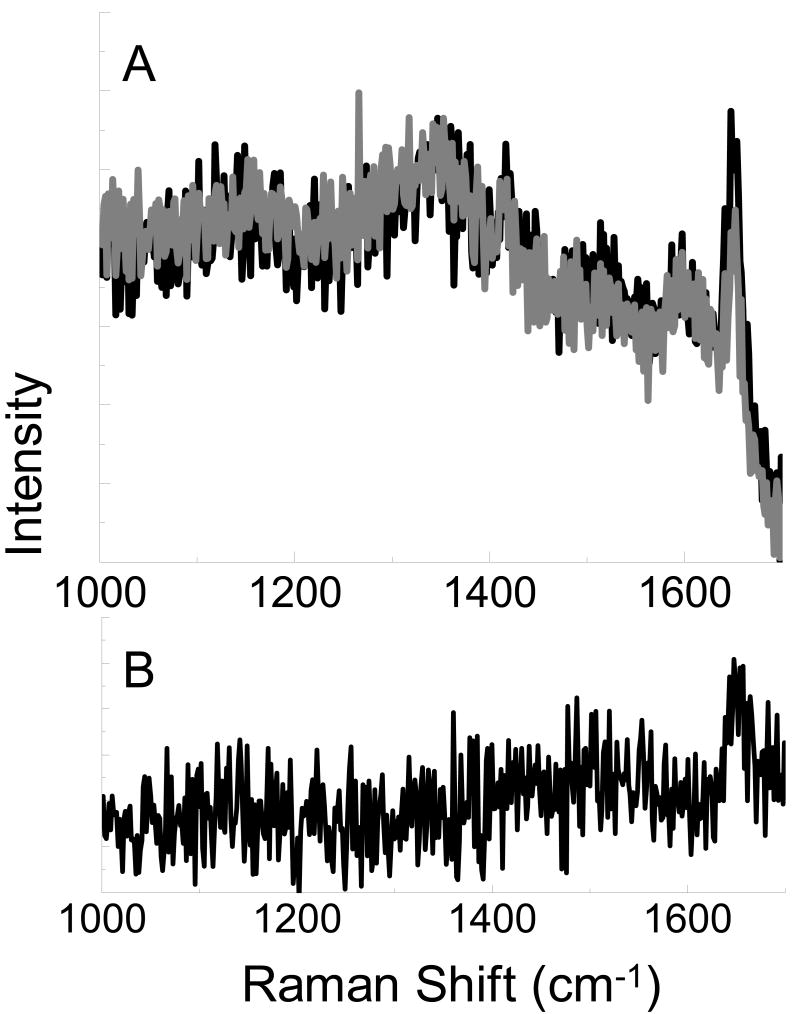
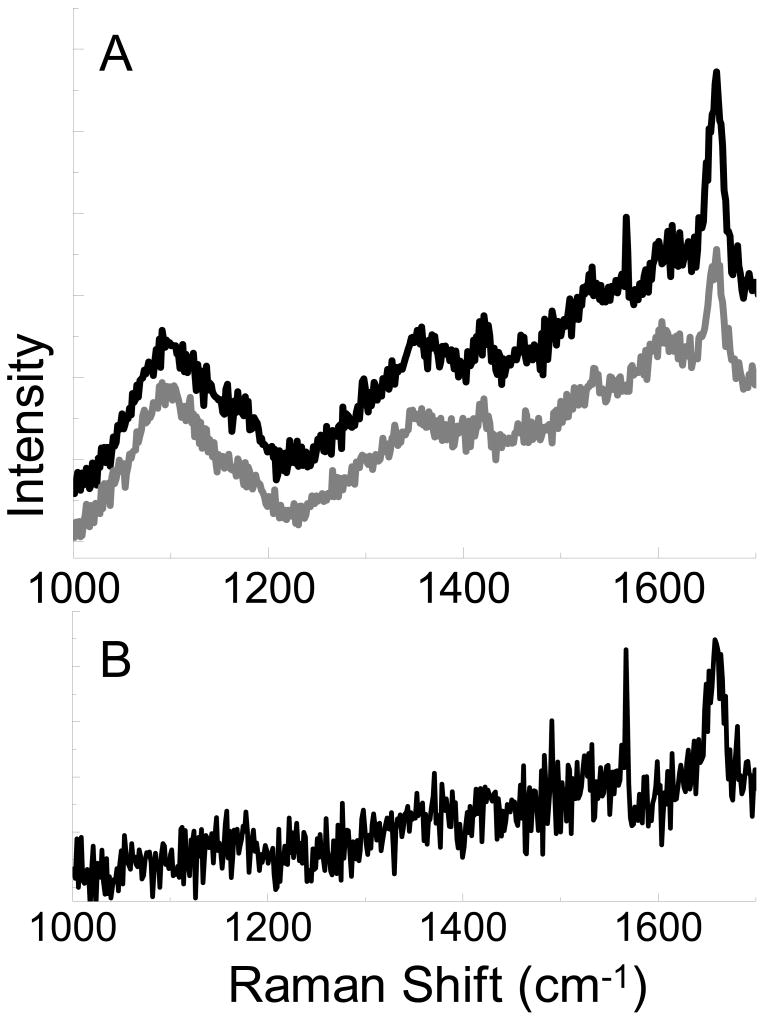
Brilliant cresyl blue ALD, with an absorbance maxima at 622 nm, was examined in an attempt to minimize the fluorescence background in the spectrum. In Figure 4, the spectrum of brilliant cresyl blue exhibits a strong peak at 1655 cm-1. The magnitude of this peak is clearly enhanced with the tip near the surface, when compared to the spectrum with the tip retracted, as evidenced by the persistence of the peak in the near field spectrum (Fig. 4b.). With the fluorescence emission shifted away from the region of interest, Raman peaks are visible in the spectrum of brilliant cresyl blue on glass in Figure 5a. The vibrational mode at 1655 cm-1 is again enhanced by the metal nanoparticle on the AFM tip, and is clearly visible in the enhancement plot shown in Figure 5b.
Figure 4.
Spectra obtained from brilliant cresyl blue on Au with the AFM tip near the surface (black, A) and retracted from the surface (gray, A). Subtraction of the far field signal leaves the near field portion of the spectra (B).
Figure 5.
Spectra obtained from brilliant cresyl blue on glass with the AFM tip near the surface (black, A) and retracted from the surface (gray, A). Subtraction of the far field signal leaves the near field portion of the spectra (B).
The results presented thus far demonstrate an enhanced signal effect obtained from the top illumination configuration using a radially polarized laser excitation mode. These samples provide test cases for a pseudo-homogeneous surface where the tip location should not influence the observed signal. Unlike the Si sample, the Raman signal of the dye samples is confined to the surface, evincing a lower magnitude far-field signal. In these samples the near-field contribution is recognizable from direct inspection of the spectra obtained with the tip near and retracted from the surface.
Theoretical studies have suggested the existence of strong field enhancements between a nanoparticle and a metallic surface.25,26 This was part of our original motivation for investigating Au substrates. However, comparison of the results for brilliant cresyl blue on Au and glass do not demonstrate this additional enhancement. This enhancement is expected to be wavelength dependent and possibly stronger at wavelengths other than that employed here. Fluorescent quenching by the metal surface may also diminish any resonant Raman enhancement, generating a higher signal on glass than would occur in the absence of resonance Raman factors. Interestingly, Pettinger et al. reported results27 from a Au coated STM tip and a Au surface that matched calculations26 that did not include additional enhancements from the surface. Additional studies clearly are needed to understand these interactions and possible enhancement mechanisms involving metallic surfaces.
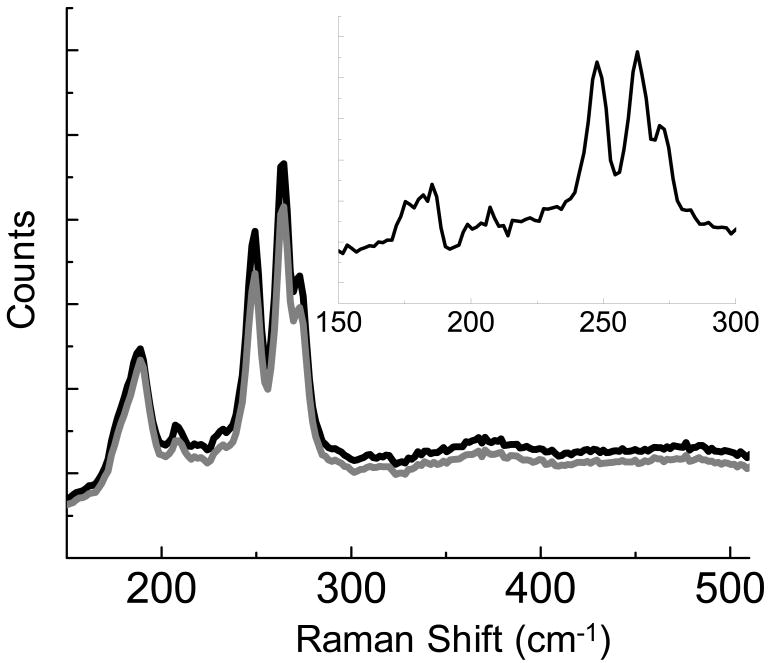
Single wall carbon nanotubes provide a sample that is chemically heterogeneous and varies on a length scale below that discernable by far-field Raman measurements. In Figure 6, the tip enhanced and tip retracted Raman spectra of SWCNT is observed from a bundle of nanotubes on a Au surface. The enhancement spectrum (Fig. 6 inset) indicates that several vibrational modes between 150-300 cm-1 are enhanced. These modes are assigned to radial breathing mode of the SWCNT and correlate to nanotubes with diameters between 9 and 13 Å.28 The HiPCO process, used to produce the nanotubes in this study, is known to generate nanotubes with an assortment of diameters.
Figure 6.
Spectra obtained from SWCNT on Au with the AFM tip near the surface (black) and retracted from the surface (gray). Subtraction of the far field signal leaves the near field portion of the spectra (inset).
By acquiring a series of TERS spectra, one with the tip near the surface followed by a spectrum with the tip retracted, and repeated over a set area, a point mapped Raman image is obtained. This is enabled by the matched piezo devices on the AFM, allowing highly reproducible positioning of the AFM tip at the surface following retraction. Spectra were acquired with a spacing of 195 nm. With the optics used, diffraction limited resolution is calculated to be 697 nm. The simultaneously point mapped Raman images show no distinct difference on a scale that encompasses the large signal variation attendant to the far-field signal. By subtraction of the two images, sub-diffraction spatial variation can be easily discerned in the near field maps shown in Figure 7. In Figure 7, frequencies that correspond to different nanotube diameters are plotted along with the topographical map obtained by the AFM. The frequencies plotted were chosen based on peaks observed in the enhancement spectrum. In the Raman near-field images, the red spots indicating high intensity are shown to correlate well with mounds of SWCNT observed in the AFM. Interestingly, variation is observed in the distribution of tube diameters, as not all nanotube sizes are symmetrically distributed in the images. In these maps, nanotube features are observed that are 200-300 nm in size. The significance of this is chemical heterogeneity is clearly mapped by Raman spectroscopy below the diffraction limit.
Figure 7.
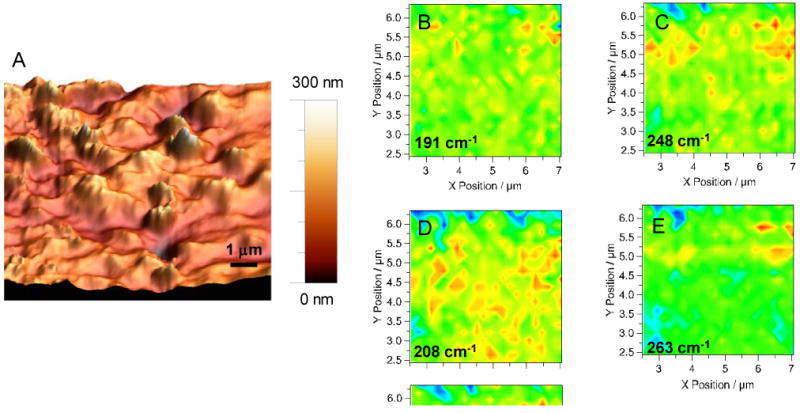
A 10 μm × 10 μm AFM topography image of bundles of SWCNT up to 300 nm in height dispersed on a Au surface are shown (A). Raman near field images obtained from the central region of the AFM scanning region at 191 (B), 248 (C), 208 (D), and 263 cm-1(E) are shown illustrating spatial variation in nanotube diameter across the sample. The micron position of the near field images is relative to the displayed AFM scan. In the near field images high intensity corresponds to a red color, while low intensity is a blue color.
Examination of topographic features in the AFM images indicates the smallest discernable feature to have a full width at half maximum of 125 nm. The resolution of the AFM is the convolution of the tip geometry and the surface feature. This is only slightly better than expected for a 200nm tip, suggesting that the tip vertex was smaller than reported. Increased spatial resolution can be accomplished by using tips affixed with smaller nanoparticles. The spacing between spectra can then be adjusted to sample at a desired spatial resolution. In this paradigm, the spatial resolution is limited by the smallest diameter nanoparticle that can be attached to a cantilever. The optical properties attendant to a nanoparticle also change as a function of size raising interesting questions for future investigation pertaining to nanoparticle size, spatial resolution, and near-field enhancement.
Conclusion
The results presented here demonstrate the use of a radially polarized laser beam is advantageous for performing TERS spectroscopy in a top-illumination geometry. Our results demonstrate that the near-field signal is distinguishable over the far field contribution in a variety of samples ranging from Si, to organic dyes, to carbon nanotubes. By acquiring a series of spectra with the tip near the surface and then retracted, a hyperspectral imaging cube of the near-field signal can be created that permits Raman imaging with sub-diffraction limit resolution.
Acknowledgments
We acknowledge support from the intramural program of the National Institute of Diabetes and Digestive and Kidney Diseases, National Institutes of Health.
References
- 1.Hartschuh A, Qian H, Meixner AJ, Anderson N, Novotny L. Surf Interface Anal. 2006;38(11):1472. [Google Scholar]
- 2.Pettinger B. Tip-enhanced Raman spectroscopy (TERS) Surface-Enhanced Raman Scattering: Physics and Applications. 2006:217. [Google Scholar]
- 3.Verma P, Inouye Y, Kawata S. Tip-enhanced near-field Raman scattering: Fundamentals and new aspects for molecular nanoanalysis identification. Surface-Enhanced Raman Scattering: Physics and Applications. 2006:241. [Google Scholar]
- 4.Novotny L, Stranick SJ. Annu Rev Phys Chem. 2006;57:303. doi: 10.1146/annurev.physchem.56.092503.141236. [DOI] [PubMed] [Google Scholar]
- 5.Levin IW, Bhargava R. Annu Rev Phys Chem. 2005;56:429. doi: 10.1146/annurev.physchem.56.092503.141205. [DOI] [PubMed] [Google Scholar]
- 6.Kneipp K, Kneipp H, Kneipp J. Accounts Chem Res. 2006;39(7):443. doi: 10.1021/ar050107x. [DOI] [PubMed] [Google Scholar]
- 7.Stockle RM, Suh YD, Deckert V, Zenobi R. Chem Phys Lett. 2000;318(13):131. [Google Scholar]
- 8.Hartschuh A, Sanchez EJ, Xie XS, Novotny L. Phys Rev Lett. 2003;90:9. doi: 10.1103/PhysRevLett.90.095503. [DOI] [PubMed] [Google Scholar]
- 9.Mehtani D, Lee N, Hartschuh RD, Kisliuk A, Foster MD, Sokolov AP, Maguire JF. Journal of Raman Spectroscopy. 2005;36(11):1068. [Google Scholar]
- 10.Pettinger B, Picardi G, Schuster R, Ertl G. Single Mol. 2002;3(56):285. [Google Scholar]
- 11.Domke KF, Zhang D, Pettinger B. Journal of the American Chemical Society. 2006;128(45):14721. doi: 10.1021/ja065820b. [DOI] [PubMed] [Google Scholar]
- 12.Yano T, Verma P, Kawata S, Inouye Y. Appl Phys Lett. 2006;88:9. [Google Scholar]
- 13.Rasmussen A, Deckert V. Journal of Raman Spectroscopy. 2006;37(13):311. [Google Scholar]
- 14.Ichimura T, Hayazawa N, Hashimoto M, Inouye Y, Kawata S. Phys Rev Lett. 2004;92:22. doi: 10.1103/PhysRevLett.92.220801. [DOI] [PubMed] [Google Scholar]
- 15.Domke KF, Zhang D, Pettinger B. Journal of the American Chemical Society. 2007;129(21):6708. doi: 10.1021/ja071107q. [DOI] [PubMed] [Google Scholar]
- 16.Neugebauer U, Rosch P, Schmitt M, Popp J, Julien C, Rasmussen A, Budich C, Deckert V. Chemphyschem. 2006;7(7):1428. doi: 10.1002/cphc.200600173. [DOI] [PubMed] [Google Scholar]
- 17.Hayazawa N, Motohashi M, Saito Y, Ishitobi H, Ono A, Ichimura T, Verma P, Kawata S. Journal of Raman Spectroscopy. 2007;38(6):684. [Google Scholar]
- 18.Picardi G, Nguyen Q, Ossikovski R, Schreiber J. Applied Spectroscopy. 2007;61(12):1301. doi: 10.1366/000370207783292109. [DOI] [PubMed] [Google Scholar]
- 19.Youngworth KS, Brown TG. Optics Express. 2000;7(2):77. doi: 10.1364/oe.7.000077. [DOI] [PubMed] [Google Scholar]
- 20.Hayazawa N, Saito Y, Kawata S. Appl Phys Lett. 2004;85(25):6239. [Google Scholar]
- 21.Novotny L, Sanchez EJ, Xie X Sunney. Ultramicroscopy. 1998;71(14):21. [Google Scholar]
- 22.Sun WX, Shen ZX. Ultramicroscopy. 2003;94(34):237. doi: 10.1016/s0304-3991(02)00334-0. [DOI] [PubMed] [Google Scholar]
- 23.Sun WX, Shen ZX. Journal of Raman Spectroscopy. 2003;34(9):668. [Google Scholar]
- 24.Quabis S, Dorn R, Leuchs G. Appl Phys B-Lasers Opt. 2005;81(5):597. [Google Scholar]
- 25.Geshev PI, Dickmann K. Journal of Optics a-Pure and Applied Optics. 2006;8(4):S161. [Google Scholar]
- 26.Notingher I, Elfick A. Journal of Physical Chemistry B. 2005;109(33):15699. doi: 10.1021/jp0523120. [DOI] [PubMed] [Google Scholar]
- 27.Pettinger B, Domke KF, Zhang D, Schuster R, Ertl G. Phys Rev B. 2007;76:11. [Google Scholar]
- 28.Reich S, Thomsen C, Maultzsch J. Carbon Nanotubes: Basic Concepts and Physical Properties. Vol. 135 WILEY-VCH Verlag GmbH & Co. KGaA; Weinheim: 2004. Vibrational Properties. [Google Scholar]


