

Abstract
Recent developments in the field of protein separation allows for the analysis of qualitative and quantitative global protein changes in a particular state of a biological system. Due to the enormous number of proteins potentially present in a cell, sub-fractionation and the enrichment of specific organelles are emerging as a necessary step to allow a more comprehensive representation of the protein content. The proteomic studies demonstrate that a key to understand the mechanisms underlying physiological or pathological phenotypes lies, at least in part, in post-translational modifications (PTMs), including phosphorylation of proteins. Rapid improvements in proteomic characterization of amino acid modifications are further expanding our comprehension of the importance of these mechanisms.
The present review will provide an overview of technologies available for the study of a proteome, including tools to asses changes in protein quantity (abundance) as well as in quality (PTM forms). Examples of the recent application of these technologies and strategies in the field of kinase signalling will be provided with particular attention on the role of PKC in the heart. Studies of PKC mediated phosphorylation of cytoskeletal, myofilament and mitochondrial proteins in the heart have provided great insight into the phenotypes of heart failure, hypertrophy and cardioprotection. Proteomics studies of the mitochondria have provided novel evidences for kinase signalling cascades localized to the mitochondria, some of which are known to involve various isoforms of PKC. Proteomics technologies allow for the identification of the different PTM forms of specific proteins and this information is likely to provide insight into the determinants of morphological as well as metabolic mal-adaptations, both in the heart and other tissues.
1. Introduction
The term proteome has been first defined on 1994 as the “protein complement of the genome” during a meeting focused on broad based analysis using two-dimensional electrophoresis (Siena, Italy)(1). A few words should be spent on the meaning of this definition. Several biological mechanisms account for the discrepancies observed when trying to correlate gene (mRNA) and protein expression. The reasons why the phenotype of a biological system cannot be predicted solely on the basis of its genome reside at the post-transcriptional and post-translational levels (2). Alternative mRNA splicing, differential turn-over of mRNA and protein can affect the relation in between transcript and protein levels at the steady state. Post-translational modifications (PTMs), such as proteolysis, phosphorylation, glycosylation, etc. all contribute to the diversity of the proteome. PTMs probably represent the most important phenomenon that multiply the number of gene-products from a single transcript (3, 4). Phosphorylation is just one of more than 100 known PTMs (4, 5) and proteomic analysis is uncovering novel PTMs, even on previously well studied proteins, such as myosin light chain 1 (6), the β subunit of the F1F0 ATP synthase (7) and myosin binding protein C (8). In addition, proteomic analysis is providing evidence that proteins do not act as single players but eventually as part of complexes whose composition and subcellular localisation finally decide for their biological role (9, 10). Recently, Ping P and co-workers applied a functional proteomic approach to elucidate PKC signalling at cardiac level (11, 12). The authors formulated a “signaling module hypothesis” for PKC-mediated cardioprotection mechanism meaning that stress-activated proteins and signaling kinases may function collectively to produce the cardioprotective effect. This proteomics work uncovered an important interaction between PKC and proteins of the mitochondria.
Proteomics is a field strongly based on technologies. High-performance analytical techniques are needed to separate the enormous number of proteins constituting the proteome. Nevertheless, proteomics represents also an excellent example of how technical advances and new, powerful tools can give scientists a new perception of biological systems at the most basic level. Here we will discuss the technologies and applications of proteomics to the study of kinases and protein phosphorylation. To date, proteomics has been used to investigate only two PKC isoforoms (δ and ε) in context of heart diasease and these will be the focus of this present manuscript. However, it is our belief that a proteomic strategy would greatly improve our understanding of other PKC isoforms as well as all other kinases that are active in the heart. Therefore, the proteomic strategies and techniques that are the foundation of phosphoproteomics are applicable to the study of all PKC function in heart.
2. Proteomics tools
It is not clear how many proteins or the extent of protein PTMs that comprise the proteome of any cell including the cardiac myocyte. The human genome is roughly constituted of 30,000 genes and the number of proteins forming the proteome have been conservatively estimated at around 100,000, without taking in to account reversible modifications (13). As such, cellular subfractionation and multi-dimensional separation methods are required in order to separate this enormous number of analytes. It must be noted, that even so, only a portion of the proteome or subproteome can be observed, but technological advances are rapid and we expect continued increases in proteome coverage. Nowadays, multi-dimensional electrophoretic (gel-based, 2DE) as well as chromatographic (gel-free, 2DLC) techniques are used for this purpose (see below). Due to the unique capacities of each of these two analytical approaches such methods are complementary (14, 15). In order to quantify differences in the abundance of a protein when comparing two proteomes, classically obtained from a diseased and a normal state, proteins need to be visualised. A strong limit of current proteomic techniques is represented by the lack of a detection system able to encompass the 7 to 12 order of magnitude range defining protein abundance. Protein detection is generally achieved by means of UV detectors able to excite the backbone of proteins in chromatographic techniques whereas protein dyes are used in the electrophoretic approach. Finally identification of the purified protein can be obtained through mass spectrometry (MS). An overall work flow following the possible strategies of a proteomics experiment is presented in Figure 1.
Figure 1. Proteomics workflow.
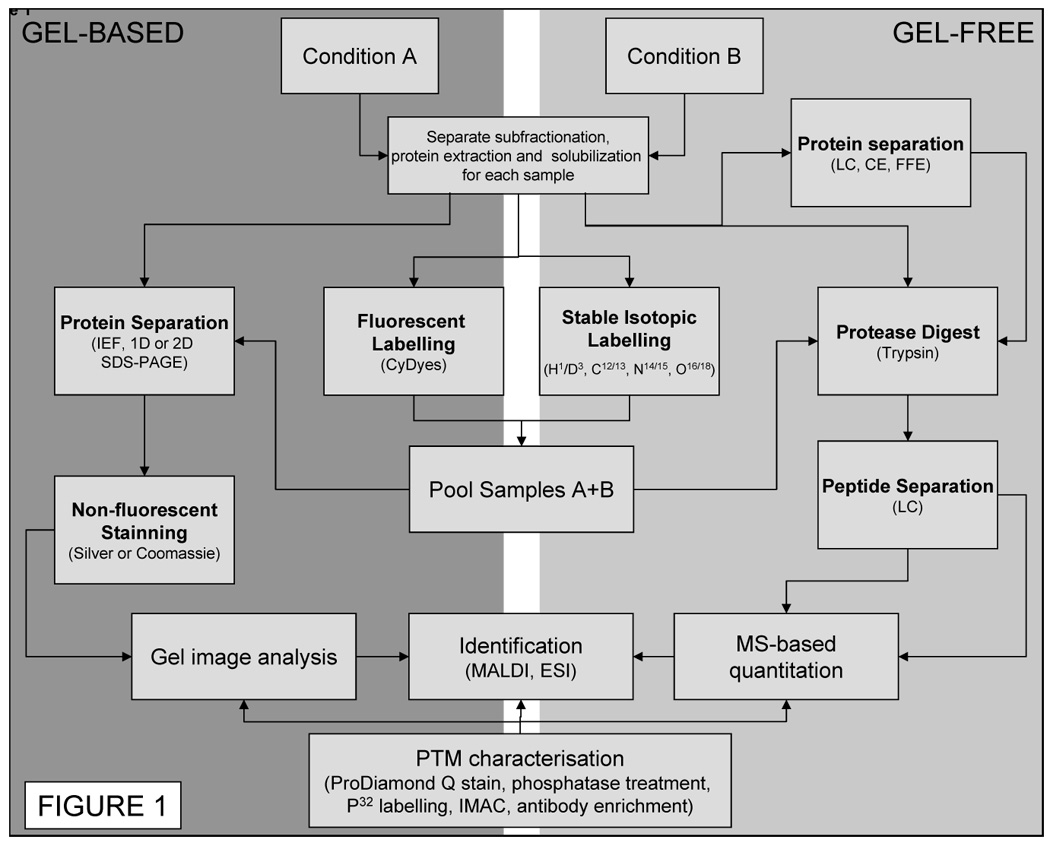
Protein extracts obtained from 2 or more conditions can be submitted to multi-dimensional gel-based (1 or 2DE), gel-free separation (LC, liquid IEF, CE, FFE) as well as combined techniques. Identification of the purified protein can be obtained through mass spectrometry (MS or MS/MS). Relative quantitation (comparison) can be achieved by using fluorescent dyes (DIGE) in gel-based techniques. Stable isotopes are used for gel-free ones enabling protein abundance comparison through MS. Higher confidence in protein identification as well data on PTM localization can be obtained by MS/MS.
2.1 Gel-based methods
The first methodology for the separation of a large amount of proteins was set up more than 30 years ago and published in the same year by three different groups (16–18). Since it combines two unique electrophoretic principles on two orthogonal axis of a gel the technique was called two-dimensional gel electrophoresis (2DE). On the first dimension isoelectric focusing (IEF) is used to separate proteins according to their isoelectric point (pI). In the original version carrier ampholytes (CA-IEF) were used to create the pH gradient within the gel. In recent times, the reproducibility of this technique was greatly improved by the introduction of immobilized pH gradient (IPG) which stabilise the gradient preventing cathodic drift during the separation (19). The second dimension is usually ran on a large polyacrylamide gel in the presence of the detergent, sodium dodecyl sulphate (SDS-PAGE) and separate proteins according to their relative mass (Mr). Thousands of protein spots can be routinely separated on high-resolution, large-format, 2DE gels. Precast IPG gels, called strips, are commercially available in a number of lengths (7, 11, 13, 18, 23 cm) and pH gradients. A common approach is to use a wide pH gradient, typically 3 to 10, for and overview at the proteome of interest, but one loses resolution of PTMs and other close proteins spots. Hence, separation employing overlapping zoom pH gels is required. In fact, narrower pH gradients may be used to zoom at one protein level improving both resolution and sensitivity (20–22). Figure 2 illustrates the use of narrow range IPG for 2DE to separate mitochondria in both the acidic (pH 4–7) and basic (pH 6–11) ranges. Generally, due to the poor solubility of basic proteins, instability of basic ampholytes and reductant migration is not common to achieve a good resolution on the basic side of the proteome (23). Recently, a different method for loading protein, the paper-bridge loading method, was applied on the basic (6–11) range obtaining optimal resolution of spots (i.e. proteins) up to pH 11 (Figure 2B) (24). This is particularly necessary for analysis of isolated mitochondria as over 60% of known mitochondrial proteins have a pI over 7.0. A strong limitation of IEF is its incompatibility with charged detergents which may add charges and thus modify electrophoretic mobility of proteins (25). The presence of the ideal protein detergent, SDS is tolerated in a very small amount (0.2–0.5% SDS), therefore the need of non-ionic and zwitterionic detergents in the first dimension (23, 26). Second dimension, SDS-PAGE is a more robust technique due to the presence of SDS and thus suffers from fewer limitations in terms of protein solubility and resolution. Different acrylamide gradients and running buffers can be used in the second dimension to enhance the resolving power within particular Mr intervals (27).
Figure 2. 2D electrophoresis of mitochondrial proteins.
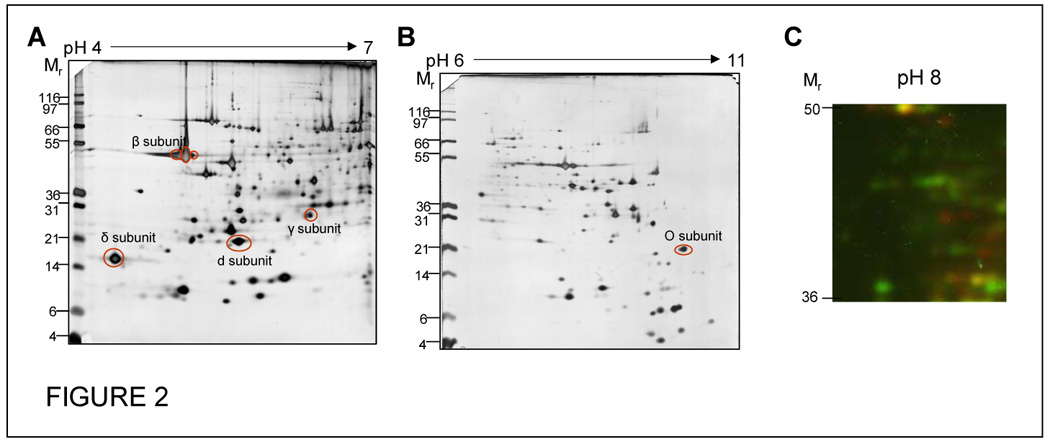
Isolated cardiac mitochondria were run on 18cm IPG strips by either in-gel rehydration (pH 4–7, A) or by paper-bridge loading (pH 6–11, B). Some subunits of the F1F0 ATP synthase are marked on the gels to show predominance of mitochondrial proteins as well as the presences of multiple PTM (phosphorylated) forms of the β subunit. Figure C illustrates the use of phosphatase treatment coupled with DIGE style analysis. Cardiac mitochondria were either untreated (Red – Cy5) or incubated with alkaline phosphatase (Green – Cy3) and then labelled with the respective CyDye. The samples were then combined and run on a single 18cm pH 6–11 gel, the region of the gel around pH 8 and between 50 and 36kDa has been displayed. Yellow indicates protein spots that are unaffected by phosphatase treatment and the presence of red and green spots indicate that there are several mitochondrial proteins in this small region of the gel that are affected by the dephosphorylation.
Protein visualization after separation can be achieved by different staining techniques. Classically, colloidal coomassie and silver staining are the first choice for staining because of their low cost and ease of use (28, 29). The former suffers from poor sensitivity with a detection limit around 8–10 ng of protein when compared to silver staining (0.1 ng) (22). Recently a new enhanced version of the colloidal coomassie staining (blue silver staining) was published by Candiano et al., claiming a detection limit of 5 ng (30). The advantage of coomassie versus silver staining is its compatibility with MS due both to the higher amount of protein present within a coomassie stained spot and to the modifications of proteins introduced during silver staining procedure, but the loss of sensitivity still represents a major issue. Recently, an ammoniacal silver staining procedure was reported as a MS-friendly, silver-based method (31). Fluorescent stains with a much wider dynamic range and higher sensitivity are becoming more and more popular. However, their use limited by the cost of the dye and of the laser scanner needed to acquire fluorescent gels images. Beside general dyes that stain all proteins, new dyes able to stain a class of protein such as unique PTM specifically glycosylation or phosphorylation are available. These can be conveniently used in combination with a non-specific dye enabling superimposition and recognition of PTM forms within the same gel. Another fluorescent approach is based on protein derivatisation with fluorescent compound prior to 2DE and named differential in-gel electrophoresis (DIGE) is rapidly increasing in popularity. Beside the typical sensitivity and dynamic range of other fluorescent stains DIGE introduced the unique possibility to treat different samples with dyes with different emission wavelengths and separate different “coloured” proteomes within the same gel (32). Protein alignment and quantitation across the gels can be achieved by means of dedicated software commercially available or image analysis service companies (eg Ludesi, Sweden). The result of this analysis, also referred as differential display analysis, is a list of spot of interests whose density has changed in relation to a certain condition.
2.2 Gel-free methods
Separation of proteins or peptides obtained after a global protein digestion with proteases can be achieved in liquid phase through chromatographic techniques (see Neverova and Van Eyk, 2005 for review (4)). Among the major advantages when comparing to gel-based techniques, gel-free offers the unique possibility to detect low abundance proteins as well as basic and hydrophobic (membrane) proteins. These technologies also offer a higher degree of automation and the possibility to be coupled with MS, minimizing sample handling and contamination (4, 20, 33). Both one-dimensional (1DLC) and two-dimensional liquid chromatography (2DLC) are used to separate large sets of protein or peptides. The former is commonly used, in combination with one-dimensional gel separation, as a convenient interface to inject liquid samples into MS equipped with an electrospray ionisation source (ESI) (see below) (14).
Multi-dimensional chromatographic approaches can be used for the separation of more complex peptide mixtures such as in multi-dimensional protein identification technology (MudPIT)(34). Briefly MudPIT combines a strong cation exchange (SCX) separation in first dimension followed by reverse phase (RP) chromatography as second dimension. According to the authors the total protein extract is initially digested and the obtained peptides can be separated and injected directly in a tandem MS (MS/MS or MSn, see below) for peptide sequencing (34). The main advantage is that the initial digestion increases the overall solubility of the sample thus limiting losses and poor recovery of sample. As an example Yates III and co-workers were able to identify 1484 from Saccharomyces cerevisiae (35). An analogous approach for wide proteome detection on digested samples and named combined fractional diagonal chromatography (COFRADIC™) has recently been published by Gevaert and collegues (36). According to the authors, subsets of highly representative peptides obtained from the whole protein extract can be selected and separated after digestion giving a reliable representation of the parent proteins. Methionine-containing peptides or N-terminal ones were alternatively selected by the authors (37). Theoretically this technology can be applied to any PTM that can be specifically and quantitatively modified. Proteomic approaches based on protein digestion prior to separation are also referred to as “shotgun proteomics”.
Affinity chromatography (AC) is also convenient for the selection of peptide subpopulations prior to reverse phase-high performance liquid chromatography (RP-HPLC). As an example Adamczyk et al., could select phosphopeptides by derivatising these residues in the entire proteins with biotinylated tags for phosphothreonines or phosphoserines. After digestion, the biotinylated phosphopeptides could be purified on a streptavidin column and separated on a RP-HPLC prior to MS/MS identification (38, 39).
Various liquid-phase approaches have been applied as well to the separation of intact proteins. A number of chromatographic techniques allow protein separation on the basis of pI (chromatofocusing or CF), size (size-exclusion chromatography or SEC), or hydrophobicity (reverse-phase HPLC or RP-HPLC) (22, 40, 41). Usually RP-HPLC is used down-stream (second dimension), interfaced with a tandem MS. As an example, Van Eyk’s group used a CF-RP-HPLC two-dimensional system (2DLC) to analyse the proteome of albumin- and IgG-depleted serum as well as whole human serum (42). 54% (81/150) of the non-redundant proteins had not been previously identified as serum proteins thus allowing the creation of an extensive serum proteome database (42). The same group recently compared this 2D LC technique with classical 2DE on the proteome of isolated mitochondrial inner membrane fractions and reported a very low overlap (≈12%) in between the proteins detected by the two techniques (15). This evidence highlights the concept that both gel-based and gel–free approaches are complementary and both types of analysis are required for an extensive representation of the proteome.
Protein/peptide visualization in gel-free techniques is usually achieved by UV detection at 214 nm. Since peptide bonds absorb light at this wavelength, the signal produced is dependent on the mass of the protein (the number of peptide bonds) and the protein concentration. Peak display may represent an advantage but differential display analysis is not yet available for gel-free techniques due to run to run shifts and the lack of appropriate software for chromatogram alignment.
2.3 Hybrid approaches
A number of hybrid approaches utilising both gel-based and liquid phase technique are routinely used. One of the most common examples is 1D SDS-PAGE separation followed by RP-HPLC prior to MS. Other liquid-phase non-chromatographic techniques such as liquid phase IEF, capillary electrophoresis (CE) and free flow electrophoresis (FFE) have been used alone or in combination with chromatographic or gel-based separation methods. An extensive description of these hybrid systems can not be provided in the context of the present manuscript, however many examples are currently used in proteomics (see (41) for review).
2.4 Identification and characterization of proteins
The step following proteins separation in the proteomic workflow is represented by protein identification and possibly characterization of modified amino acid residues. Information provided in the technologies described above, such as Mw, pI or hydrophobicity, even when combined, can not provide unambiguous protein identification. Therefore, the use of other analytical tools is required. One of the oldest analytic techniques is mass spectrometry (MS). MS has undergone exponential advances in the last decades, with increased emphasis and application to protein chemistry. A milestone in biological application of MS is represented by soft ionization methods able to ionize intact, large, organic compounds such as proteins. In the late 1980s two methods able to allow ionization of large intact biomolecules were published: matrix assisted laser desorption/ionisation (MALDI), starting from crystallized material (43), and electrospray ionisation (ESI) working in liquid phase (44). MS devices can be dissected in three main parts: the ion source, able to transform analytes in charged species; an analyzer able to sort the ions and order them according to their mass to charge ratio (m/z); and a detector able to count the ions with a specific m/z. Counts can be plotted as a function of the m/z value and thus generating peaks. Depending on the charge state of the generated ions the mass of each analytes can be deducted. Different types of sources (such as MALDI and ESI) can be coupled with one or more analyzers. The latter can be generally classified as time of flight (TOF), quadrupoles (Q), ion traps (IT) or Fourier transform ion cyclotron (FT-ICR) analyzers. More than one analyzer can be combined downstream a source in tandem MS (MS/MS or MSn). Different levels of information can be alternatively obtained by MS or MS/MS. Gel plugs containing a specific protein spot are usually excised from a 2DE gel, digested with trypsin (or other proteases and chemical cleaving agent) and submitted to MALDI-TOF MS for peptide mass fingerprint (PMF) identification. Since trypsin cleaves at the C-terminal to basic amino acids (Arg and Lys) a number of small peptides amenable to ionization are obtained from the parental protein. The mixture of peptides depends on the primary sequence of the protein and thus is characteristic for every protein (fingerprint). Peptides mixture is then co-crystallised with matrix, a chemical compound able to transfer a proton to every peptide in the mixture after been bombarded by a laser beam in a MALDI source (43). Charged peptides are separated in the TOF analyzer generating a list of molecular weights also referred as PMF. Experimental PMF can be compared with theoretical ones through several search and retrieval systems freely-available on the web (see www.expasy.ch). Different protein databases (TrEMBL, SwissProt, NCBI protein, etc.) were derived from genomic databases representing a unique legacy for the proteomic era. PMF analysis can provide a fast identification of the protein in a relatively easy way. PTMs can also be indicated but further level of identification are needed both to achieve a higher confidence in protein identification and PTM characterization.
Amino acid sequence information can be retrieved by tandem MS (MS/MS) methods. Classically, ESI represent a more convenient source for tandem MS. In ESI-Q-TOF devices ionised peptides are selected by the first quadupole analyzer and fragmented in a collision chamber downstream. In opportune kinetic energy conditions fragmentation occurs at peptide bonds generating a pattern of ions from which a sequence can be calculated, usually at least two or three peptides are sequenced for every protein in order to obtain a high level of confidence in the identification. Other MS analyzers like ion traps can generate analogous information by iteratively isolating and further fragmenting ions. This feature has proven to be particularly useful for phosphorylation (45, 46). A number of different analyzer implemented in the acquisition time and accuracy are now available [see Domon and Aeberold, 2006 for a review(45)].
MS can also be used for protein abundance comparison (quantitation) within different samples. At the beginning of last century, MS had been use to “weigh” atoms and thus calculate isotopic abundance for the elements. This feature can now be applied to protein chemistry through the use of stable isotopes. Peptides from different samples can be labelled with different stable isotopes of the same element (H¹/D³, C12–13, N14–15, O16–18) producing a reproducible peak shift in the mass spectra. Comparison in peak height for peaks obtained by alternatively introducing a heavier isotope in the peptide chain can provide a reliable evaluation of the relative protein abundance. Labelling can be performed on intact cell cultures using different labelled media for different samples prior to protein extraction (47, 48). Other labelling can be used after protein extraction (49, 50) or during protein digestion (51).
2.5 Phospho-proteomics
a) Gel based techniques
i) Phosphoprotein stains
ProDiamond Q (Invitrogen) is a fluorescent dye that is designed to bind phosphate containing proteins. This dye can be used to stain gels to identify the presence and location of phosphoproteins and it has proved to be very useful in global screening proteomes for potential phosphorylated proteins. The dye can be applied for use on 1D gels of small subproteomes (such as immunoprecipitated complexes (52) or on 2D gels of larger proteomes such as the mitochondrial matrix (53). ProDiamond Q can also be used along with DIGE methods to correlated protein spot quantitation on 2D gels with the presence of phosphoprotein species as a unique method to connect PTM detection with protein quantitation. This dye is very easy to use and is convenient for labs that are already proficient in 2D gel technology. It also provides a visual and easy to understand readout of the overall phosphorylation status of a given proteome. The dye is expensive, as are the fluorescent imaging systems that are needed for its use, however in the scheme of proteomic instrumentation, this technology is not overly expensive and recent evidence suggests that the dye can be used at more dilute concentrations (54). The main drawback to this method is that the dye will bind to proteins that contain any areas of large negative charge and can therefore produce false positives in proteins with long stretches of negatively charged amino acids. As a result the dye can only be viewed as a providing a list of potentially phosphorylated proteins and needs to be followed up with down-stream validation.
ii) Antibody recognition of phosphoproteins
Phospho-specific antibodies for p-Ser, p-Thr and p-Tyr are commercially available and can be used in concert with proteomics technologies to identify phosphorylated proteins. These antibodies for specific phospho-amino acids can be used for recognition on either 1D or 2D western blots. Such blots can be used along with other protein specific antibodies for correlation of protein identification (6). These antibodies are also useful for immunoprecipitation (IP) of phosphorylated proteins followed by downstream gel or MS analyses (55, 56). Phospho-Tyr antibodies are highly specific and very useful for proteomics projects such as 2D western blotting or immunoaffinity pull-downs for down stream MS/MS analyses (56). Unfortunately, p-Ser and p-Thr antibodies tend to be highly cross reactive to other negative charges and can produce high false positive rates making them much less useful in proteomic applications.
iii) Phosphatase assays – enzymatic dephosphorylation
Protein phosphatase enzymes, such as alkaline phosphatase, remove phosphate groups from modified protein species and can be useful in identifying phosphoproteins based on the change in charge of the protein treatment. Phosphatase treatment of samples can be coupled with 2DE to cause pI shifts and thereby identify the phosphoprotein component of a proteome or demonstrate the phosphorylation of individual proteins (6). One comprehensive way of dealing with these phosphatase shifts is to label control and treated sample with different CyDyes in a DIGE style experiment (Figure 2C). This allows for the easy visualization and confident assessment of pI shifts associated with phosphatase shifts. This technique also has the advantage of being highly specific because only those protein species that are modified from phophorylated to dephophorylated will be caused to shift. Though most phosphatase enzymes are inexpensive, the CyDye fluorescent dyes and the instrumentation needed for visualization of the dyes can be very expensive. Mapping of the shifting proteins and thus protein identification using MS methods can be challenging, especially if the proteome is complex.
iv) P32 labeling
One of the oldest biochemical methods for analysis of phosphorylation is to monitor the incorporation of radio-labelled phosphate into protein species. This technique has been most often applied using in vitro systems by incubating proteins or organelles with [γ32P]ATP and monitored using gel techniques combined with audioradiography. Such a system was used to assess the phosphorylation of subunits of Complex I from heart mitochondria and revealed the presence of two phosphorylated subunits, ESSS and MWFE (57).
b) Gel-free techniques
MS technology is a very powerful tool, however, when analyzing phosphorylation modifications with this instrumentation there are several limitations that need to be taken into account. The first problem stems from the low in vivo stochiometry of phosphoproteins with respect to their non-phosphorylated analogue. The low abundance of phophospeptides greatly complicates analysis. A confounding problem in MS analysis is that the non-phosphorylated forms of the peptides tend to suppress the ionization and flight of the phosphorylated counterpart in the MS (58, 59). Also, the energy used to ionize the peptides from the sample source can often cause the liberation and loss of the phosphate from the peptide (58, 59). These factors combined explain the popular use of phosphopeptide enrichment strategies prior to MS/MS analysis. There are several different MS instrumentations and scanning modes that are of particular use in monitoring for phosphorylated peptides in MS/MS techniques. The most popular methods are parent ion and neutral loss scanning, both of which rely on the characteristic loss of H3PO4, HPO3, PO3− or PO2− by phosphorylated peptides upon ionization dependent on the residue phosphorylated and the MS technology. The complex details of these MS methods are beyond the scope of this review, but the reader is referred to several excellent and in-depth reviews on this topic (58–60).
a) Enrichment strategies
i) IMAC (Immobilized metal affinity chromatography)
IMAC makes use of nano-column packed with immobilized metal ions (usually iron). These positively charged metal ions will bind tightly to negative regions of proteins or peptides (such as phosphate groups). Proteins (or more often peptides) flowed over an IMAC column will bind if they contain areas of large negative charge while neutral or positively charged peptides will flow through. This allows for the enrichment and concentration of phosphorylated protein species on the IMAC column and then these species can be eluted (online with MS or offline) and run in a concentrated form on an MS/MS for identification of the protein and site of phosphorylation (61). Enrichment of phosphorylated peptides away from the non-phosphorylated forms can help to overcome some of the limitation of MS technology have in analyzing phosphorylation modifications by increasing the probability of seeing the phosphopeptides and by decreasing the suppression of the phosphopeptides. However, IMAC is not specific to phosphorylation and thus pulls down peptides that have large negative charges as well, which can confound analysis. This non-specific binding can be limited by conversion of peptides using O-methylesterification, which blocks the acidic residues (62). This esterification aids in reducing sample complexity from non-specific binding, but is also thought to decrease sensitivity of the technique. Also, IMAC will not necessarily bind ALL phosphopeptides (especially those on peptides which also contain stretches of positively charged amino acids) and thus valuable information can be lost. Finally, IMAC preferentially binds peptides containing more than one phosphate group which biases analysis away from the single phosphorylated proteins.
ii) TiO2 affinity
TiO2 is similar to IMAC in that it is typically used as an immobilized column that is capable of binding negatively charged regions of peptides, such as phosphorylations. TiO2 columns with 2,5-dihydroxybenozic acid in the sample buffer exhibit a higher selectivity and sensitivity for binding of phosphorylated peptides over IMAC (63). The TiO2/DHB combination limits the binding of negative, but non-phosphorylated, peptides and reduces sample complexity in the MS.
b) Enzymatic treatment
As with gel based analyses, phosphate treatments can aid in MS analysis. Phosphatase treatment of proteins or peptides creates an 80Da mass shift in a MS as phosphate containing peptides are converted to their dephosphorylated forms. This 80Da shift can then be monitored in a mass spectrometer in control versus phosphatase treated samples (64). This is of particular use if the MS available is a MALDI-TOF MS for visualization of the phosphorylated peptides. Phosphatase treatment has the advantage of being specific to this modification and enzyme treatments allows for easy visualization of peptide species that contain phosphates. This has the advantage of being useful on simpler and less expensive MS instruments, compared to other phosphopeptide techniques that require much more complex and expensive MS/MS instrumentation. This method can only identify the PEPTIDES that contain phosphorylations and does not allow for the site specific information that MS/MS techniques can provide. However, site information can be deduced if there is only one phosphorylatable residue in the peptide sequence.
3. PKC and proteomics in cardiac disease
Protein kinase C (PKC) family is constituted by at least eleven different serine/threonine kinases that play a major role in signal transduction from cell membrane to cell interior. Diverse isoforms may be needed either to respond to unique signals or to translocate to specific subcellular sites (65). Cardiac myocytes are a good model for assessing these hypotheses since they contain different PKC isoforms, PKC regulate important organ function such as contractility and cardiac cells show a characteristic ultra-structure that may aid in the analysis of PKC localization (65). Moreover PKC signalling is particularly interesting at cardiac level since it represents a major player both in the myocardial hypertrophy-to-failure transition mechanism as well as in the preconditioning process (66). According to Ping et al., substrates for PKC can be divided in two groups: those bearing consensus domain(s) of unique amino acid sequences phosphorylated by the enzyme and those that do not interact physically with PKC but are mediated by ancillary proteins that themselves are direct substrates of PKCs (10). Proteomic technologies have been applied to the field of kinase study, including PKC, with great enthusiasm. In particular proteomics has often been applied to assess the functional complexes associated with PKC signalling (10). This style of proteomic application starts with the simple idea that localization and binding partners are essential to the appropriate function of the kinase. Thus, by monitoring the enzyme and its associations during direct in vivo activation (or overexpression) (11, 67, 68), unique insights can be gained into signalling cascades and pathways. Phospho-proteomics as well as functional proteomics could help in elucidating the complex mechanisms triggered by PKC activation.
One example of proteomics application is the study of cardiac Troponin I (cTnI) and its PKCε-mediated phosphorylation. Solaro’s group studied the effects of PKCε-mediated phosphorylation of cTnI on Ca2+-sensitivity and thin fibers sliding speed by introducing charge state changes into specific PKCε consensus sites of cTnI (68). Sites were either phosphorylated or mutations were made of consensus sites (S43, S45, T144) to glutamic acid. Different permutation of site phosphorylation were responsible for either decreased sliding speed or Ca2+ desensitization stressing the concept that phopshorylation-mediated modulation can be extremely complex (68). Cardiac troponins represent a challenge for proteomics study due to their tight interactions. Moreover, TnI has a very basic pI (9.87) which further complicated the separation of this protein by 2DE. Several extraction methods have been applied to improve troponin recovery and separation by 2DE (69). Recently, van der Velden and colleagues investigated the effects of PKC-mediated phosphorylation at the myofilament level in the normal and failing human heart using both 2DE and 1DE. Poor resolution of TnI on 2D gel was overcome by running 1D gel and consequent western blotting analysis for the total (phosphorylated and dephosphorylated) TnI as well as for the PKA-dephosphorylated form (70, 71). Indeed, PKC is able to phosphorylate also PKA-specific consensus sites of TnI (S23, S24). Moreover functional studies on rodent myocardium indicated a central role for PKC-mediated phosphorylation at different sites (S43, S45) (68, 70). Different PKC isoforms are expressed at the heart level each showing preferences for specific sites within a protein. The optimization of a 2DE-based method able to resolve TnI and display with a general/phospho-specific stain all the PTM-forms of the protein could provide indications on the consensus sites and thus PKC isoform involved in the observed effect. Other myofilament proteins such as actin, troponin T (TnT), myosin light chain one (MLC1) and two (MLC2) could conveniently be displayed on a 2DE gel providing a snapshot of the phosphorylation status of myofilaments (70, 71).
Another example of proteomics studies advancing the knowledge of PKC’s substrates and effects is found in the studies of the phosphorylation status of the important cyotoskeletal protein, desmin. Beside myofilament proteins, cytoskeletal proteins are emerging as modulators of cardiac function playing a major role in the disarray observed in heart failure (72). Among cytoskeletal proteins known to be phosphorylated by PKC is desmin, the main intermediate filament protein in the heart (73). Recently, Huang and collegues studied the effect of PKC phosphorylation on a rodent model for heart failure (74). The authors could observe marked myofibril disarray together with an increased phosporylation status of desmin. The authors reported a markedly increased phosphorylation of both desmin and TnI on skinned cardiac myocytes isolated from the same animal model model after 30 min treatment with exogenous PKC or the PKC-activator phorbol ester, 12-O-tetradecanylphorbol-13-acetate (TPA). However, the authors separated desmin on a 1D gel and thus limited their ability to show different charge states of the protein. It is noteworthy that PKC-mediated desmin phosphorylation was previously observed in vitro by Kitamura and colleges who reported six serine-phosphorylation sites (75). Interestingly, with proteomic technologies, our group has observed several PTM-forms of desmin, consistent with protein phosphorylation, on 2DE gels from total protein extract obtained from neonatal cardiac myocytes treated with 10 nM endothelin-1, a classical activator of PKC cascade (unpublished data). Together with myofibril disarray, energy imbalance and mitochondrial repositioning are typical failure of the failing heart. Accordingly, Capetanaki postulated that desmin may regulate mitochondrial functioning (76). PKC-mediated modifications of desmin could lead to mitochondrial redistribution thus affecting the coupling in between energy production and delivery (77). Further studies are needed to establish causality between PKC-mediated desmin phosphorylation and mitochondrial behaviour in the diseased heart. Most of the studies on desmin role in heart failure development are based on the use of monoclonal antibodies for total desmin. However, 2DE analysis of isolated myofilament/cytoskelatal subproteome successfully detected the in vivo phosphorylation of desmin in a transgenic model of acute heart failure which, interestingly also had many alterations to the metabolic subproteome (78). Certainly, new insights in this important field could be provided by extending the use of phosphoproteomic strategies, especially in establishing the functional role of differently phosphorylated desmin species.
Proteomic studies have also been applied to the study of PKC and its role in establishing the cardiac preconditioning phenotype. These studies have led to the understanding that PKC isoforms are essential in modulating the mitochondria and its proteins. Through functional proteomics studies it has been discovered that PKC (specifically the PKCε isoform) associates with MAPK, HK II, VDAC and ANT (Figure 3) (11, 79). Several of these associated complexes have been seen to co-localize with the mitochondria, suggesting that PKC signaling and localization could have dramatic influence on the phosphorylation status of the mitochondrial subproteome. The interactions of PKC with members of the mitochondrial permeability transition pore (MPTP) are of particular interest given the importance of this pore and its regulation in the complex process of cellular apoptosis. It is also important to note that these signaling complexes of PKCε have been shown to cause the differential phosphorylation and inactivation of Bad (a proapoptotic protein) (79). It is possible that association of PKC with the MPTP not only has an interaction effect, but also a modulatory effect via the PTM of mitochondrial proteins or the activation of kinase signalling cascades within the mitochondria. The PKC and its interactions with the mitochondria has also been linked to the activation of cardiac preconditioning (67, 79, 80). The PKCε isoform has also been connected to another mitochondrial transporter that is connected to cardiac preconditioning, the mitoKATP channel. The opening of this channel has often been reported as either the end effector or an important modulator of the preconditioned phenotype and pharmacologic agents that open the channel produce a preconditioned phenotype (81). Recently, Jabůrek et al. demonstrated what they refer to as a “persistent, functional association” of PKCε and the mitoKATP channel (82). This functional association is very intriguing as to the nature of the interaction and the potential modification of this channel within the mitochondrial membranes. It has yet to be determined if the interaction of the kinase with the channel occurs in vivo and if the interaction has functional consequences with respect to the preconditioned phenotype. The PKCδ isoform has also been linked to the mitochondria and cardiac phenotypes. The association of PKCδ with the mitochondria has been shown to effect the function of pyruvate dehydrogenase kinase (PDK) and thus also the activity of pyruvate dehydrogenase (PDH) itself (83). This study is important in the argument of phosphoproteomics being important in the study of PKC and the mitochondria because it illustrates that PKC translocation can affect the phosphorylation status of proteins internal to the mitochondria (PDK and indirectly PDH). This group also made the important observation that like PKCε translocation to the mitochondria under preconditioning stimuli, PKCδ translocation to the mitochondria is temporal and regulatable since they observed the translocation during the reperfusion of ischemic hearts (84). Certainly the link PKC and mitochondria indicate the need for a more thorough understanding of the kinase components, substrate proteins and signalling cascades that exist inside the mitochondria. Proteomics offers a set of technologies that can be applied to this investigation on a global level of the whole mitochondrial proteome. The advances in gel and MS techniques described in this review provide a basis for such studies and the future application.
Figure 3. PKC and mitochondrial protein phosphorylation.
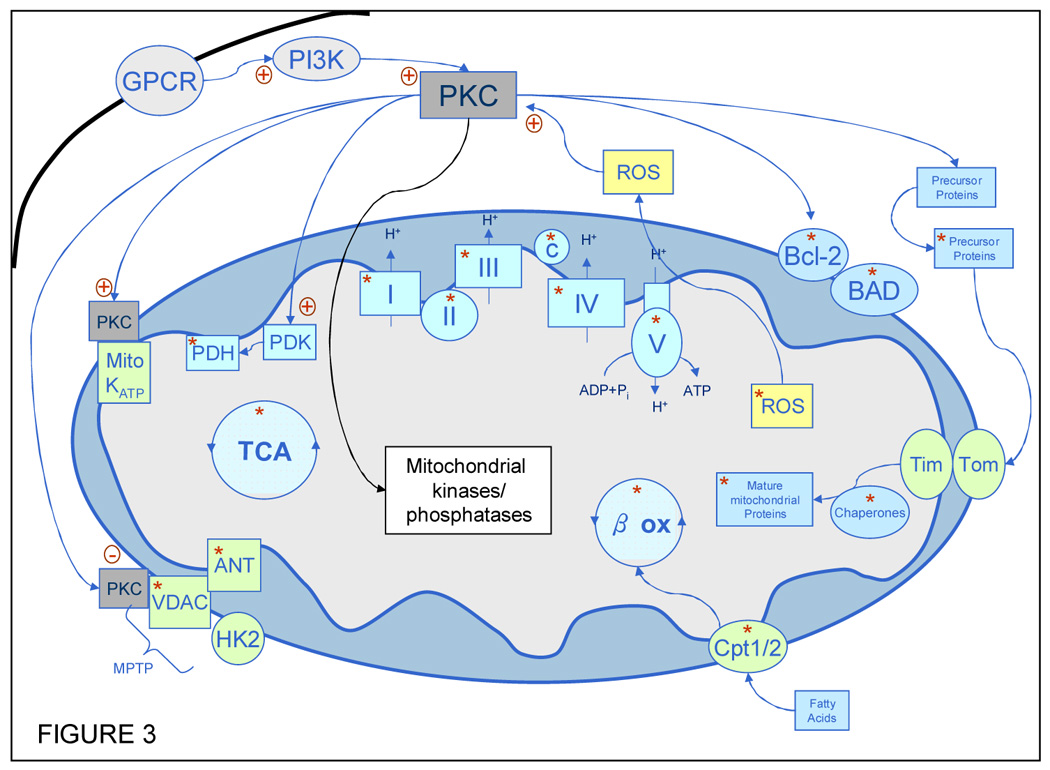
A schematic diagram of PKC and the involvement of protein phosphorylation in a variety of mitochondrial proteins and processes. The red asterisks indicate known phosphorylations to either subunits of the complex or enzymes within the cycles indicated. All of the major pathways of energy production within the mitochondria contain phosphoproteins: the TCA cycle (TCA), OxPhos complexes (I–V) and fatty acid beta oxidation (βox). Several major transporters and channels have also been seen as phosphoproteins including members of the mitochondrial permeability transition pore (MPTP) a known mediator of apoptosis. Other apoptosis related proteins (BAD and Bcl-2) are known to be associated with the mitochondria and appear as phosphorylated species (86). PKC is known to cause the phosphorylation of or interact with (either directly or indirectly) several proteins that are associated with the outer membrane of the mitochondria, including the MPTP proteins, mitoKATP channel (82), BAD and Bcl-2. Of importance is also the observation that PKC can mediate the import of some proteins into the mitochondria through differential phosphorylation of the cytosolic precursors of these mitochondrial proteins (85). Abbreviations and references for the phosphorylation: Boxes labeled I–V indicate the OxPhos complexes I (53, 57, 94–96), complex II (53), complex III (53), complex IV (86) and complex V (7, 86, 97); c, cytochorme c (98); GPCR, g protein coupled receptor; VDAC, voltage dependent anion channel (53, 86); ANT, adenine nucleotide transporter (86); HK2, hexokinase II; PDK, pyruvate dehydrogenase kinase; PDH, pyruvate dehydrogenase (53, 83); ROS, reactive oxygen species (53, 86); Tom, translocase of the outer membrane; Tim, translocase of the inner membrane; CPT1/2, carnitine palmytoltransferase 1/2 (86); βox, fatty acid beta oxidation (53, 86); TCA, Tricarboxylic acid cyle(53, 86).
Another important piece of the PKC puzzle that was determined using proteomics style approaches was the finding that PKC can phosphorylate of protein precursors in the cytosol and target them to the mitochondria. It was shown that the cytosolic precursor of the enzyme aldose reductase was phosphorylated upon activation of PKC in several cell types and that this phosphorylation led to its translocation to the mitochondria (85). This opens up the idea that PKC can not only localize itself to the mitochondria and potentially regulate function by binding or signalling, but also may regulate mitochondria through promoting entry of cytosolic precursors. Proteomic technologies as describe here will prove invaluable in determining the global extent of these phosphorylation induced translocations.
With the development of broad-based proteomic methods for the screening of phosphorylated proteins there has been an explosion of information regarding the PTM status of mitochondria. This information is changing the way that mitochondria are viewed in respect to acute and long term regulation of the biochemical pathways and overall function of this organelle. As shown in Figure 3 almost every major energetic pathway and several of the membrane channels and transporters are found in phosphorylated forms a recent review of mitochondrial phosphorylation gives an excellent account of several of these findings from a variety of organism and tissues (86). PKC could be one of the kinases involved in some of these mitochondrial PTMs. Other kinases have also been implicated in mitochondrial PTM, Akt and GSK3 beta have both been reported in the mitochondria (87, 88) and PKA is known to be a part of the phosphorylation of subunit of Complex I of the electron transport chain (57). One specific example of proteomics providing specific mitochondrial phosphorylation information is a recent account from the lab of the authors which found that the catalytic β subunit of the F1F0 ATP synthase could contain up to five phosphorylated residues in rabbit heart (7). This study combined several proteomics technologies (2DE, IMAC and MS/MS) to visualize and identify these five novel phosphorylations on an enzyme that has been studied extensively with respect to function and structure. It is important to note that in proteomic studies such as the Arrell et al. study, a wealth of new information about protein phosphorylation and potential members of signalling cascades is gained, but it must be followed up by a series of other biochemical experiments to elucidate the functional implication of such PTM, as well as the specific kinases involved. Methods to achieve this include in vitro kinase assays, site-directed mutagenesis, and the use of either kinase knockout animals or specific kinase inhibitor studies.
4. Conclusions
The proteomic era can be viewed as a renaissance of protein biochemistry. It has the potential to test important theories and hypothesis that have remained unconfirmed due to technical limitations. Although far from perfect, proteomics is undergoing rapid advances therefore stressing for the need of continuous up-dating of techniques and experimental approaches. With the rapid diffusion of this multidisciplinary field it is likely that proteomics (and specialized techniques, such as phospho-proteomics) will become easier and more accessible.
The present review is aimed at providing an overview of the current proteomic techniques with particular attention to the phospho-proteomics tools. A few examples from recent findings and potential new concepts such as mitochondrial protein PTM have been depicted. Mitochondria and PKC represent an hot topic in cardiovascular research field due to their concerted involvement in apoptosis, cardioprotection, and hypertrophy development (10, 66, 67, 79, 89–91).
Even though HF is the major cause of death in western countries, the pathophysiology underlying the transition from cardiac hypertrophy to failure remains poorly understood (92). Due to the complex mechanisms of regulation of cellular response and adaptation in cardiac myocytes there is a need for technologies able to monitor cellular phenotype at the protein level. Studies have shown the importance of the PKC mediated phosphorylation of myofilament (TnI) and intermediate filaments (desmin) in the heart. The application of proteomic approaches to the field of cardiac mitochondria has also proven powerful, as seen in the discovery of novel protein modifications that are related to mal-/adaptive cellular processes (7, 93). The “one protein at a time” approach is unlikely to provide a comprehensive picture of cellular signalling due to the concerted action of several molecular players at the same time. Protein PTMs, protein-protein interactions and the identity, localization and function of signalling complexes can be conveniently monitored by proteomic techniques.
Acknowledgements
The authors would like to thank the following funding sources: JVE: The National Heart Lung Blood Institute Proteomic Initiative (contract NO-HV-28120), the Donald P. Amos Family Foundation, and the NIH (contract P01HL081427). GA: Compagnia di San Paolo, Turin, Italy and the Marco Polo project grant. The authors would also like to thank Dr. David Graham, Megan Mitsak and Christina Yung for their contributions to Figure 2.
Footnotes
Publisher's Disclaimer: This is a PDF file of an unedited manuscript that has been accepted for publication. As a service to our customers we are providing this early version of the manuscript. The manuscript will undergo copyediting, typesetting, and review of the resulting proof before it is published in its final citable form. Please note that during the production process errors may be discovered which could affect the content, and all legal disclaimers that apply to the journal pertain.
References
- 1.Wasinger VC, Cordwell SJ, Cerpa-Poljak A, Yan JX, Gooley AA, Wilkins MR, Duncan MW, Harris R, Williams KL, Humphery-Smith I. Progress with gene-product mapping of the Mollicutes: Mycoplasma genitalium. Electrophoresis. 1995;16:1090–1094. doi: 10.1002/elps.11501601185. [DOI] [PubMed] [Google Scholar]
- 2.Gygi SP, Rochon Y, Franza BR, Aebersold R. Correlation between protein and mRNA abundance in yeast. Mol Cell Biol. 1999;19:1720–1730. doi: 10.1128/mcb.19.3.1720. [DOI] [PMC free article] [PubMed] [Google Scholar]
- 3.Pandey A, Mann M. Proteomics to study genes and genomes. Nature. 2000;405:837–846. doi: 10.1038/35015709. [DOI] [PubMed] [Google Scholar]
- 4.Neverova I I, Van Eyk JE. Role of chromatographic techniques in proteomic analysis. J Chromatogr B Analyt Technol Biomed Life Sci. 2005;815:51–63. doi: 10.1016/j.jchromb.2004.11.009. [DOI] [PubMed] [Google Scholar]
- 5.O'Donovan C, Apweiler R, Bairoch A. The human proteomics initiative (HPI) Trends Biotechnol. 2001;19:178–181. doi: 10.1016/s0167-7799(01)01598-0. [DOI] [PubMed] [Google Scholar]
- 6.Arrell DK, Neverova I, Fraser H, Marban E, Van Eyk JE. Proteomic analysis of pharmacologically preconditioned cardiomyocytes reveals novel phosphorylation of myosin light chain 1. Circ Res. 2001;89:480–487. doi: 10.1161/hh1801.097240. [DOI] [PubMed] [Google Scholar]
- 7.Arrell DK, Elliott ST, Kane LA, Guo Y, Ko YH, Pedersen PL, Robinson J, Murata M, Murphy AM, Marban E, Van Eyk JE. Proteomic analysis of pharmacological preconditioning: novel protein targets converge to mitochondrial metabolism pathways. Circ Res. 2006;99:706–714. doi: 10.1161/01.RES.0000243995.74395.f8. [DOI] [PubMed] [Google Scholar]
- 8.Yuan C, Guo Y, Ravi R, Przyklenk K, Shilkofski N, Diez R, Cole RN, Murphy AM. Myosin binding protein C is differentially phosphorylated upon myocardial stunning in canine and rat hearts-- evidence for novel phosphorylation sites. Proteomics. 2006;6:4176–4186. doi: 10.1002/pmic.200500894. [DOI] [PubMed] [Google Scholar]
- 9.Pawson T, Nash P. Protein-protein interactions define specificity in signal transduction. Genes Dev. 2000;14:1027–1047. [PubMed] [Google Scholar]
- 10.Ping P. Identification of novel signaling complexes by functional proteomics. Circ Res. 2003;93:595–603. doi: 10.1161/01.RES.0000093221.98213.E0. [DOI] [PubMed] [Google Scholar]
- 11.Ping P, Zhang J, Pierce WM, Jr, Bolli R. Functional proteomic analysis of protein kinase C epsilon signaling complexes in the normal heart and during cardioprotection. Circ Res. 2001;88:59–62. doi: 10.1161/01.res.88.1.59. [DOI] [PubMed] [Google Scholar]
- 12.Vondriska TM, Zhang J, Song C, Tang XL, Cao X, Baines CP, Pass JM, Wang S, Bolli R, Ping P. Protein kinase C epsilon-Src modules direct signal transduction in nitric oxide-induced cardioprotection: complex formation as a means for cardioprotective signaling. Circ Res. 2001;88:1306–1313. doi: 10.1161/hh1201.092994. [DOI] [PubMed] [Google Scholar]
- 13.Anderson NG, Matheson A, Anderson NL. Back to the future: the human protein index (HPI) and the agenda for post-proteomic biology. Proteomics. 2001;1:3–12. doi: 10.1002/1615-9861(200101)1:1<3::AID-PROT3>3.0.CO;2-T. [DOI] [PubMed] [Google Scholar]
- 14.Guo Y, Ma SF, Grigoryev D, Van Eyk J, Garcia JG. 1-DE MS and 2-D LC-MS analysis of the mouse bronchoalveolar lavage proteome. Proteomics. 2005;5:4608–4624. doi: 10.1002/pmic.200500052. [DOI] [PubMed] [Google Scholar]
- 15.McDonald T, Sheng S, Stanley B, Chen D, Ko Y, Cole RN, Pederson P, Van Eyk JE. Expanding the subproteome of the inner mitochondria using protein separation technologies: one and two-dimensional liquid chromatography and two-dimensional gel electrophoresis. Mol Cell Proteomics. 2006 doi: 10.1074/mcp.T500036-MCP200. [DOI] [PubMed] [Google Scholar]
- 16.O'Farrell PH. High resolution two-dimensional electrophoresis of proteins. J Biol Chem. 1975;250:4007–4021. [PMC free article] [PubMed] [Google Scholar]
- 17.Klose J. Protein mapping by combined isoelectric focusing and electrophoresis of mouse tissues. A novel approach to testing for induced point mutations in mammals. Humangenetik. 1975;26:231–243. doi: 10.1007/BF00281458. [DOI] [PubMed] [Google Scholar]
- 18.Scheele GA. Two-dimensional gel analysis of soluble proteins. Charaterization of guinea pig exocrine pancreatic proteins. J Biol Chem. 1975;250:5375–5385. [PubMed] [Google Scholar]
- 19.Bjellqvist B, Pasquali C, Ravier F, Sanchez JC, Hochstrasser D. A nonlinear wide-range immobilized pH gradient for two-dimensional electrophoresis and its definition in a relevant pH scale. Electrophoresis. 1993;14:1357–1365. doi: 10.1002/elps.11501401209. [DOI] [PubMed] [Google Scholar]
- 20.Gorg A, Obermaier C, Boguth G, Harder A, Scheibe B, Wildgruber R, Weiss W. The current state of two-dimensional electrophoresis with immobilized pH gradients. Electrophoresis. 2000;21:1037–1053. doi: 10.1002/(SICI)1522-2683(20000401)21:6<1037::AID-ELPS1037>3.0.CO;2-V. [DOI] [PubMed] [Google Scholar]
- 21.Westbrook JA, Wheeler JX, Wait R, Welson SY, Dunn MJ. The human heart proteome: Two-dimensional maps using narrow-range immobilised pH gradients. Electrophoresis. 2006;27:1547–1555. doi: 10.1002/elps.200500777. [DOI] [PubMed] [Google Scholar]
- 22.Faber MJ, Agnetti G, Bezstarosti K, Lankhuizen IM, Dalinghaus M, Guarnieri C, Caldarera CM, Helbing WA, Lamers JM. Recent developments in proteomics: implications for the study of cardiac hypertrophy and failure. Cell Biochem Biophys. 2006;44:11–29. doi: 10.1385/CBB:44:1:011. [DOI] [PubMed] [Google Scholar]
- 23.Santoni V, Molloy M, Rabilloud T. Membrane proteins and proteomics: un amour impossible? Electrophoresis. 2000;21:1054–1070. doi: 10.1002/(SICI)1522-2683(20000401)21:6<1054::AID-ELPS1054>3.0.CO;2-8. [DOI] [PubMed] [Google Scholar]
- 24.Kane LA, Yung CK, Agnetti G, Neverova I, Van Eyk JE. Optimization of paper bridge loading for 2-DE analysis in the basic pH region: Application to the mitochondrial subproteome. Proteomics. 2006 doi: 10.1002/pmic.200600267. [DOI] [PubMed] [Google Scholar]
- 25.Rabilloud T. Solubilization of proteins for electrophoretic analyses. Electrophoresis. 1996;17:813–829. doi: 10.1002/elps.1150170503. [DOI] [PubMed] [Google Scholar]
- 26.Luche S, Santoni V, Rabilloud T. Evaluation of nonionic and zwitterionic detergents as membrane protein solubilizers in two-dimensional electrophoresis. Proteomics. 2003;3:249–253. doi: 10.1002/pmic.200390037. [DOI] [PubMed] [Google Scholar]
- 27.Graham DR, Garnham CP, Fu Q, Robbins J, Van Eyk JE. Improvements in two-dimensional gel electrophoresis by utilizing a low cost "in-house" neutral pH sodium dodecyl sulfate-polyacrylamide gel electrophoresis system. Proteomics. 2005;5:2309–2314. doi: 10.1002/pmic.200401249. [DOI] [PubMed] [Google Scholar]
- 28.Neuhoff V, Stamm R, Pardowitz I, Arold N, Ehrhardt W, Taube D. Essential problems in quantification of proteins following colloidal staining with coomassie brilliant blue dyes in polyacrylamide gels, and their solution. Electrophoresis. 1990;11:101–117. doi: 10.1002/elps.1150110202. [DOI] [PubMed] [Google Scholar]
- 29.Switzer RC, 3rd, Merril CR, Shifrin S. A highly sensitive silver stain for detecting proteins and peptides in polyacrylamide gels. Anal Biochem. 1979;98:231–237. doi: 10.1016/0003-2697(79)90732-2. [DOI] [PubMed] [Google Scholar]
- 30.Candiano G, Bruschi M, Musante L, Santucci L, Ghiggeri GM, Carnemolla B, Orecchia P, Zardi L, Righetti PG. Blue silver: a very sensitive colloidal Coomassie G-250 staining for proteome analysis. Electrophoresis. 2004;25:1327–1333. doi: 10.1002/elps.200305844. [DOI] [PubMed] [Google Scholar]
- 31.Chevallet M, Diemer H, Luche S, van Dorsselaer A, Rabilloud T, Leize-Wagner E. Improved mass spectrometry compatibility is afforded by ammoniacal silver staining. Proteomics. 2006;6:2350–2354. doi: 10.1002/pmic.200500567. [DOI] [PMC free article] [PubMed] [Google Scholar]
- 32.Gharbi S, Gaffney P, Yang A, Zvelebil MJ, Cramer R, Waterfield MD, Timms JF. Evaluation of two-dimensional differential gel electrophoresis for proteomic expression analysis of a model breast cancer cell system. Mol Cell Proteomics. 2002;1:91–98. doi: 10.1074/mcp.t100007-mcp200. [DOI] [PubMed] [Google Scholar]
- 33.Liu H, Lin D, Yates JR., 3rd Multidimensional separations for protein/peptide analysis in the post-genomic era. Biotechniques. 2002;32:898, 900, 902. doi: 10.2144/02324pt01. passim. [DOI] [PubMed] [Google Scholar]
- 34.Wolters DA, Washburn MP, Yates JR., 3rd An automated multidimensional protein identification technology for shotgun proteomics. Anal Chem. 2001;73:5683–5690. doi: 10.1021/ac010617e. [DOI] [PubMed] [Google Scholar]
- 35.Washburn MP, Wolters D, Yates JR., 3rd Large-scale analysis of the yeast proteome by multidimensional protein identification technology. Nat Biotechnol. 2001;19:242–247. doi: 10.1038/85686. [DOI] [PubMed] [Google Scholar]
- 36.Gevaert K, Goethals M, Martens L, Van Damme J, Staes A, Thomas GR, Vandekerckhove J. Exploring proteomes and analyzing protein processing by mass spectrometric identification of sorted N-terminal peptides. Nat Biotechnol. 2003;21:566–569. doi: 10.1038/nbt810. [DOI] [PubMed] [Google Scholar]
- 37.Gevaert K, Van Damme J, Goethals M, Thomas GR, Hoorelbeke B, Demol H, Martens L, Puype M, Staes A, Vandekerckhove J. Chromatographic isolation of methionine-containing peptides for gel-free proteome analysis: identification of more than 800 Escherichia coli proteins. Mol Cell Proteomics. 2002;1:896–903. doi: 10.1074/mcp.m200061-mcp200. [DOI] [PubMed] [Google Scholar]
- 38.Adamczyk M, Gebler JC, Wu J. Selective analysis of phosphopeptides within a protein mixture by chemical modification, reversible biotinylation and mass spectrometry. Rapid Commun Mass Spectrom. 2001;15:1481–1488. doi: 10.1002/rcm.394. [DOI] [PubMed] [Google Scholar]
- 39.Adamczyk M, Gebler JC, Wu J. Identification of phosphopeptides by chemical modification with an isotopic tag and ion trap mass spectrometry. Rapid Commun Mass Spectrom. 2002;16:999–1001. doi: 10.1002/rcm.668. [DOI] [PubMed] [Google Scholar]
- 40.Lubman DM, Kachman MT, Wang H, Gong S, Yan F, Hamler RL, O'Neil KA, Zhu K, Buchanan NS, Barder TJ. Two-dimensional liquid separations-mass mapping of proteins from human cancer cell lysates. J Chromatogr B Analyt Technol Biomed Life Sci. 2002;782:183–196. doi: 10.1016/s1570-0232(02)00551-2. [DOI] [PubMed] [Google Scholar]
- 41.Wang H, Hanash S. Intact-protein based sample preparation strategies for proteome analysis in combination with mass spectrometry. Mass Spectrom Rev. 2005;24:413–426. doi: 10.1002/mas.20018. [DOI] [PubMed] [Google Scholar]
- 42.Sheng S, Chen D, Van Eyk JE. Multidimensional liquid chromatography separation of intact proteins by chromatographic focusing and reversed phase of the human serum proteome: optimization and protein database. Mol Cell Proteomics. 2006;5:26–34. doi: 10.1074/mcp.T500019-MCP200. [DOI] [PubMed] [Google Scholar]
- 43.Karas M, Hillenkamp F. Laser desorption ionization of proteins with molecular masses exceeding 10,000 daltons. Anal Chem. 1988;60:2299–2301. doi: 10.1021/ac00171a028. [DOI] [PubMed] [Google Scholar]
- 44.Fenn JB, Mann M, Meng CK, Wong SF, Whitehouse CM. Electrospray ionization for mass spectrometry of large biomolecules. Science. 1989;246:64–71. doi: 10.1126/science.2675315. [DOI] [PubMed] [Google Scholar]
- 45.Domon B, Aebersold R. Mass spectrometry and protein analysis. Science. 2006;312:212–217. doi: 10.1126/science.1124619. [DOI] [PubMed] [Google Scholar]
- 46.Olsen JV, Mann M. Improved peptide identification in proteomics by two consecutive stages of mass spectrometric fragmentation. Proc Natl Acad Sci U S A. 2004;101:13417–13422. doi: 10.1073/pnas.0405549101. [DOI] [PMC free article] [PubMed] [Google Scholar]
- 47.Oda Y, Huang K, Cross FR, Cowburn D, Chait BT. Accurate quantitation of protein expression and site-specific phosphorylation. Proc Natl Acad Sci U S A. 1999;96:6591–6596. doi: 10.1073/pnas.96.12.6591. [DOI] [PMC free article] [PubMed] [Google Scholar]
- 48.Ong SE, Blagoev B, Kratchmarova I, Kristensen DB, Steen H, Pandey A, Mann M. Stable isotope labeling by amino acids in cell culture, SILAC, as a simple and accurate approach to expression proteomics. Mol Cell Proteomics. 2002;1:376–386. doi: 10.1074/mcp.m200025-mcp200. [DOI] [PubMed] [Google Scholar]
- 49.Gygi SP, Rist B, Gerber SA, Turecek F, Gelb MH, Aebersold R. Quantitative analysis of complex protein mixtures using isotope-coded affinity tags. Nat Biotechnol. 1999;17:994–999. doi: 10.1038/13690. [DOI] [PubMed] [Google Scholar]
- 50.Ross PL, Huang YN, Marchese JN, Williamson B, Parker K, Hattan S, Khainovski N, Pillai S, Dey S, Daniels S, Purkayastha S, Juhasz P, Martin S, Bartlet-Jones M, He F, Jacobson A, Pappin DJ. Multiplexed protein quantitation in Saccharomyces cerevisiae using amine-reactive isobaric tagging reagents. Mol Cell Proteomics. 2004;3:1154–1169. doi: 10.1074/mcp.M400129-MCP200. [DOI] [PubMed] [Google Scholar]
- 51.Yao X, Afonso C, Fenselau C. Dissection of proteolytic 18O labeling: endoprotease-catalyzed 16O-to-18O exchange of truncated peptide substrates. J Proteome Res. 2003;2:147–152. doi: 10.1021/pr025572s. [DOI] [PubMed] [Google Scholar]
- 52.Murray J, Marusich MF, Capaldi RA, Aggeler R. Focused proteomics: monoclonal antibody-based isolation of the oxidative phosphorylation machinery and detection of phosphoproteins using a fluorescent phosphoprotein gel stain. Electrophoresis. 2004;25:2520–2525. doi: 10.1002/elps.200406006. [DOI] [PubMed] [Google Scholar]
- 53.Hopper RK, Carroll S, Aponte AM, Johnson DT, French S, Shen RF, Witzmann FA, Harris RA, Balaban RS. Mitochondrial matrix phosphoproteome: effect of extra mitochondrial calcium. Biochemistry. 2006;45:2524–2536. doi: 10.1021/bi052475e. [DOI] [PMC free article] [PubMed] [Google Scholar]
- 54.Agrawal GK, Thelen JJ. Large-scale identification and quantitative profiling of phosphoproteins expressed during seed filling in oilseed rape. Mol Cell Proteomics. 2006 doi: 10.1074/mcp.M600084-MCP200. [DOI] [PubMed] [Google Scholar]
- 55.Gronborg M, Kristiansen TZ, Stensballe A, Andersen JS, Ohara O, Mann M, Jensen ON, Pandey A. A mass spectrometry-based proteomic approach for identification of serine/threonine-phosphorylated proteins by enrichment with phospho-specific antibodies: identification of a novel protein, Frigg, as a protein kinase A substrate. Mol Cell Proteomics. 2002;1:517–527. doi: 10.1074/mcp.m200010-mcp200. [DOI] [PubMed] [Google Scholar]
- 56.Steen H, Kuster B, Fernandez M, Pandey A, Mann M. Tyrosine phosphorylation mapping of the epidermal growth factor receptor signaling pathway. J Biol Chem. 2002;277:1031–1039. doi: 10.1074/jbc.M109992200. [DOI] [PubMed] [Google Scholar]
- 57.Chen R, Fearnley IM, Peak-Chew SY, Walker JE. The phosphorylation of subunits of complex I from bovine heart mitochondria. J Biol Chem. 2004;279:26036–26045. doi: 10.1074/jbc.M402710200. [DOI] [PubMed] [Google Scholar]
- 58.Delom F, Chevet E. Phosphoprotein analysis: from proteins to proteomes. Proteome Sci. 2006;4:15. doi: 10.1186/1477-5956-4-15. [DOI] [PMC free article] [PubMed] [Google Scholar]
- 59.Mann M, Ong SE, Gronborg M, Steen H, Jensen ON, Pandey A. Analysis of protein phosphorylation using mass spectrometry: deciphering the phosphoproteome. Trends Biotechnol. 2002;20:261–268. doi: 10.1016/s0167-7799(02)01944-3. [DOI] [PubMed] [Google Scholar]
- 60.Carr SA, Annan RS, Huddleston MJ. Mapping posttranslational modifications of proteins by MS-based selective detection: application to phosphoproteomics. Methods Enzymol. 2005;405:82–115. doi: 10.1016/S0076-6879(05)05005-6. [DOI] [PubMed] [Google Scholar]
- 61.Corthals GL, Aebersold R, Goodlett DR. Identification of phosphorylation sites using microimmobilized metal affinity chromatography. Methods Enzymol. 2005;405:66–81. doi: 10.1016/S0076-6879(05)05004-4. [DOI] [PubMed] [Google Scholar]
- 62.Ficarro SB, McCleland ML, Stukenberg PT, Burke DJ, Ross MM, Shabanowitz J, Hunt DF, White FM. Phosphoproteome analysis by mass spectrometry and its application to Saccharomyces cerevisiae. Nat Biotechnol. 2002;20:301–305. doi: 10.1038/nbt0302-301. [DOI] [PubMed] [Google Scholar]
- 63.Larsen MR, Thingholm TE, Jensen ON, Roepstorff P, Jorgensen TJ. Highly selective enrichment of phosphorylated peptides from peptide mixtures using titanium dioxide microcolumns. Mol Cell Proteomics. 2005;4:873–886. doi: 10.1074/mcp.T500007-MCP200. [DOI] [PubMed] [Google Scholar]
- 64.Larsen MR, Sorensen GL, Fey SJ, Larsen PM, Roepstorff P. Phospho-proteomics: evaluation of the use of enzymatic de-phosphorylation and differential mass spectrometric peptide mass mapping for site specific phosphorylation assignment in proteins separated by gel electrophoresis. Proteomics. 2001;1:223–238. doi: 10.1002/1615-9861(200102)1:2<223::AID-PROT223>3.0.CO;2-B. [DOI] [PubMed] [Google Scholar]
- 65.Huang XP, Pi Y, Lokuta AJ, Greaser ML, Walker JW. Arachidonic acid stimulates protein kinase C-epsilon redistribution in heart cells. J Cell Sci. 1997;110(Pt 14):1625–1634. doi: 10.1242/jcs.110.14.1625. [DOI] [PubMed] [Google Scholar]
- 66.Murphy S, Frishman WH. Protein kinase C in cardiac disease and as a potential therapeutic target. Cardiol Rev. 2005;13:3–12. doi: 10.1097/01.crd.0000124914.59755.8d. [DOI] [PubMed] [Google Scholar]
- 67.Baines CP, Song CX, Zheng YT, Wang GW, Zhang J, Wang OL, Guo Y, Bolli R, Cardwell EM, Ping P. Protein kinase Cepsilon interacts with and inhibits the permeability transition pore in cardiac mitochondria. Circ Res. 2003;92:873–880. doi: 10.1161/01.RES.0000069215.36389.8D. [DOI] [PMC free article] [PubMed] [Google Scholar]
- 68.Burkart EM, Sumandea MP, Kobayashi T, Nili M, Martin AF, Homsher E, Solaro RJ. Phosphorylation or glutamic acid substitution at protein kinase C sites on cardiac troponin I differentially depress myofilament tension and shortening velocity. J Biol Chem. 2003;278:11265–11272. doi: 10.1074/jbc.M210712200. [DOI] [PubMed] [Google Scholar]
- 69.Labugger R, McDonough JL, Neverova I, Van Eyk JE. Solubilization, two-dimensional separation and detection of the cardiac myofilament protein troponin T. Proteomics. 2002;2:673–678. doi: 10.1002/1615-9861(200206)2:6<673::AID-PROT673>3.0.CO;2-2. [DOI] [PubMed] [Google Scholar]
- 70.van der Velden J, Narolska NA, Lamberts RR, Boontje NM, Borbely A, Zaremba R, Bronzwaer JG, Papp Z, Jaquet K, Paulus WJ, Stienen GJ. Functional effects of protein kinase C-mediated myofilament phosphorylation in human myocardium. Cardiovasc Res. 2006;69:876–887. doi: 10.1016/j.cardiores.2005.11.021. [DOI] [PubMed] [Google Scholar]
- 71.van der Velden J, Merkus D, Klarenbeek BR, James AT, Boontje NM, Dekkers DH, Stienen GJ, Lamers JM, Duncker DJ. Alterations in myofilament function contribute to left ventricular dysfunction in pigs early after myocardial infarction. Circ Res. 2004;95:e85–e95. doi: 10.1161/01.RES.0000149531.02904.09. [DOI] [PubMed] [Google Scholar]
- 72.Hein S, Kostin S, Heling A, Maeno Y, Schaper J. The role of the cytoskeleton in heart failure. Cardiovasc Res. 2000;45:273–278. doi: 10.1016/s0008-6363(99)00268-0. [DOI] [PubMed] [Google Scholar]
- 73.Wang X, Osinska H, Gerdes AM, Robbins J. Desmin filaments and cardiac disease: establishing causality. J Card Fail. 2002;8:S287–S292. doi: 10.1054/jcaf.2002.129279. [DOI] [PubMed] [Google Scholar]
- 74.Huang X, Li J, Foster D, Lemanski SL, Dube DK, Zhang C, Lemanski LF. Protein kinase C-mediated desmin phosphorylation is related to myofibril disarray in cardiomyopathic hamster heart. Exp Biol Med (Maywood) 2002;227:1039–1046. doi: 10.1177/153537020222701113. [DOI] [PubMed] [Google Scholar]
- 75.Kitamura S, Ando S, Shibata M, Tanabe K, Sato C, Inagaki M. Protein kinase C phosphorylation of desmin at four serine residues within the non-alpha-helical head domain. J Biol Chem. 1989;264:5674–5678. [PubMed] [Google Scholar]
- 76.Capetanaki Y. Desmin cytoskeleton: a potential regulator of muscle mitochondrial behavior and function. Trends Cardiovasc Med. 2002;12:339–348. doi: 10.1016/s1050-1738(02)00184-6. [DOI] [PubMed] [Google Scholar]
- 77.Faber MJ, Dalinghaus M, Lankhuizen IM, Bezstarosti K, Dekkers DH, Duncker DJ, Helbing WA, Lamers JM. Proteomic changes in the pressure overloaded right ventricle after 6 weeks in young rats: correlations with the degree of hypertrophy. Proteomics. 2005;5:2519–2530. doi: 10.1002/pmic.200401313. [DOI] [PubMed] [Google Scholar]
- 78.Buscemi N, Murray C, Doherty-Kirby A, Lajoie G, Sussman MA, Van Eyk JE. Myocardial subproteomic analysis of a constitutively active Rac1-expressing transgenic mouse with lethal myocardial hypertrophy. Am J Physiol Heart Circ Physiol. 2005;289:H2325–H2333. doi: 10.1152/ajpheart.01041.2004. [DOI] [PubMed] [Google Scholar]
- 79.Baines CP, Zhang J, Wang GW, Zheng YT, Xiu JX, Cardwell EM, Bolli R, Ping P. Mitochondrial PKCepsilon and MAPK form signaling modules in the murine heart: enhanced mitochondrial PKCepsilon-MAPK interactions and differential MAPK activation in PKCepsilon-induced cardioprotection. Circ Res. 2002;90:390–397. doi: 10.1161/01.res.0000012702.90501.8d. [DOI] [PubMed] [Google Scholar]
- 80.Uecker M, Da Silva R, Grampp TT, Pasch T, Schaub MC, Zaugg M. Translocation of protein kinase C isoforms to subcellular targets in ischemic and anesthetic preconditioning. Anesthesiology. 2003;99:138–147. doi: 10.1097/00000542-200307000-00023. [DOI] [PubMed] [Google Scholar]
- 81.Weiss JN, Korge P, Honda HM, Ping P. Role of the mitochondrial permeability transition in myocardial disease. Circ Res. 2003;93:292–301. doi: 10.1161/01.RES.0000087542.26971.D4. [DOI] [PubMed] [Google Scholar]
- 82.Jaburek M, Costa AD, Burton JR, Costa CL, Garlid KD. Mitochondrial PKC epsilon and mitochondrial ATP-sensitive K+ channel copurify and coreconstitute to form a functioning signaling module in proteoliposomes. Circ Res. 2006;99:878–883. doi: 10.1161/01.RES.0000245106.80628.d3. [DOI] [PubMed] [Google Scholar]
- 83.Churchill EN, Murriel CL, Chen CH, Mochly-Rosen D, Szweda LI. Reperfusion-induced translocation of deltaPKC to cardiac mitochondria prevents pyruvate dehydrogenase reactivation. Circ Res. 2005;97:78–85. doi: 10.1161/01.RES.0000173896.32522.6e. [DOI] [PubMed] [Google Scholar]
- 84.Churchill EN, Szweda LI. Translocation of deltaPKC to mitochondria during cardiac reperfusion enhances superoxide anion production and induces loss in mitochondrial function. Arch Biochem Biophys. 2005;439:194–199. doi: 10.1016/j.abb.2005.05.007. [DOI] [PubMed] [Google Scholar]
- 85.Varma T, Liu SQ, West M, Thongboonkerd V, Ruvolo PP, May WS, Bhatnagar A. Protein kinase C-dependent phosphorylation and mitochondrial translocation of aldose reductase. FEBS Lett. 2003;534:175–179. doi: 10.1016/s0014-5793(02)03834-6. [DOI] [PubMed] [Google Scholar]
- 86.Pagliarini DJ, Dixon JE. Mitochondrial modulation: reversible phosphorylation takes center stage? Trends Biochem Sci. 2006;31:26–34. doi: 10.1016/j.tibs.2005.11.005. [DOI] [PubMed] [Google Scholar]
- 87.Bijur GN, Jope RS. Glycogen synthase kinase-3 beta is highly activated in nuclei and mitochondria. Neuroreport. 2003;14:2415–2419. doi: 10.1097/00001756-200312190-00025. [DOI] [PubMed] [Google Scholar]
- 88.Bijur GN, Jope RS. Rapid accumulation of Akt in mitochondria following phosphatidylinositol 3-kinase activation. J Neurochem. 2003;87:1427–1435. doi: 10.1046/j.1471-4159.2003.02113.x. [DOI] [PMC free article] [PubMed] [Google Scholar]
- 89.Zhang J, Ping P, Vondriska TM, Tang XL, Wang GW, Cardwell EM, Bolli R. Cardioprotection involves activation of NF-kappa B via PKC-dependent tyrosine and serine phosphorylation of I kappa B-alpha. Am J Physiol Heart Circ Physiol. 2003;285:H1753–H1758. doi: 10.1152/ajpheart.00416.2003. [DOI] [PubMed] [Google Scholar]
- 90.Cross HR, Murphy E, Bolli R, Ping P, Steenbergen C. Expression of activated PKC epsilon (PKC epsilon) protects the ischemic heart, without attenuating ischemic H(+) production. J Mol Cell Cardiol. 2002;34:361–367. doi: 10.1006/jmcc.2001.1518. [DOI] [PubMed] [Google Scholar]
- 91.Bowling N, Huang X, Sandusky GE, Fouts RL, Mintze K, Esterman M, Allen PD, Maddi R, McCall E, Vlahos CJ. Protein kinase C-alpha and -epsilon modulate connexin-43 phosphorylation in human heart. J Mol Cell Cardiol. 2001;33:789–798. doi: 10.1006/jmcc.2000.1349. [DOI] [PubMed] [Google Scholar]
- 92.Hunter JJ, Chien KR. Signaling pathways for cardiac hypertrophy and failure. N Engl J Med. 1999;341:1276–1283. doi: 10.1056/NEJM199910213411706. [DOI] [PubMed] [Google Scholar]
- 93.White MY, Cordwell SJ, McCarron HC, Prasan AM, Craft G, Hambly BD, Jeremy RW. Proteomics of ischemia/reperfusion injury in rabbit myocardium reveals alterations to proteins of essential functional systems. Proteomics. 2005;5:1395–1410. doi: 10.1002/pmic.200400995. [DOI] [PubMed] [Google Scholar]
- 94.Schilling B, Aggeler R, Schulenberg B, Murray J, Row RH, Capaldi RA, Gibson BW. Mass spectrometric identification of a novel phosphorylation site in subunit NDUFA10 of bovine mitochondrial complex I. FEBS Lett. 2005;579:2485–2490. doi: 10.1016/j.febslet.2005.03.061. [DOI] [PubMed] [Google Scholar]
- 95.Schulenberg B, Aggeler R, Beechem JM, Capaldi RA, Patton WF. Analysis of steady-state protein phosphorylation in mitochondria using a novel fluorescent phosphosensor dye. J Biol Chem. 2003;278:27251–27255. doi: 10.1074/jbc.C300189200. [DOI] [PubMed] [Google Scholar]
- 96.Augereau O, Claverol S, Boudes N, Basurko MJ, Bonneu M, Rossignol R, Mazat JP, Letellier T, Dachary-Prigent J. Identification of tyrosine-phosphorylated proteins of the mitochondrial oxidative phosphorylation machinery. Cell Mol Life Sci. 2005;62:1478–1488. doi: 10.1007/s00018-005-5005-7. [DOI] [PMC free article] [PubMed] [Google Scholar]
- 97.Ko YH, Pan W, Inoue C, Pedersen PL. Signal transduction to mitochondrial ATP synthase: evidence that PDGF-dependent phosphorylation of the delta-subunit occurs in several cell lines, involves tyrosine, and is modulated by lysophosphatidic acid. Mitochondrion. 2002;1:339–348. doi: 10.1016/s1567-7249(01)00036-8. [DOI] [PubMed] [Google Scholar]
- 98.Lee I, Salomon AR, Yu K, Doan JW, Grossman LI, Huttemann M. New prospects for an old enzyme: mammalian cytochrome c is tyrosine-phosphorylated in vivo. Biochemistry. 2006;45:9121–9128. doi: 10.1021/bi060585v. [DOI] [PubMed] [Google Scholar]