Abstract
Purified native silk fibroin forms β-sheet-rich, physically crosslinked, hydrogels from aqueous solution, in a process influenced by environmental parameters. Previously we reported gelation times of days to weeks for aqueous native silk protein solutions, with high ionic strength and temperature and low pH responsible for increasing gelation kinetics. Here we report a novel method to accelerate the process and control silk fibroin gelation through ultrasonication. Depending on the sonication parameters, including power output and time, along with silk fibroin concentration, gelation could be controlled from minutes to hours, allowing the post-sonication addition of cells prior to final gel setting. Mechanistically, ultrasonication initiated the formation of β-sheets by alteration in hydrophobic hydration, thus accelerating the formation of physical crosslinks responsible for gel stabilization. K+ at physiological concentrations and low pH promoted gelation which was not observed in the presence of Ca2+. The hydrogels were assessed for mechanical properties and proteolytic degradation; reported values matched or exceeded other cell-encapsulating gel material systems. Human bone marrow derived mesenchymal stem cells (hMSCs) were successfully incorporated into these silk fibroin hydrogels after sonication, followed by rapid gelation and sustained cell function. Sonicated silk fibroin solutions at 4, 8, and 12% (w/v), followed by mixing in hMSCs, gelled within 0.5 to 2 hrs. The cells grew and proliferated in the 4% gels over 21 days, while survival was lower in the gels with higher protein content. Thus, sonication provides a useful new tool with which to initiate rapid sol-gel transitions, such as for cell encapsulation.
Keywords: silk, fibroin, gels, hydrogels, stem cells, sonication, hydrophobic hydration
1. Introduction
Hydrogels are considered useful scaffolds for encapsulation and delivery of cells and bioactive molecules, such as for tissue engineering and cell therapeutic applications, due to their high water content; usually >30% [1]. Hydrogels used in these types of applications have mechanical and structural properties similar to some tissues and extracellular matrices (ECM), therefore, they can be implanted for tissue restoration or local release of therapeutic factors. To encapsulate and deliver cells, hydrogels must be formed without damaging cells, must be biocompatible, and must have suitable mass transport capability, sufficient mechanical integrity and strength, and controllable biodegradability [2].
A variety of synthetic materials and naturally derived materials have been used to form hydrogels. Gelation occurs when the polymer chains crosslink either chemically or physically into networks, triggered by chemical reagents (cross-linkers) or physical stimulants (pH, temperature). Hydrogels formed from synthetic polymers offer the benefit of gelation and gel properties that are controllable and reproducible through the use of specific molecular weights, block structures, and modes of crosslinking. Generally, gelation of naturally derived polymers is reported to be less controllable, although the hydrogels formed are more compatible for hosting cell and bioactive molecules [3, 4]. Among naturally derived biomaterials, silk fibroin protein, the self-assembling structural protein in natural silkworm fibers, has been studied because of its excellent mechanical properties, biocompatibility, controllable degradation rates, and inducible formation of crystalline β-sheet structure networks [5–10]. Silk fibroin has been fabricated into various material formats including films, three dimensional porous scaffolds, electrospun fibers and microspheres for tissue engineering and controlled drug release applications [10–14]. In nature, silk fibroin aqueous solution is produced in the posterior section of the silkworm gland and then stored in the middle section at a concentration up to 30% (w/v) and contains a high content of random coil and alpha helical structure. During fiber spinning into air, shear forces and elongational flow-induced self-assembly result in a structural transition of the protein into the β-sheet structure, leading to the formation of solid fibers [15]. The presence of metallic ions and pH changes in different sections of the gland influence this transition [16 – 19]. In vitro, purified silk fibroin aqueous solutions undergo self-assembly into β-sheet structures and form hydrogels. This sol-gel transition is influenced by temperature, pH, and ionic strength [20–22]. The compressive strength and modulus of silk hydrogels increased with an increase in silk fibroin concentration and temperature [21].
Silk fibroin hydrogels are of interest for many biomedical applications. Fini et al. used low-pH induced silk fibroin hydrogels as a bone-filling biomaterial to heal critical-size cancellous defects of rabbit distal femurs, and silk gels showed better bone healing than the control material, poly(D, L lactide-glycolide) [23]. For many cell-based applications, gelation must be induced under mild conditions in a relatively short period of time (within hours). However, silk gelation time is prohibitively long unless nonphysiological treatments are considered (such as low pH, high temperature, additives) in the absence of chemical modifications to the native silk fibroin protein. For silk fibroin concentrations from 0.6 to 15 % (w/v), days to weeks were required for the sol-gel transition at room temperature or 37°C [21–23]. Adding salts at concentrations above physiological levels did not significantly alter the gelation kinetics [21]. Lowering pH (<5) or increasing temperature (>60°C) could reduce the gelation time to a few hours [21, 23, 24]; conditions which could potentially alter cell function and affect cell viability.
In the present study, a new ultrasonication-based method was developed and then used to accelerate the sol-gel transition in a temporally controllable manner. Mechanistically, the process induces physical beta sheet crosslinks via alternations in hydrophobic hydration of the protein chains. This permitted cell additions post-sonication, followed by rapid gelation. Gelation time could be controlled from minutes to hours based on the sonication parameters used (energy output and duration time) and silk fibroin concentrations. The pH and salt concentration effects on gelation, the dynamic silk structural changes after gelation, and the behavior of encapsulated human bone marrow derived mesenchymal stem cells (hMSCs) in silk gels were studied.
2. Materials and methods
2.1. Silk fibroin solutions
Silk fibroin aqueous stock solutions were prepared as previously described [25]. Briefly, cocoons of B. mori were boiled for 40 min in an aqueous solution of 0.02 M sodium carbonate, and then rinsed thoroughly with pure water. After drying, the extracted silk fibroin was dissolved in 9.3 M LiBr solution at 60°C for 4 hours, yielding a 20% (w/v) solution. This solution was dialyzed against distilled water using Slide-a-Lyzer dialysis cassettes (MWCO 3,500, Pierce) for 2 days to remove the salt. The final concentration of silk fibroin aqueous solution was approximately 8% (w/v). Silk solutions with lower concentrations were prepared by diluting the 8% solution with water. To obtain silk solutions with higher concentrations, the 8% solution was dialyzed in Slide-a-Lyzer dialysis cassettes (MWCO 3,500, Pierce) against 10% (w/v) PEG (10,000 g/mol) solution for at least 24 hours at room temperature [6, 21].
2.2. Silk solutions with various salt concentrations and pHs
To determine the effect of salt concentration on silk gelation, KCl and CaCl2 stock solutions at 1 M were added to silk solutions to reach a final salt concentration of 20 to 200 mM. To determine the effect of pH on gelation, silk solutions were titrated with 1 M HCl or NaOH solutions and the pH was monitored with a pH meter.
2.3. Screening for silk gelation
To determine silk gelation under various sonication durations, 0.5 mL of silk (water) solution in a 1.5 mL Eppendorf tube was sonicated with a Branson 450 Sonifier (Branson Ultrasonics Co., Danbury, CT), which consisted of the Model 450 Power Supply, Converter, Externally Threaded Disruptor Horn,, and 1/8″ (3.175 mm) diameter Tapered Microtip. The silk concentration was varied from 1 to 20% (w/v) and sonication time was varied from 5 – 30 seconds at the 20% amplitude setting. To determine the effects of salts and pH on gelation, 0.5 mL of the silk solutions prepared as described above were sonicated at 20% amplitude for 15 seconds. Solutions were incubated at 37°C after sonication and the sol-gel transition was monitored visually, as we have previously reported [22].
2.4. Circular Dichroism (CD)
A 0.5 mL aliquot of 2% (w/v) silk solution was sonicated at 20% amplitude for 30 seconds, and immediately loaded to a 0.01 mm path length, sandwich quartz cell (Nova Biotech, El Cajon, CA). CD measurements were conducted with a Jasco-720 CD spectrophotometer (Jasco Co., Japan). All samples were scanned at 37°C with a 4-s accumulation time at the rate of 100 nm/min, and the results were averaged from 4 repeated experiments. For the kinetic measurement of silk β-sheet structure formation, the ellipticity change at 217 nm was monitored for 2.5 hours with sampling every 10 seconds.
2.5. Mechanical Testing
A large volume of silk gel was prepared by sonication in order to accommodate mechanical testing. Silk solutions, 4%, 8%, and 12% (w/v), after autoclaving in glass flasks were supplemented with Dulbecco’s Modified Eagle Medium powder (DMEM powder, Invitrogen) and sodium bicarbonate (Sigma-Aldrich) to a concentration of 0.0135 g/mL and .0037 g/mL, respectively. The resulting pH of the solution was 7.4, which was verified with a pH meter. In preparing 12% (w/v) gels, a 6 mL aliquot was sonicated at 30 and 40% amplitudes for 30 seconds. In preparing 4% and 8% (w/v) gel samples, an 11 mL aliquot was used. The 8% (w/v) solution was then sonicated at 30, 40, and 50% amplitudes for 30 seconds, while the 4% (w/v) solution was then sonicated at 40 and 50% amplitudes. The range of sonication conditions were selected as those which would induce homogeneous gelation within 5 minutes to 24 hours after sonication stops. In each case, the sonicated solution was then added to small Petri dishes which were visually monitored in a 37°C incubator, until gelation was complete based on an opaque appearance and condensation on the gel surface. Subsequently, plugs were punched out for mechanical tests after gelation, with a 9.525 mm final diameter. Final sample heights ranged from 5.10–5.70 mm for 12% gels and from 4.27–4.97 mm for 4 and 8% gels. The gel plugs were left in DMEM solution (Gibco) immediately after gelation for >1 hour prior to testing. All samples were tested within 24 hours of being submerged in DMEM.
Two unconfined compression testing regimes were pursued to evaluate the influence of sonication conditions on mechanical performance. First, a strain-to-failure test was used to extract a traditional material stiffness property and to observe a failure response [26–27]. Second, a stress relaxation test was used to evaluate equilibrium modulus properties, based on test parameters of Hung et al [28]. Together, these measures provide broad comparisons against the published properties of other degradable hydrogels used for cell encapsulation. N=4 samples were evaluated for every group reported, and were tested on a 3366 Instron machine (Norwood, MA) equipped with unconfined compression platens and a 100N load transducer and sample data exported using Bluehill Software Ver. 2.0.
For strain-to-failure testing, each sample was compressed at an extension-controlled rate of 1 mm/min, beginning after nominal tare loads were reached and sample heights recorded. The compressive stress and strain were determined by normalizing against sample geometries and the “traditional” elastic modulus was calculated as the slope of a tangency line established at the 5% strain portion of each stress/strain curve. The yield strength was determined by offsetting a line parallel to the tangency line by 2% strain; where the offset line intersected the stress/strain response was defined as the yield strength (which coincided with failure onset). For stress relaxation testing, samples were submerged in phosphate buffered saline and left under a nominal tare load for 200 seconds. Thereafter, samples were compressed at 1μm/s until 10% strain was reached, which was held for 20 minutes. The equilibrium modulus was calculated by normalizing the relaxation stress by 10% strain.
2.6. In vitro enzymatic degradation of silk gels
Silk gel plugs (diameter = 4 mm; height = 2–3 mm) at 4, 8, 12% (w/v) were prepared as described above and then immersed in 1 mL of Protease XIV (Sigma-Aldrich) solution in a 24-well plate. The protease solution was freshly prepared by dissolving the enzyme powder in PBS to reach a concentration of 5 U/mL, and replaced with newly prepared solution every 24 h. The control plugs were immersed in 1 mL of PBS which was also refreshed every 24 h. All samples were incubated at 37°C. At day 1, 2, 3, 4, and 7, 4 plugs were washed with water, wiped with tissue paper to remove excess water on the gel surface, and weighed.
2.7. hMSC seeding and culturing in silk gels
hMSCs were isolated from fresh whole bone marrow aspirates from consenting donors (Clonetic-Poietics, Walkersville, MD) as described previously [29,30], and culture expanded in a growth medium containing 90% DMEM, 10% fetal bovine serum (FBS), 0.1 mM non-essential amino acids, 100 U/mL penicillin, 1000 U/mL streptomycin, 0.2% fungizone antimycotic and 1 ng/mL basic fibroblast growth factor (bFGF). Before use, passage 3 – 4 cells were trypsinized from culture flasks and resuspended in DMEM to obtain a cell density of 5×10⁷ cell/mL. Fifteen mL of silk solution at 4, 8, and 12% (w/v) were steam sterilized (autoclaved) and supplemented with DMEM powder and sodium bicarbonate as described above. An aliquot of 5 mL was added to a 15-mL falcon plastic tube, and a total of two tubes (control and cell seeded) were prepared for each silk concentration. A 4% (w/v) silk solution (5 mL) was sonicated in a laminar flow hood at 50% amplitude for 30 seconds, and after 30 min incubation the solution was sonicated again under the same conditions. After the second sonication, the solution was cooled to room temperature within 5 – 10 min, and then 50 μL of the cell suspension was added and mixed with the sonicated silk solution to reach a final concentration of 5×10⁵ cells/mL. The control sample was sonicated in the same way, but 50 μL of DMEM was added instead of the cell suspension after the sonication. An aliquot of 1.5 mL of the mixtures was quickly pipetted into 12-well cell culture plates, with a total of three wells prepared for each sample group. The 8% and 12% (w/v) solutions were sonicated once at 40% and 30% amplitude, respectively, for 30 seconds. A 50 μl aliquot of hMSC suspension was added and the mixture was plated as described above. All plates were then incubated at 37°C and 5% CO2.
Once the silk gelled in the plates within 0.5 – 2 h, small plugs (diameter = 4 mm; height = 2–3 mm) were punched out of the gels and placed in the wells of a new 24-well plate. The plugs were then cultured in 1 mL of growth medium containing 90% DMEM, 10% fetal bovine serum (FBS), 0.1 mM non-essential amino acids, 100 U/mL penicillin, 1000 U/mL streptomycin, 0.2% fungizone antimycotic at 37°C and 5% CO2. For microscopy imaging, the hMSC encapsulated silk gels with a volume of 0.5 mL were prepared in 24-well plates and cultured in 1 mL of the same growth medium and under the same conditions as above, and images were taken at desired time points.
2.8. Analyses of hMSCs encapsulated in silk gels
2.8.1. Phase contrast microscopy
At days 2, 6, 14 and 21 of culture, cell morphology was monitored by a phase contrast light microscope (Carl Zeiss, Jena, Germany) equipped with a Sony Exwave HAD 3CCD color video camera.
2.8.2. DNA quantification
Cell proliferation was assessed by DNA assay. Briefly, at each time point, 4 gel plugs from each group were washed with PBS, pH 7.4, weighed (wet weight), and chopped with microscissors in ice. DNA content (N=4) was measured using PicoGreen assay (Molecular Probes, Eugene, OR), according to the manufacturer’s instructions. Samples were measured fluorometrically at an excitation wavelength of 480 nm and an emission wavelength of 528 nm. DNA content was calculated based on a standard curve obtained in the same assay, and further normalized by the wet weight of each gel plug.
2.8.3. Live/dead assay
The hMSCs in the gel plugs were examined by live/dead assay (Molecular Probes, Eugene, OR). Briefly, at the end of culture, a gel plug of each group seeded with hMSCs was washed with PBS, cut into two halves and incubated in 2 mM calcein AM (staining live cells) and 4 mM ethidium homodimer (EthD-1, staining dead cells) in PBS for 30 min at 37°C. The cross-section of the cut gel was imaged by Confocal microscopy (Bio-Rad MRC 1024, Hercules, CA) with Lasersharp 2000 software (excitation/emission ~495 nm/~515 nm). Depth projection micrographs were obtained from a series of horizontal sections, each 10 microns apart, based on the total height of a well-defined cell colony. Still images at various depths were captured and a series of micrographs were later combined for “z-stacked” compilation images.
2.8.4. Histology
Silk gels seeded with cells were washed in PBS and fixed in 10% neutral buffered formalin for 2 days before histological analysis. Samples were dehydrated through a series of graded ethanols, embedded in paraffin and sectioned at 5 μm thickness. For histological evaluation, sections were deparaffinized, rehydrated through a series of graded ethanols, and stained with hematoxylin and Eosin (H&E).
2.9. Statistics
Statistical analysis was performed using the Student’s t-test. Differences were considered significant when p ≤0.05 and highly significant when p ≤0.01.
3. Results and Discussion
3.1. Control of silk fibroin gelation by sonication
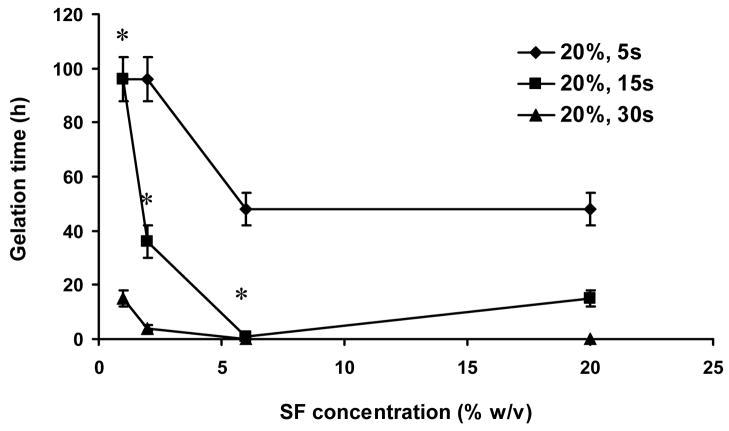
The 0.5 mL silk fibroin aqueous solutions at concentrations of 1, 2, 6, and 20% (w/v) were sonicated as described. When power output was kept constant (20% amplitude), silk fibroin gelation time decreased with increased sonication time (Figure 1). For every increase in silk concentration from 1 to 6% (w/v), the gelation time decreased significantly (p<0.01 between * samples in Figure 1). The 20% (w/v) sample had a similar or even longer gelation time than the 6% (w/v) sample (Figure 1). This outcome for the 20% sample is likely due to the high viscosity of the solution, thus sonication waves could not effectively propagate in the solution. When the power output above 30% amplitude was used, sonication generated thick foams and the silk fibroin did not gel in a homogeneous manner. This was not observed when the volume for sonication was increased to 5 ml, even at power levels as high as 55% amplitude. However, when higher concentrations were sonicated at volumes exceeding 5 mL, heterogeneous gelation occurred. Small volumes of silk solution (without autoclaving) were used for sonication optimization and gel characterizations (pH, salt effect and CD measurement), while autoclaved silk solutions were used for mechanical, degradation, and cell encapsulation studies. Interestingly, as compared to the original solutions, autoclaving did not significantly change the sonication parameters used and the related gelation times, suggesting that silk fibroin protein retained important features of its original solution-state structure and capability of structural transition to β-sheet state in forming a gel (see next section) after autoclave. Structural alterations due to autoclave treatments should be further investigated in future studies.
Figure 1.
Silk fibroin (SF) gelation under various sonication conditions; 0.5 mL of aqueous solution used. Sonication was performed at 20% amplitude and time varied from 5 to 15 seconds. Values are average ± standard derivation of a minimum of N=3 samples for each group. *significant differences between the groups (student’s t-test, P<0.01).
3.2. CD Measurements to confirm microstructural changes
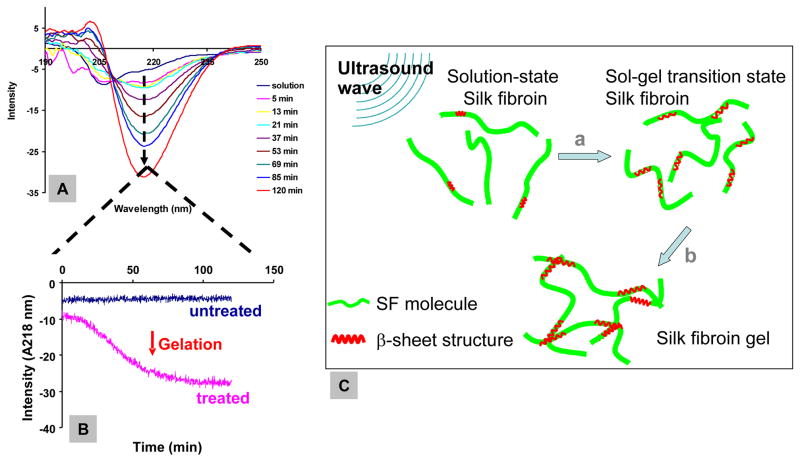
During gelation of silk fibroin, the sol-gel transition was linked to an increase in β-sheet formation by observed changes in CD measurements (Figure 2A). After sonication, rapid formation of β-sheet structure was observed, followed by a slower transition, based on the increase of ellipticity at 217 nm (Figure 2B). Silk fibroin gelation occurred at this transition point, where the initial rapid formation of β-sheet structure slowed down. This transition is consistent with studies previously undertaken [22], suggesting that similar mechanisms may be involved, as discussed in the following section. The formation of β-sheet structure results from altered hydrophobic interaction and the subsequent physical crosslinks. This initial step is followed by slower organization of the chains and formation of a gel network within a relatively long time frame compared to the initial sonication-induced changes. This two-step silk gelation mechanism is schematically depicted in Figure 2C.
Figure 2.
Dynamic silk β-sheet structure formation during the gelation process. (A) CD measurement on sonicated 2% (w/v) silk fibroin aqueous solutions with wavelength scans taken every 8 minutes after sonication for 120 min. (B) Ellipticity increase at 217 nm (β-sheet structure peak) was recorded with time. (C) Schematic illustration of mechanism of silk gelation. The gelation process contains two kinetic steps: a, structural change from random coil to β-sheet with some inter-chain physical crosslinks occurring in a short time frame; b, β-sheet structure extended, large quantity of inter-chain β-sheet crosslinks formed, and molecules organized to gel network over a relatively long time frame.
3.3 Mechanism
The parameters studied to influence rates of gelation can be viewed as a method to recapitulate the natural silkworm spinning process. The key processing parameters include sonication effects, as a mimic for increased shear forces experienced at the anterior division of the silkworm gland, cation type and concentrations, and pH.
3.3.1 Sonication effects
It is accepted that, in sonication, mechanical vibration causes the formation and collapse of bubbles. As a result of this cavitation, the media may experience extreme local effects: heating (10,000 K), high pressure (200 bar) and high strain rates (107 s−1) [31,32]. These physical phenomena have been exploited in a variety of applications, including self-assembly and gelation of N-isopropylacrylamide/acrylic acid copolymer [33], organic fluids with metalized peptides [34], and synthetic self-assembling peptides [35]. Aside from peptides, proteins such as human serum albumin and myoglobin have been studied with sonication as an approach to characterize aggregation and self-assembly related to disease states [36, 37].
Given the breadth of behavior of polymer systems in response to sonication, it is likely that several physical factors related to sonication, including local temperature increases, mechanical/shear forces, and increased air-liquid interfaces affect the process of rapid gelation of silk fibroin. In particular, sonication-induced changes in hydrophobic hydration would result in the accelerated formation of physical crosslinks, such as initial chain interactions related to beta sheet formation. In the present study, during the sonication process, the solution temperature increased from room temperature to 40–71°C (data not shown) for the short period of time (5–6 minutes), which reflects a transient spike in local temperature. In a past study, gelation required a few days when bulk samples were maintained at 60°C, without sonication [21]. Therefore, local temperature effects likely contribute toward the increased gelation kinetics, but are not solely responsible for the short-duration responses found. Localized chain dynamics and changes in hydration states of the hydrophobic chains, influenced by the transient temperature increase, are likely responsible for the formation of the hydrophobic physical crosslinks. We are not aware of the specific use of sonication-induced processing of biopolymers related to controlled assembly, as is the outcome of the present study. The unique hydrophobic block sequence features in silk fibroin chains are particularly suitable for this type of technique due to the critical role of water in the control of intra- and inter-chain interactions [6]. It would be useful to extend the technique to other biopolymer systems to determine the impact of chain chemistry on sonication controlled processes of chain assembly. Sonication related collagen degradation, as a method to fragment chains to facilitate studies of reassembly have been reported [38]. It should be noted that in the present work we do not see significant chain degradation due to the short duration sonication process used, based on SDS-PAGE analysis (data not shown).
3.3.2 Effect of K+, Ca2+ and pH on SF gelation
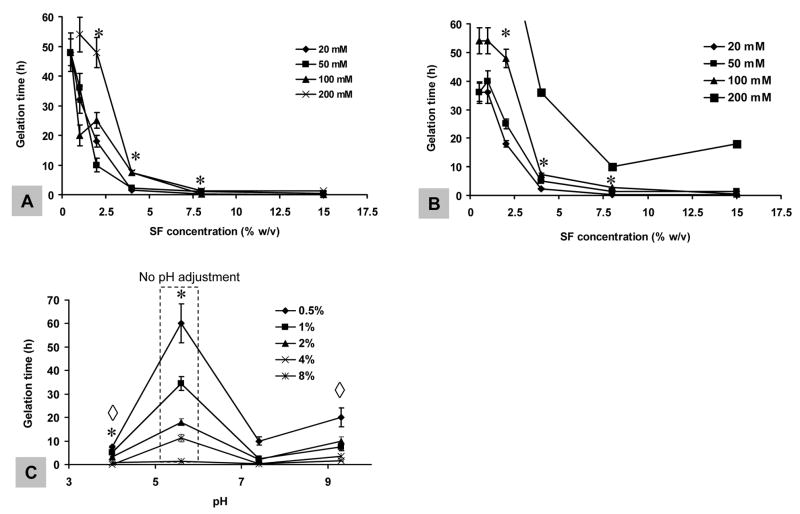
Silk fibroin aqueous solutions were supplemented with K+ and Ca2+ to various physiologically relevant concentrations prior to sonication. As shown in Figure 3A, at low K+ concentration (20–50 mM), gelation time significantly decreased with increase in K+ concentration (p<0.05 between * samples). However, at high K+ concentration (100–200 mM), gelation was inhibited (Figure 3A). These outcomes were observed for silk fibroin concentrations ranging from 0.5 – 8% (w/v). Above 8%, no salt effect was observed as gelation occurred too fast in all the samples (<2 minutes). Compared to K+, Ca2+ at the same concentrations induced slower silk fibroin gelation (compare Figure 3A and 3B). When Ca2+ concentration was increased from 20 to 200 mM, silk fibroin gelation time significantly decreased (p<0.05 between * samples in Figure 3B). From previous work, Ca2+ promoted silk fibroin gelation while K+ had no effect [21], a different outcome than the observations in the present study.
Figure 3.
Salt and pH effects on silk fibroin gelation. Prior to sonication, solutions at various concentrations were supplemented with (A) K+ and (B) Ca2+ to final concentrations of 20 mM – 200 mM and (C) adjusted pHs. Sonication was performed at 20% amplitude for 15 seconds for all samples. Values are average ± standard derivation of a minimum of N=3 samples for each group. *, ◇ significant differences between the groups (student’s t-test, P<0.05).
The pH of silk fibroin aqueous solution was adjusted prior to sonication in order to determine effects on gelation. Either decreasing or increasing pH promoted gelation (p<0.01 between * samples in Figure 3C). The effect of lower pH (<4) was more pronounced than the higher pH (>9) in inducing gelation (p<0.05 between ⋄ samples in Figure 3C), consistent with previous studies [21, 22].
3.4. Mechanical properties of SF hydrogels
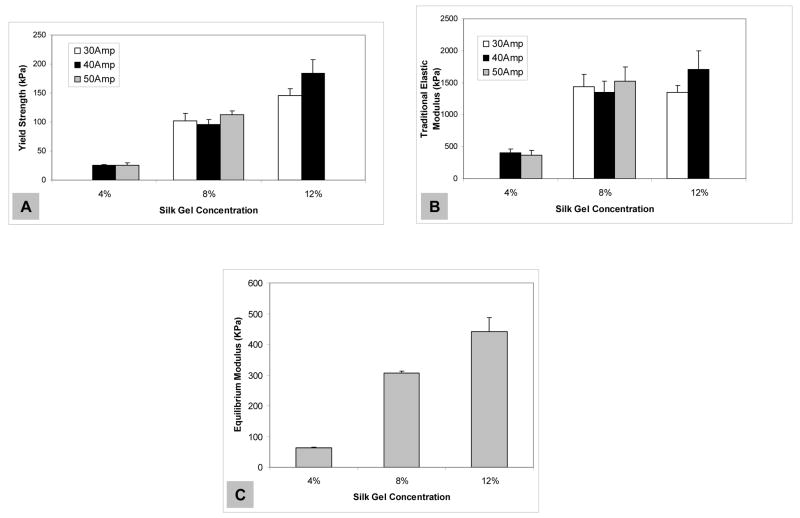
Stress/strain curves resulting from mechanical tests on the gels displayed linearity preceding a plateau region, suggesting that the gels have a large (~5–10% strain), likely viscoelastic characteristic, after which permanent damage is induced by crack formation. The gels fabricated in this study performed similarly to gels studied in our previous work [21], in that the corresponding silk fibroin concentrations yielded similar values for both yield strength (Figure 4A) and “traditional” elastic modulus (Figure 4B). Both metrics were positively correlated with silk gel concentration. By inspection, the differences in silk fibroin concentration (w/v) were more significant determinants of final hydrogel mechanical properties, rather than variation due to sonication conditions (Figure 4A and 4B). Likewise, the equilibrium modulus values were positively correlated with silk gel concentration (Figure 4C). When compared to other degradable cell-encapsulating hydrogels, such as alginate, agarose, polyethylene glycol cross linked gels, fibrinogen and other system [26–28, 39–43], the high concentration rapidly-forming silk hydrogels exhibited superior mechanical properties (Table 1). Data were collected based on similarities between cell-encapsulation and mechanical test protocols, in which either “traditional” or equilibrium modulus values were determined.
Figure 4.
Mechanical properties of sonication-initiated silk fibroin hydrogels. (A) Yield strength at 2% offset, (B) “traditional” elastic modulus calculated from the tangent at 5% strain of hydrogels prepared from silk fibroin aqueous solutions at various sonication treatments (30, 40, and 50% power output (Amp) for 30 seconds). (C) Equilibrium modulus of hydrogels prepared from 4%, 8% and 12% (w/v) silk fibroin aqueous solutions (at 50%, 50% and 30% amplitudes, respectively). Values are average ± standard derivation of a minimum of N=4 samples.
Table 1.
Comparative mechanical properties among gel systems from degradable polymers used for cell encapsulation.
| Material | Traditional Modulus (KPa) | Literature |
|---|---|---|
| Silk hydrogels | 369–1712 | This study |
| Fibrinogen - PEG copolymer1 | 0.02–4 | 27 |
| Poly(1,8-octanediol citrate) (POC)2 | 10.4 | 40 |
| PEG dimethacrylate-PLA copolymer, (photocrosslinked) 3 | 60–500 | 39 |
| Gelatin4 | 0.18 | 42 |
| Gelatin, glutaraldehyde cross-linked4 | 8.13 | 42 |
| Dex-AI/PNIPAAm5 | 5.4–27.7 | 43 |
| Alginate6 | ~25–125 | 28 |
| Material | Equilibrium Modulus (KPa) | Literature |
| Silk hydrogels | 63–441 | This study |
| Agarose (2% final concentration)7 | ~ 15 | 26 |
5mm dia × 5 mm height. Deformation rate of 1.5 mm/min, modulus based on average slope of the lower portion of stress-strain curve (<15%).
6mm dia × 2.4 mm height. Deformation rate of 2mm/min, modulus based on average slope of the initial portion of stress-strain curve.
5mm dia × 1mm height. Load-controlled deformation rate of 40 to 100 mN/min.
12.5mm dia × 1.5 mm height. Load-controlled deformation rate of 25 mN/min, Young’s modulus equivalent to the absolute value of the slope obtained between initial preload force (.01N) to .25N.
6mm dia. Deformation rate of .5 mm/min, modulus based on average slope of the lower portion of stress-strain curve.
Deformation rate of 1mm/min. Elastic moduli were obtained from the slope of the stress vs. strain curves, limited to the first 10% of strain.
Equilibrium modulus calculated from the equilibrium stress and initial cross-sectional area at 10% strain.
3.5. Enzymatic degradation of hydrogels
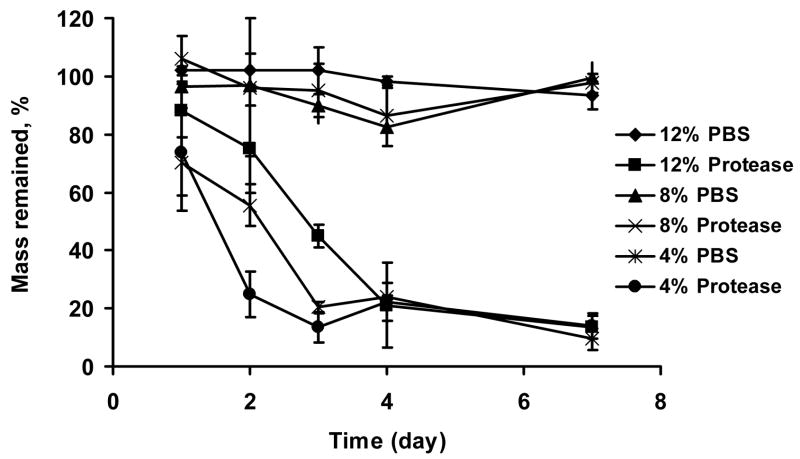
Enzymatic (protease XIV) degradation of silk fibroin films, porous solid scaffolds, and silk fibroin yarns have been studied previously [7, 8, 44]. Using the same concentration of protease (5 U/mL), all silk fibroin hydrogels showed rapid degradation, with about 80% mass loss in the first 4 days, with a much slower rate of degradation afterwards (Figure 5). The degradation of the hydrogels was silk fibroin concentration dependent. When the concentration was increased from 4 to 12% (w/v), degradation time to reach 50% mass loss in the experiment increased from 1.5 to 3 days (Figure 5). The control samples, silk fibroin hydrogels incubated in PBS instead of protease, were stable through the incubation period (Figure 5). The fast degradation (within days) of silk hydrogels due to proteolytic processes may be suitable for some applications, such as in wound healing scenarios or rapid drug delivery. It should be noted, however, that the proteolytic degradation times reported here are in vitro, thus, in vivo lifetimes are generally longer and the time frames will be tissue-specific.
Figure 5.
Enzymatic degradation of silk fibroin hydrogels. Hydrogels at 4, 8, and 12% (w/v) were prepared by sonication and immersed in either PBS, pH 7.4 (control) or protease XIV in PBS (5 U/mL) for 7 days. Mass remaining was determined by comparing the wet weight of gel plugs at each time point with original wet weight. Values are average ± standard derivation of a minimum of N=4 samples.
3.6. hMSC encapsulation
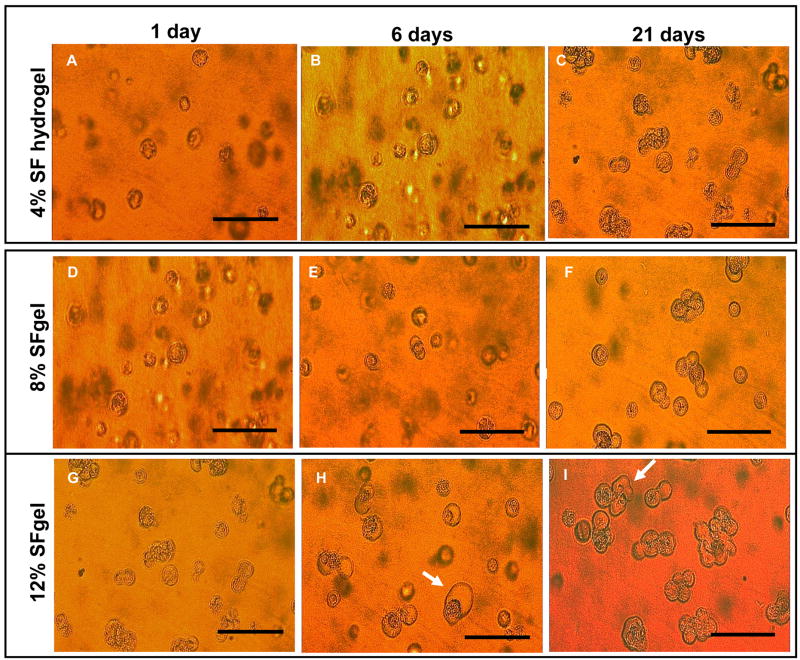
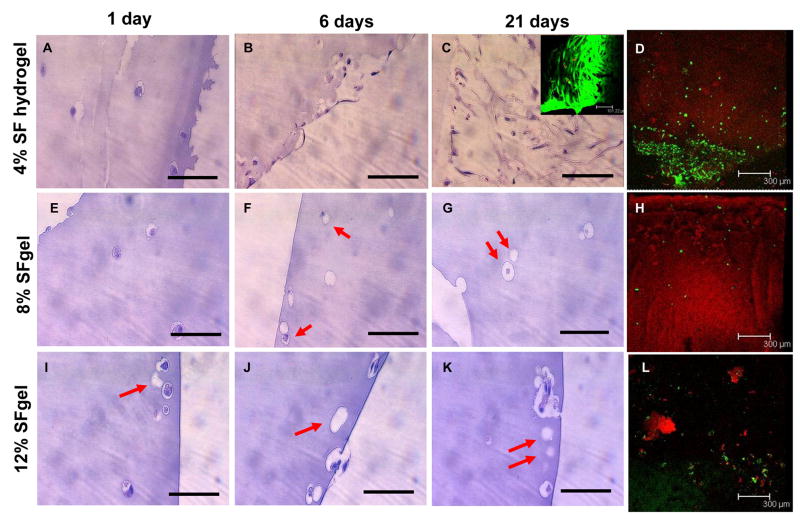
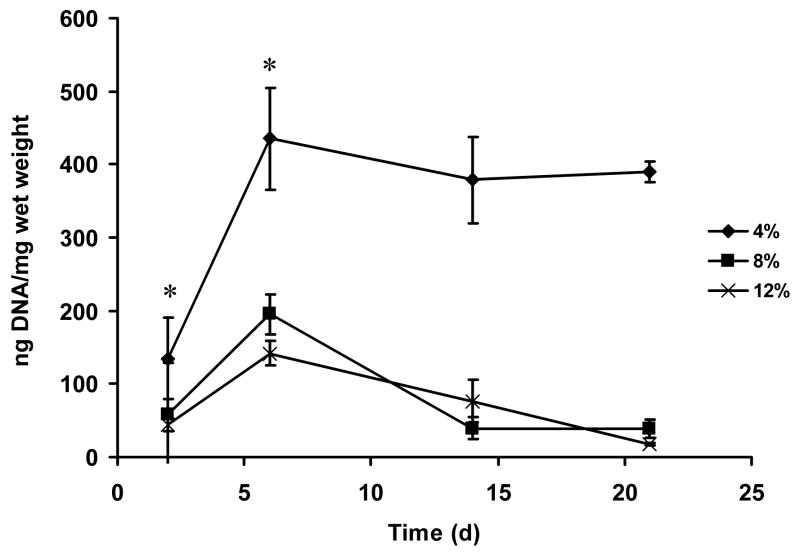
hMSCs have been successfully encapsulated in a variety of hydrogel systems, such as polyethylene glycol, agarose, collagen and alginate, because of the potential of these cells for tissue repair or regeneration and long-term drug release [45–50]. Silk hydrogels with less than 4% (w/v) protein were difficult to manipulate due to physical limitations. Therefore, for hMSC encapsulation 4, 8, and 12% (w/v) silk fibroin hydrogels were used. In all three gel concentrations, cells retained their original round shape and homogeneous distribution at day 1 (Figure 6A, D, G). At day 6, defects appeared on some cells in the 12% gel and cell morphology largely changed (Figure 6B, E, H). At day 21, cells in the 4% gel were unchanged when compared to day 1, while cells in the 8 and 12% gels were largely deformed and aggregated (Figure 6C, F, I). Histological analysis revealed that hMSCs in the 4% gel retained round-shape and were nonaggregated throughout the study, while those near the surface of the gels grew out of the gel and changed morphology from round shape to spindle-like shapes from day 6 (Figure 7A–C). All hMSCs, either spindle-like near the gel surface (Figure 7, inset of C) or round-shape encapsulated in the gel (Figure 7D), were alive, as seen by green fluorescence in the live-dead assay. Therefore, hMSCs maintained their activity and function in the 4% silk hydrogel system for at least 21 days. hMSCs in the 8 and 12% gels, however, largely changed morphology and many of them died, aggregated and/or dissolved, as seen by the empty cavities in histological images (Figure 7F, G, I, J, K) and few green fluorescent spots in the live-dead assay (Figure 7H, L). The control silk gel with no cells encapsulated showed a strong red fluorescence background, which masked the red fluorescence from dead cells in the live-dead assay (data not shown). These observations and conclusions were further supported by DNA quantification (PicoGreen assay) (Figure 8). Cells significantly proliferated in all three hydrogels over the first 6 days (p<0.05 between * samples in Figure 8). For the 4% gel, cell numbers stopped increasing after 6 days, indicating that maximal gel capacity for cell proliferation was reached. A similar phenomenon was observed in other hydrogel systems such as PEG and alginate [46, 51]. For the 8% and 12% gels, cell numbers decreased after 6 days, consistent with the microscopic, histological and live-dead observations (Figure 6 and 7). The loss of activity in the higher concentration gels is likely due to mass transport limitations, but may also be due to mechanical restrictions imposed at these higher gel concentrations. The possibility that silk gels were toxic to hMSCs can be excluded since the hMSCs growing on top of the silk gels at 4, 8, and 12% had growth rates similar to those growing on the control cell culture plate, and cell morphologies (spindle shape) were similar between all groups (data not shown). In future studies, optimization of conditions to stabilize lower gel concentrations (1 and 2%) should be explored and the diffusion rates of oxygen and nutrients through various concentrations of silk gels should be studied.
Figure 6.
Microscopic imaging of hMSCs encapsulated and cultured in silk fibroin hydrogels at 4, 8, and 12% (w/v). Microscopic images were taken at day 1 (A, D, G for 4, 8, and 12%, respectively), 6 (B, E, H for 4, 8, and 12%, respectively), and 14 (C, F, I for 4, 8, and 12%, respectively). For the 4% gel, hMSCs retained round shape morphology and were nonaggregated in the gel. For the 8 and 12% gel, cells largely deformed and aggregated by day 21, especially for the cells in the 12% gel, as indicated by the arrows in H and I. Bar = 100 μm in all images.
Figure 7.
Histological and cell live-dead analysis of hMSCs encapsulated and cultured in silk fibroin hydrogels at 4, 8, and 12% (w/v). The gel samples were subjected to histological evaluation (H&E) at day 1 (A, E, I for 4, 8, and 12%, respectively), 6 (B, F, J for 4, 8, and 12%, respectively), and 21 (C, G, K for 4, 8, and 12%, respectively), and cell live and dead assay at day 21 (inset of C and D for 4%, H and L for 8 and 12%, respectively). For the 4% gel, hMSCs either retained a round shape in the gel or changed to spindle-like shape and proliferated near the gel surface (A–C), and most cells were alive near the gel surface (inset of C) and in the gel (D), as determined by the dominant green fluorescence. For the 8 and 12% gels, hMSCs largely changed morphology and many of them died, aggregated and/or dissolved, as seen by empty cavities in histological images (arrows in F, G, I, J, K) and few green fluorescent spots in the live-dead assay (H, L). Bar = 100 μm in A–C, E–G, I – K; 101.2 μm in the inset of C; 300 μm in D, H, L.
Figure 8.
DNA quantification of hMSCs encapsulated in silk fibroin hydrogels. DNA content in each gel group was analyzed with PicoGreen assay, and the results were normalized by the wet weight of each gel plug. Values are average ± standard derivation of a minimum of N=3 samples. *significant differences between the groups (student’s t-test, P<0.05).
4. Conclusions
A novel method, based on ultrasonication, was studied to allow the rapid formation of silk fibroin hydrogels. Gelation could be induced in minutes to hours, depending on the sonication power output and duration. Gelation was accompanied with β-sheet structure formation, due to changes in hydrophobic hydration. Low concentrations of K+ and low pH accelerated gelation rates, whereas the presence of Ca2+ and high concentrations of K+ prevented gelation. The silk fibroin hydrogels had mechanical properties superior to those reported previously, in the range of 369–1712 kPa based on compressive modulus. Gel mechanical strength increased with increased silk fibroin solution concentration. The 4% (w/v) silk fibroin hydrogels were suitable for encapsulation for hMSCs; the cells retained viability and proliferation in static culture conditions over weeks.
Acknowledgments
We thank the NIH P41 Tissue Engineering Resource Center for support of this work.
Footnotes
Publisher's Disclaimer: This is a PDF file of an unedited manuscript that has been accepted for publication. As a service to our customers we are providing this early version of the manuscript. The manuscript will undergo copyediting, typesetting, and review of the resulting proof before it is published in its final citable form. Please note that during the production process errors may be discovered which could affect the content, and all legal disclaimers that apply to the journal pertain.
References
- 1.Park JB, Lakes RS. Biomaterials: an introduction. 2. New York: Plenum Press; 1992. [Google Scholar]
- 2.Drury JL, Mooney DJ. Hyrogels for tissue engineering: scaffold design variables and applications. Biomaterials. 2003;24:4337 – 51. doi: 10.1016/s0142-9612(03)00340-5. [DOI] [PubMed] [Google Scholar]
- 3.Lee CH, Singla A, Lee Y. Biomedical applications of collagen. Int J Pharm. 2001;221:1 –22. doi: 10.1016/s0378-5173(01)00691-3. [DOI] [PubMed] [Google Scholar]
- 4.Smidsrød O, Skjäk – Bræk G. Alginate as immobilization matrix for cells. Trends Biotech. 1990;8:71 – 8. doi: 10.1016/0167-7799(90)90139-o. [DOI] [PubMed] [Google Scholar]
- 5.Altman GH, Diaz F, Jakuba C, Calabro T, Horan RL, Chen J, Lu H, Richmond J, Kaplan DL. Silk-based biomaterials. Biomaterials. 2003;24:401 – 16. doi: 10.1016/s0142-9612(02)00353-8. [DOI] [PubMed] [Google Scholar]
- 6.Jin HJ, Kaplan DL. Mechanism of silk processing in insects and spiders. Nature. 2003;424:1057 – 61. doi: 10.1038/nature01809. [DOI] [PubMed] [Google Scholar]
- 7.Horan RL, Antle K, Collette AL, Wang Y, Huang J, Moreau JE, Volloch V, Kaplan DL, Altman GH. In vitro degradation of silk fibroin. Biomaterials. 2005;26:3385–93. doi: 10.1016/j.biomaterials.2004.09.020. [DOI] [PubMed] [Google Scholar]
- 8.Kim UJ, Park J, Kim HJ, Wada M, Kaplan DL. Three-dimensional aqueous-derived biomaterial scaffolds from silk fibroin. Biomaterials. 2005;26:2775 – 85. doi: 10.1016/j.biomaterials.2004.07.044. [DOI] [PubMed] [Google Scholar]
- 9.Ishida M, Asakura T, Yokoi M, Saito H. Solvent- and mechanical-treatment-induced conformational transition of silk fibroins studied by high-resolution solid-state 13C NMR spectroscopy. Macromolecules. 1990;23:88–94. [Google Scholar]
- 10.Nazarov R, Jin HJ, Kaplan DL. Porous 3-D scaffolds from regenerated silk fibroin. Biomacromolecules. 2004;5:718 – 26. doi: 10.1021/bm034327e. [DOI] [PubMed] [Google Scholar]
- 11.Jin HJ, Park J, Valluzzi R, Cebe P, Kaplan DL. Biomaterial films of Bombyx mori silk fibroin with poly(ethylene oxide) Biomacromolecules. 2004;5:711 – 7. doi: 10.1021/bm0343287. [DOI] [PubMed] [Google Scholar]
- 12.Jin HJ, Fridrikh SV, Rutledge GC, Kaplan DL. Electrospinning Bombyx mori silk with poly(ethylene oxide) Biomacromolecules. 2002;3:1233 – 9. doi: 10.1021/bm025581u. [DOI] [PubMed] [Google Scholar]
- 13.Hino T, Tanimoto M, Shimabayashi S. Change in secondary structure of silk fibroin during preparation of its microspheres by spray-drying and exposure to humid atmosphere. J Colloid Interface Sci. 2003;266:68–73. doi: 10.1016/s0021-9797(03)00584-8. [DOI] [PubMed] [Google Scholar]
- 14.Wang X, Wenk E, Matsumoto A, Meinel L, Li C, Kaplan DL. Silk microspheres for encapsulation and controlled release. J Control Release. 2007;117:360 – 70. doi: 10.1016/j.jconrel.2006.11.021. [DOI] [PubMed] [Google Scholar]
- 15.Vollrath F, Knight DP. Liquid crystalline spinning of spider silk. Nature. 2001;410:541 – 8. doi: 10.1038/35069000. [DOI] [PubMed] [Google Scholar]
- 16.Chen X, Knight DP, Vollrath F. Rheological characterization of nephila spidroin solution. Biomacromolecules. 2002;3:644 – 8. doi: 10.1021/bm0156126. [DOI] [PubMed] [Google Scholar]
- 17.Zhou L, Chen X, Shao Z, Huang Y, Knight DP. Effect of metallic ions on silk formation in the Mulberry Silkworm, Bombyx mori. J Phys Chem B. 2005;109:16937 – 45. doi: 10.1021/jp050883m. [DOI] [PubMed] [Google Scholar]
- 18.Dicko C, Vollrath F, Kenney JM. Spider silk protein refolding is controlled by changing pH. Biomacromolecules. 2004;5:704 – 10. doi: 10.1021/bm034307c. [DOI] [PubMed] [Google Scholar]
- 19.Terry AE, Knight DP, Porter D, Vollrath F. pH induced changes in the Rheology of silk fibroin solution from the middle division of Bombyx mori silkworm. Biomacromolecules. 2004;5:768 –72. doi: 10.1021/bm034381v. [DOI] [PubMed] [Google Scholar]
- 20.Wang H, Zhang Y, Shao H, Hu X. A study on the flow stability of regenerated silk fibroin aqueous solution. Int J Biol Macromol. 2005;36:66 – 70. doi: 10.1016/j.ijbiomac.2005.03.011. [DOI] [PubMed] [Google Scholar]
- 21.Kim UJ, Park J, Li C, Jin HJ, Valluzzi R, Kaplan DL. Structure and properties of silk hydrogels. Biomacromolecules. 2004;5:786–92. doi: 10.1021/bm0345460. [DOI] [PubMed] [Google Scholar]
- 22.Matsumoto A, Chen J, Collette AL, Kim UJ, Altman GH, Cebe P, Kaplan DL. Mechanisms of silk fibroin sol-gel transitions. J Phys Chem B. 2006;110:21630 – 8. doi: 10.1021/jp056350v. [DOI] [PubMed] [Google Scholar]
- 23.Fini M, Motta A, Torricelli P, Giavaresi G, Nicoli Aldini N, Tschon M, Giardino R, Migliaresi C. The healing of confined critical size cancellous defects in the presence of silk fibroin hydrogel. Biomaterials. 2005;26:3527 – 36. doi: 10.1016/j.biomaterials.2004.09.040. [DOI] [PubMed] [Google Scholar]
- 24.Motta A, Migliliaresi C, Faccioni F, Torricelli P, Fini M, Giardino R. Fibroin hydrogels for biomedical applications: preparation, characterization and in vitro cell culture studies. J Biomater Sci Polymer Ed. 2004;15:851 – 64. doi: 10.1163/1568562041271075. [DOI] [PubMed] [Google Scholar]
- 25.Sofia S, McCarthy MB, Gronowicz G, Kaplan DL. Functionalized silk-based biomaterials for bone formation. J Biomed Mater Res. 2001;54:139 – 48. doi: 10.1002/1097-4636(200101)54:1<139::aid-jbm17>3.0.co;2-7. [DOI] [PubMed] [Google Scholar]
- 26.Almany L, Seliktar D. Biosynthetic hydrogel scaffolds made from fibrinogen and polyethylene glycol for 3D cell cultures. Biomaterials. 2005;26:2467–77. doi: 10.1016/j.biomaterials.2004.06.047. [DOI] [PubMed] [Google Scholar]
- 27.Kong HJ, Smith MK, Mooney DJ. Designing alginate hydrogels to maintain viability of immobilized cells. Biomaterials. 2003;24:4023–9. doi: 10.1016/s0142-9612(03)00295-3. [DOI] [PubMed] [Google Scholar]
- 28.Hung CT, Mauck RL, Wang CC, Lima EG, Ateshian GA. A paradigm for functional tissue engineering of articular cartilage via applied physiologic deformational loading. Ann Biomed Eng. 2004;32:35–49. doi: 10.1023/b:abme.0000007789.99565.42. [DOI] [PubMed] [Google Scholar]
- 29.Meinel L, Karageorgiou V, Hofmann S, Fajardo R, Snyder B, Li C, Zichner L, Langer R, Vunjak-Novakovic G, Kaplan DL. Engineering bone-like tissue in vitro using human bone marrow stem cells and silk scaffolds. J Biomed Mater Res A. 2004;71:25 – 34. doi: 10.1002/jbm.a.30117. [DOI] [PubMed] [Google Scholar]
- 30.Meinel L, Hofmann S, Karageorgiou V, Zichner L, Langer R, Kaplan D, Vunjak-Novakovic G. Engineering cartilage-like tissue using human mesenchymal stem cells and silk protein scaffolds. Biotechnol Bioeng. 2004;88:379 – 91. doi: 10.1002/bit.20252. [DOI] [PubMed] [Google Scholar]
- 31.Paulusse JMJ, Sijbesma RP. Ultrasound in polymer chemistry: revival of an established technique. J Polymer Sci Polymer Chem. 2006;44:5445 – 53. [Google Scholar]
- 32.Kemmere MF, Kuijpers MWA, Prickaerts RMH, Keurentjes JTF. A Novel process for ultrasound-induced radical polymerization in CO2-expanded fluids. Macromol Mater Eng. 2005;290:302 – 10. [Google Scholar]
- 33.Seida Y, Takeshita K, Nakano Y. Phase behavior of N-isopropylacrylamide/acrylic acid copolymer hydrogels prepared with ultrasound. J Appl Polymer Sci. 2003;90:2449 – 52. [Google Scholar]
- 34.Isozaki K, Takaya H, Naota T. Ultrasound-induced gelation of organic fluids with metalated peptides. Angew Chem. 2007;119:2913 – 5. doi: 10.1002/anie.200605067. [DOI] [PubMed] [Google Scholar]
- 35.Yokoi H, Kinoshita T, Zhang S. Dynamic reassembly of peptide RADA16 nanofiber scaffold. Proc Nat Acc Sci. 2005;102:8414 – 9. doi: 10.1073/pnas.0407843102. [DOI] [PMC free article] [PubMed] [Google Scholar]
- 36.Stathopulos PB, Scholz GA, Hwang Y, Rumfeldt JAO, Lepock JR, Meiering EM. Sonication of proteins causes formation of aggregations that resemble amyloid. Protein Sci. 2004;13:3017 – 27. doi: 10.1110/ps.04831804. [DOI] [PMC free article] [PubMed] [Google Scholar]
- 37.Mason TJ, Peters D. Practical sonochemistry: Uses and applications of ultrasound. 2. Horwood Publishing Chichester; West Sussex, UK: 2002. [Google Scholar]
- 38.Giraud-Guille MM, Besseau L, Herbage D, Gounon P. Optimization of collagen liquid crystalline assemblies: Influence of sonic fragmentation. J Struct Biol. 1994;113:99–106. [Google Scholar]
- 39.Bryant SJ, Bender RJ, Durand KL, Anseth KS. Encapsulating chondrocytes in degrading PEG hydrogels with high modulus: engineering gel structural changes to facilitate cartilaginous tissue production. Biotechnol Bioeng. 2004;86:747–55. doi: 10.1002/bit.20160. [DOI] [PubMed] [Google Scholar]
- 40.Kang Y, Yang J, Khan S, Anissian L, Ameer GA. A new biodegradable polyester elastomer for cartilage tissue engineering. J Biomed Mater Res A. 2006;77:331–9. doi: 10.1002/jbm.a.30607. [DOI] [PubMed] [Google Scholar]
- 41.Rowley JA, Madlambayan G, Mooney DJ. Alginate hydrogels as synthetic extracellular matrix materials. Biomaterials. 1999;20:45–53. doi: 10.1016/s0142-9612(98)00107-0. [DOI] [PubMed] [Google Scholar]
- 42.Broderick EP, O’Halloran DM, Rochev YA, Griffin M, Collighan RJ, Pandit AS. Enzymatic stabilization of Gelatin-based scaffolds. J Biomed Mater Res B Appl Biomater. 2004;72:37–42. doi: 10.1002/jbm.b.30119. [DOI] [PubMed] [Google Scholar]
- 43.Zhang XZ, Sun GM, Wu DQ, Chu CC. Synthesis and characterization of partially biodegradable and thermosensitive hydrogel. J Mater Sci Mater Med. 2004;15:865–75. doi: 10.1023/B:JMSM.0000036274.83104.fe. [DOI] [PubMed] [Google Scholar]
- 44.Jin HJ, Park J, Karageorgiou V, Kim UJ, Valluzzi R, Cebe P, Kaplan DL. Water-stable silk films with reduced β-sheet content. Adv Funct Mater. 2005;15:1241–7. [Google Scholar]
- 45.Nuttelman CR, Tripodi MC, Anseth KS. Synthetic hydrogel niches that promote hMSC viability. Matrix Biol. 2005;24:208–18. doi: 10.1016/j.matbio.2005.03.004. [DOI] [PubMed] [Google Scholar]
- 46.Nuttelman CR, Benoit DS, Tripodi MC, Anseth KS. The effect of ethylene glycol methacrylate phosphate in PEG hydrogels on mineralization and viability of encapsulated hMSCs. Biomaterials. 2006;27:1377–86. doi: 10.1016/j.biomaterials.2005.08.014. [DOI] [PubMed] [Google Scholar]
- 47.Mauck RL, Yuan X, Tuan RS. Chondrogenic differentiation and functional maturation of bovine mesenchymal stem cells in long-term agarose culture. Osteoarthritis and cartilage. 2006;14:179–89. doi: 10.1016/j.joca.2005.09.002. [DOI] [PubMed] [Google Scholar]
- 48.Lewus KE, Nauman EA. In vitro characterization of a bone marrow stem cell-seeded collagen gel composite for soft tissue grafts: effects of fiber number and serum concentration. Tissue Eng. 2005;11:1015–22. doi: 10.1089/ten.2005.11.1015. [DOI] [PubMed] [Google Scholar]
- 49.Majumdar MK, Banks V, Peluso DP, Morris EA. Isolation, characterization, and chondrogenic potential of human bone marrow-derived multipotential stromal cells. J Cell Physiol. 2000;185:98–106. doi: 10.1002/1097-4652(200010)185:1<98::AID-JCP9>3.0.CO;2-1. [DOI] [PubMed] [Google Scholar]
- 50.Boison D. Adenosine kinase, epilepsy and stroke: mechanisms and therapies. Trends Pharmacol Sci. 2006;27:652–8. doi: 10.1016/j.tips.2006.10.008. [DOI] [PubMed] [Google Scholar]
- 51.Ramdi H, Legay C, Lievremont M. Influence of matricial molecules on growth and differentiation of entrapped chondrocytes. Exp Cell Res. 1993;207:449–54. doi: 10.1006/excr.1993.1214. [DOI] [PubMed] [Google Scholar]


