

Summary
We present an implementation of the TOXCAT membrane protein self-association assay that measures the change in apparent free energy of transmembrane helix dimerization caused by point mutations. Quantifying the reporter gene expression from cells carrying wild type and mutant constructs shows that single point mutations that disrupt dimerization of the transmembrane domain of glycophorin A reproducibly lower the TOXCAT signal more than one hundred-fold. Replicate cultures can show up to three-fold changes in the level of expression of the membrane bound fusion construct, and correcting for these variations improves the precision of the calculated apparent free energy change. The remarkably good agreement between our TOXCAT apparent free energy scale and free energy differences from sedimentation equilibrium studies for point mutants of the glycophorin A transmembrane domain dimer indicate that sequence changes usually affect membrane helix-helix interactions quite similarly in these two very different environments. However, the effects of point mutations at threonine 87 suggest that intermonomer polar contacts by this side chain contribute significantly to dimer stability in membranes but not in detergents. Our findings demonstrate that a comparison of quantitative measurements of helix-helix interactions in biological membranes and genuine thermodynamic data from biophysical measurements on purified proteins can elucidate how changes in the lipidic environment modulate membrane protein stability.
Keywords: dimerization, glycophorin A, transmembrane domain, thermodynamics, TOXCAT
Introduction
Lateral interactions between transmembrane helices are important determinants of the folding and stability of α-helical integral membrane proteins and can provide a significant driving force for oligomerization of single-spanning proteins 1. Biochemical and biophysical methods have provided measures of the stability of transmembrane domain (TMD) oligomers in detergents 2–5 and in synthetic membranes 6; 7, and studies with sequence variants have revealed how amino acid sequence can influence transmembrane helix-helix interactions 8–11. These in vitro approaches have been complemented by the development of cell-based assays for TMD interactions within biological membranes 12–17. In these biological assays, membrane spanning domains of interest are fused to oligomerization-dependent DNA binding domains and the expressed chimeric proteins are localized to the inner membrane of Escherichia coli with their DNA binding domains in the cytosol. Association of the TMDs brings the DNA binding domains into close proximity, allowing them to bind to a target regulatory DNA sequence and thereby modulate transcription of a reporter gene. The extent of transmembrane helix-helix interaction can be inferred from the level of reporter gene expression; in some assays, association causes transcriptional activation 12; 14, whereas in others it causes repression 15;17.
A rank order of association propensity for different membrane spans can be established with any of these assays, and site-directed mutagenesis has been used in combination with several different biological assays for transmembrane helix association to identify residues that are critical to helix-helix interactions of natural 12;13; 18–30 and designed 31; 32 membrane spans. Sequences that have been shown to associate tightly and specifically, such as glycophorin A 33;34, usually serve as positive controls in these experiments. The qualitative conclusions drawn from these data about the propensity of TMDs to interact can be contrasted with the quantitative thermodynamic information obtained from biophysical approaches to measuring interactions between membrane proteins. In particular, sedimentation equilibrium ultracentrifugation has been used to measure free energies of association for many different membrane protein systems, and a few studies have probed the sequence dependence of helix-helix association in considerable detail 9–11, allowing the relationship between membrane protein structure and stability to be explored quantitatively. However, because these measurements are performed on proteins in a detergent micelle environment, the relevance of these data to the behavior of the same proteins in native membranes is not clear.
The well-studied transmembrane span of glycophorin A provides an excellent system in which to compare the stability and sequence specificity of TMD interactions in different lipidic environments. The sequence dependence of glycophorin A TMD dimerization was first examined by a saturation mutagenesis approach using an SDS-PAGE assay 33;34, and a systematic set of interfacial substitutions have been studied by sedimentation equilibrium analytical ultracentrifugation 2; 8–10; 35. The ToxR 12; 13 and TOXCAT 14 biological assays have been used to examine both wild type glycophorin A and a number of mutants, and the rank order of stability of mutants analyzed by biophysical and biological approaches agrees well 8. Here, we examine twenty eight point mutants of the glycophorin A transmembrane domain using the TOXCAT assay with the goal of quantitatively assessing the effects of point mutations on dimerization of the membrane span in vivo. We describe an implementation of TOXCAT that enables us to determine the apparent change in the free energy of dimerization due to mutations (ΔΔGapp). We find generally good agreement between these biological ΔΔGapp values and previously reported ΔΔGmut values for these mutations from sedimentation equilibrium in detergents. Outliers suggest that polar interactions of the side chain γ oxygen of threonine 87 of glycophorin A are important to TMD dimer stability in bilayers but not in detergents.
Theory and assumptions
TOXCAT is a biological assay in which expression of the reporter gene chloramphenicol acetyltransferase (CAT) is driven by oligomerization-dependent transcriptional activation by a membrane-inserted fusion protein 14 (see Figure 1). We seek to express the association constant describing dimerization of the TOXCAT fusion protein in terms of readily measurable parameters. Assuming that the fusion protein is present in the cell membrane only as monomers or dimers, the oligomerization reaction of the fusion protein and the corresponding equilibrium association constant Ka are given by
Figure 1. Schematic representation of the TOXCAT assay 14.

ToxR′ domains (diamonds) can activate transcription of the reporter gene (CAT) if brought together by the transmembrane domains. The maltose binding protein domain (circles) helps direct the insertion of the construct into the membrane, complements the malE mutation in the host cells, and serves as an epitope for quantifying the level of fusion protein.
| (1) |
where [P] represents the mole fraction of monomeric fusion protein (relative to moles of all lipids and proteins in the membrane), [P2] represents the mole fraction of dimeric fusion protein, and the mole fraction of total protein, [Ptotal], is given by
| (2) |
and so
| (3) |
In the limit where [P2] is small we can make the approximation
| (4) |
which simplifies the expression for the apparent equilibrium constant to
| (5) |
This expression for Kapp can be related to measurable parameters from the TOXCAT assay. We assume that the mole fraction of dimeric TOXCAT fusion protein, [P2], is given by the expression level of the reporter gene, CATlysate, times a proportionality constant α,
| (6) |
and that the mole fraction of total TOXCAT fusion protein, [Ptotal], is given by the western blot band intensity of a standardized amount of membrane, WBlysate, times a proportionality constant β that includes the moles of total lipid and protein in the membrane aliquot
| (7) |
To determine the absolute Kapp (and thus the apparent free energy of association, ΔΔGapp), we would need the proportionality constants α and β. However, when we write an expression for the ratio of the apparent association constants for wild type and mutant TMDs
| (8) |
we can rearrange the terms, cancel the proportionality constants, and calculate ΔΔGapp, the apparent change in free energy of association that results from a mutation to the TMD sequence, using the expression
| (9) |
where the term CATmut/CATWT is the ratio of CAT activity from normalized amounts of cells expressing mutant or wild type constructs, and the term WBWT/WBmut is the ratio of the band intensities for wild type or mutant TOXCAT fusion proteins on a western blot of normalized amounts of cells.
This approach will begin to break down when a substantial fraction of the fusion protein in the membrane forms dimers, so that the amount of monomeric protein can no longer be approximated as the total amount of protein. Analysis of our data indicates that the assumption of a small fraction of dimer does not significantly bias our TOXCAT results and that the simplification we employ permits us to extract useful information about the sequence dependence of the stability of helix-helix interactions inside membranes of living cells.
Results
Wild type and mutant glycophorin A TOXCAT fusion proteins insert into the E. coli inner membrane with the appropriate topology
We explored the effects of single point mutations on the TOXCAT in vivo dimerization signal for the transmembrane domain of glycophorin A by altering the TMD sequence of the ToxR′(GpATMD)MBP construct described by Russ and Engelman 14. We generated the library of single point mutants of glycophorin A previously studied by Fleming and colleagues in vitro using sedimentation equilibrium analytical ultracentrifugation 2; 8–10; 35; most of these had previously been characterized under conditions of SDS-PAGE 33; 36. After transformation of these TOXCAT constructs into E. coli NT326 cells, we tested the ability of the wild type and mutant fusion proteins to complement the malE phenotype of the NT326 strain by growing each construct on plates containing maltose as the sole carbon source. Cells containing constructs that lack a TMD do not grow, but the wild type ToxR′(GpATMD)MBP construct and all point mutants support robust growth on maltose (Figure 2), indicating that the MBP domains of these fusion proteins are being targeted to the periplasm of the NT326 cells. We conclude that the expected topology (see Figure 1) is being achieved by these proteins, in agreement with previous reports for wild type glycophorin A and point mutants in the ToxR 12; 13 and TOXCAT 14 assays.
Figure 2. Complementation assays for wild type and selected mutant glycophorin A ToxR′ fusion constructs.
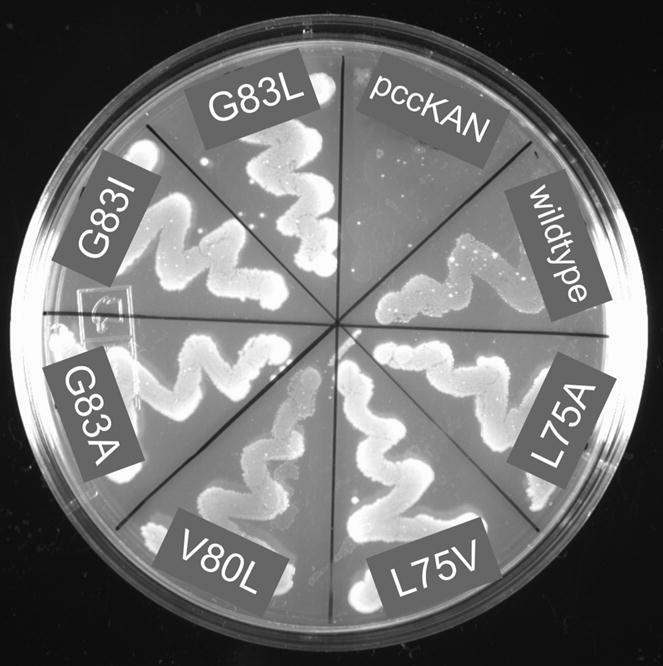
NT326 cells (malE) carrying various constructs were streaked on a plate with maltose as the sole carbon source and grown for three daysat 37 °C. All ToxR′(GpATMD)MBP fusion constructs permit robust growth of NT326 cells on maltose, while control transformants (pccKAN) do not.
Mutations can modulate the glycophorin A TOXCAT signal by a factor of 200
We quantified the TOXCAT dimerization signal using the spectrophotometric CAT assay 37 that we had previously applied in studies of BNIP3 TMD dimerization 38. The colorimetric assay has poorer absolute sensitivity than assays based on radioactive 39 or fluorescent 40 substrates employed for quantifying CAT activity, but the signal can be measured quickly and with high precision because the data correspond to the slope of a straight line from a least-squares fit to 20 or 40 absorption measurements over 1 or 2 minutes in the same cuvette. Standard errors in triplicate assays of a lysate having high levels of CAT activity are at the limit of pipetting precision, while at low levels of CAT activity, the error between repeats is about 0.1 U. NT326 cells expressing wild type ToxR′(GpATMD)MBP constructs give lysates that contain 190–200 U of CAT, while cells carrying certain point mutants in the GpA TMD give lysates that contain 0.2–0.5 U of CAT (see Figure 3). These differences in TOXCAT signal are reproduced across independent cultures (see columns in Table 1). The ability to accurately and precisely measure the level of expressed CAT is essential to our approach, and we note that the amount of cells harvested to prepare the lysates was optimized to improve the lower detection limit of the assay.
Figure 3. Reporter gene activity and fusion construct expression data for one replicate of mutant and wild type glycophorin A constructs.

Yellow bars represent the CAT activity quantified from cleared lysates, and error bars represent the standard error for three measurements of each lysate. Bands below the bars are details from western blots of the ToxR fusions; the intensities of these bands were quantified by photon counting of chemiluminescence. The differences in the observed CAT activity are much larger than the differences in ToxR fusion expression level.
Table 1.
Terms contributing to the apparent free energy change of glycophorin A dimerization
| −RT ln [CATmut/CATWT] (kcal mol−1) | −RT ln [WBWT/WBmut]2 (kcal mol−1) | ΔΔGapp (kcal mol−1) | SDCAT + SDWB | |||||||||||
|---|---|---|---|---|---|---|---|---|---|---|---|---|---|---|
| seq | 1 | 2 | 3 | SDCAT | 1 | 2 | 3 | SDWB | 1 | 2 | 3 | mean | SDΔΔG | |
| L75A | 0.70 | 0.48 | 0.46 | 0.13 | 0.21 | −0.16 | −0.02 | 0.19 | 0.91 | 0.32 | 0.44 | 0.56 | 0.31 | 0.32 |
| L75G | 0.08 | 0.06 | 0.14 | 0.04 | 0.37 | 0.27 | 0.29 | 0.05 | 0.45 | 0.33 | 0.43 | 0.41 | 0.07 | 0.10 |
| L75I | 1.40 | 1.13 | 1.05 | 0.18 | −0.11 | 0.49 | 0.21 | 0.30 | 1.29 | 1.62 | 1.26 | 1.39 | 0.20 | 0.48 |
| L75V | 1.53 | 1.11 | 1.33 | 0.21 | 0.06 | 1.00 | 0.18 | 0.51 | 1.59 | 2.11 | 1.52 | 1.74 | 0.32 | 0.72* |
| I76A | 0.68 | 0.83 | 0.65 | 0.09 | −0.10 | −0.17 | −0.31 | 0.11 | 0.57 | 0.66 | 0.34 | 0.52 | 0.16 | 0.20 |
| I76G | 1.11 | 0.56 | 0.78 | 0.28 | 0.27 | 0.73 | 0.36 | 0.24 | 1.38 | 1.30 | 1.14 | 1.27 | 0.13 | 0.52* |
| I76L | 0.08 | 0.06 | 0.55 | 0.28 | 0.47 | 0.64 | 0.01 | 0.33 | 0.55 | 0.71 | 0.57 | 0.61 | 0.09 | 0.61* |
| I76V | 0.29 | −0.07 | −0.01 | 0.19 | 0.56 | 0.46 | 0.03 | 0.28 | 0.85 | 0.39 | 0.03 | 0.42 | 0.41 | 0.47 |
| G79A | 1.95 | 1.45 | 1.70 | 0.25 | 0.15 | 0.42 | −0.42 | 0.43 | 2.10 | 1.88 | 1.28 | 1.75 | 0.42 | 0.68 |
| G79I | 4.17 | 5.08 | 4.63 | 0.45 | −0.09 | −0.08 | 0.13 | 0.12 | 4.08 | 5.00 | 4.75 | 4.61 | 0.47 | 0.58 |
| G79L | 2.23 | 1.93 | 2.35 | 0.22 | 0.71 | 0.87 | 0.02 | 0.46 | 2.94 | 2.80 | 2.37 | 2.70 | 0.30 | 0.67* |
| G79V | 2.44 | 1.91 | 2.66 | 0.39 | −0.04 | 1.04 | −0.43 | 0.76 | 2.40 | 2.95 | 2.23 | 2.53 | 0.37 | 1.15** |
| V80A | 0.51 | 0.01 | 0.37 | 0.25 | 0.06 | 1.15 | −0.16 | 0.70 | 0.57 | 1.16 | 0.21 | 0.64 | 0.48 | 0.95* |
| V80G | 0.70 | 0.71 | 0.74 | 0.03 | −0.21 | −0.18 | −0.45 | 0.15 | 0.49 | 0.53 | 0.29 | 0.44 | 0.13 | 0.17 |
| V80I | 0.45 | 0.10 | 0.13 | 0.19 | 0.24 | −0.13 | 0.11 | 0.19 | 0.69 | −0.03 | 0.24 | 0.30 | 0.36 | 0.38 |
| V80L | 0.16 | 0.14 | 0.08 | 0.04 | 0.11 | 0.45 | −0.10 | 0.28 | 0.27 | 0.59 | −0.01 | 0.28 | 0.30 | 0.32 |
| G83A | 3.25 | 3.27 | 3.48 | 0.13 | 0.55 | 0.69 | 0.52 | 0.09 | 3.80 | 3.97 | 4.00 | 3.92 | 0.11 | 0.22 |
| G83I | 4.76 | 4.01 | 4.53 | 0.39 | 0.54 | 0.82 | 0.68 | 0.14 | 5.30 | 4.83 | 5.21 | 5.11 | 0.25 | 0.53 |
| G83L | 4.31 | 3.86 | 4.44 | 0.30 | 0.19 | 0.82 | 0.84 | 0.37 | 4.50 | 4.68 | 5.28 | 4.82 | 0.41 | 0.68 |
| G83V | 3.71 | 3.86 | 3.26 | 0.31 | 0.01 | −0.07 | −0.09 | 0.05 | 3.72 | 3.79 | 3.17 | 3.56 | 0.34 | 0.36 |
| V84A | 3.05 | 3.39 | 4.53 | 0.78 | 0.04 | 0.05 | −1.11 | 0.67 | 3.09 | 3.44 | 3.42 | 3.32 | 0.20 | 1.44** |
| V84I | 0.24 | 0.28 | 0.24 | 0.02 | −0.16 | 0.37 | 0.52 | 0.36 | 0.08 | 0.65 | 0.76 | 0.50 | 0.37 | 0.38 |
| V84L | 3.38 | 3.23 | 2.62 | 0.41 | 0.42 | 0.37 | 0.09 | 0.18 | 3.80 | 3.60 | 2.70 | 3.37 | 0.58 | 0.58 |
| T87A | 2.93 | 3.73 | 4.99 | 1.03 | 0.45 | 0.34 | −1.00 | 0.81 | 3.38 | 4.07 | 3.99 | 3.81 | 0.37 | 1.84** |
| T87I | 4.31 | 3.73 | 4.53 | 0.42 | 0.10 | 0.32 | −0.39 | 0.36 | 4.40 | 4.05 | 4.14 | 4.20 | 0.18 | 0.78** |
| T87L | 3.46 | 3.99 | 3.32 | 0.36 | 0.04 | 0.02 | 0.54 | 0.30 | 3.50 | 4.01 | 3.86 | 3.79 | 0.26 | 0.65* |
| T87S | −0.12 | 0.03 | −0.01 | 0.08 | 0.30 | 0.03 | 0.50 | 0.23 | 0.18 | 0.07 | 0.49 | 0.25 | 0.22 | 0.31 |
| T87V | 4.36 | 4.17 | 5.08 | 0.48 | −0.58 | −0.28 | −0.74 | 0.24 | 3.78 | 3.89 | 4.34 | 4.01 | 0.29 | 0.72* |
| avg | 0.28 | 0.32 | 0.29 | 0.60* | ||||||||||
SDCAT, SDWB: standard deviation of the CAT term, −RT ln [CATmut/CATWT], and the WB term, −RT ln [WBWT/WBmut], for the three independent cultures
SDΔΔG: standard deviation of ΔΔGapp from three independent cultures
sum of the standard errors of the CAT and WB terms exceeds the standard error of ΔΔGapp by 0.30 kcal mol−1 or more
sum of the standard errors of the CAT and WB terms exceeds the standard error of ΔΔGapp by 0.60 kcal mol−1 or more
Expression levels of the TOXCAT fusion protein vary significantly from culture to culture
Differences in the TOXCAT signals of two cultures can arise from differences in the self-association of the membrane-inserted fusion proteins but may also reflect variations in the total amounts of fusion protein expressed. To control for this possibility, each culture assayed for CAT activity was also assayed to determine the relative levels of full-length fusion construct present. Whole cell lysates from cells expressing wild type and mutant constructs were separated by SDS-PAGE and protein levels were quantified in western blots using an anti-MBP primary antibody. NT326 cultures carrying ToxR′(GpATMD)MBP mutants expressed slightly more protein (115 %) than wild type on average, and the distribution of protein levels was quite broad (see Figure 4), with cultures exhibiting as little as 40 % or as much as 260 % of wild type fusion protein expression. 50 of the 84 cultures (60 %) showed between 85 % and 150 % of wild type fusion protein levels, whereas 72 of the 84 cultures (86 %) expressed between 67 % and 200 % of wild type levels. Certain constructs (Thr87Val, Gly83Ala) reproducibly under- or over-expressed relative to wild type, but variation in expression can be independent of the sequence of the mutant TMD: in two instances (Val84Ala and Gly79Val), cultures grown from the same glycerol stock on different days gave lysates whose expression level of fusion protein varied more than three fold relative to wild type cultures grown on those same days. These differences can be expected to have strong effects on the amount of dimerization signal (CAT activity) seen in these cells.
Figure 4. Histogram of the variation in ToxR′(GpATMD)MBP fusion expression compared to wild type.
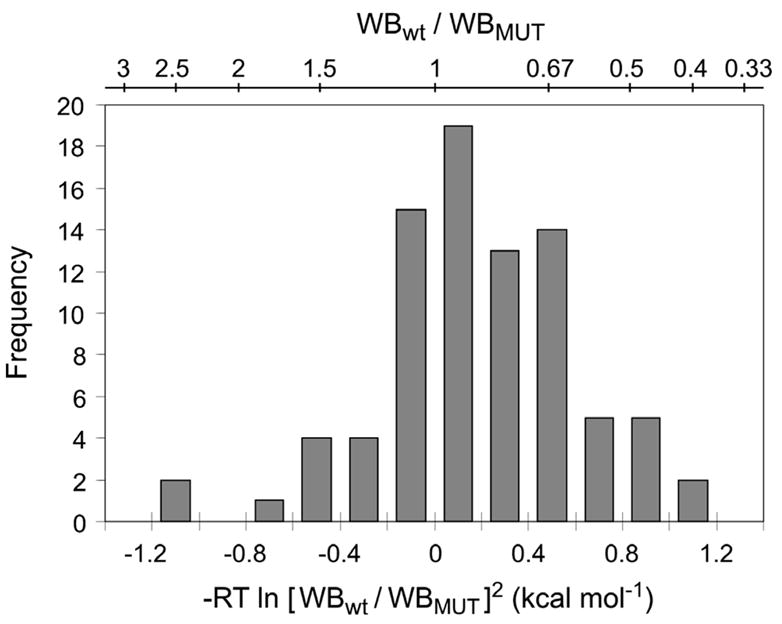
The top scale gives the ratio of wild type to mutant western blot band intensity; the bottom scale converts this ratio to the term used to correct the apparent free energy. Each of the 84 mutant cultures is represented in this figure, scaled to the wild type culture with which it was grown on that particular day. The level of expression of the fusion construct can affect the apparent free energy by as much as 1 kcal mol−1 in either direction.
CAT activity and fusion protein levels can be combined to give precise values for ΔΔGapp
To show how both CAT activity and the level of TOXCAT fusion protein impact the calculation of ΔΔGapp, we separate the logarithm in equation 9 to give
| (10) |
and report −RT ln (CATmut/CATWT) and −RT ln (WBWT/WBmut)2 in units of kcal mol−1 for each culture studied (see Table 1). The term based on CAT activities ranges from −0.12 to +5.08 kcal mol−1, indicating that the CAT data can report on very significant disruption of transmembrane domain dimerization. The term based on western blot intensities ranges from −1.11 to +1.15 kcal mol−1, showing that the measured level of TOXCAT protein can contribute appreciably, in either direction, to the final value of ΔΔGapp. We observe a much larger range of raw CAT values than blot values, but because our derivation treats fusion protein interaction as a bimolecular association, the squaring of the blot ratio doubles the impact of the differences in blot intensities. Based only on the magnitudes of the CAT and blot terms, it would appear that both can be important to calculating ΔΔGapp.
For many mutants, each of the terms in equation 10 clusters closely for the three independent cultures: as seen in Table 1 for Gly83Ala, the CAT-based terms are 3.25, 3.27, and 3.48 kcal mol−1 (standard deviation = 0.13 kcal mol−1) and the blot-based terms are 0.55, 0.69, and 0.52 kcal mol−1 (standard deviation = 0.09 kcal mol−1). Although this particular example is among the best in the dataset, the average standard deviations for the CAT-based terms and the blot-based terms for the 28 mutants in Table 1 are 0.28 and 0.32 kcal mol−1, respectively, demonstrating that our experimental protocol is usually highly reproducible. In some instances, however, the three independent cultures show large differences in the measured parameters. Mutant Val84Ala has CAT-based terms of 3.05, 3.39, and 4.53 kcal mol−1 (mean = 3.66, standard deviation = 0.78 kcal mol−1) and blot-based terms of 0.04, 0.05, and −1.11 kcal mol−1 (mean = −0.34, standard deviation = 0.67 kcal mol−1). Summing these averages gives ΔΔGapp = 3.32 kcal mol−1 with a standard deviation of 1.45 kcal mol−1, which initially suggests that ΔΔGapp is much less reliable for this particular mutant than for others. However, if the CAT-based and blot-based terms for each independent culture are first added together, the independently determined values for ΔΔGapp are 3.09, 3.44, and 3.42 kcal mol−1 (mean = 3.32, standard deviation = 0.20 kcal mol−1), which indicates that this mutant also shows good reproducibility. This demonstrates that the CAT and western blot values are correlated, and suggests that our blot-based term compensates for variations in the fusion protein expression level that affect the CAT activity measured in cell lysates. This compensation is observed over the entire data set: Table 1 shows that the average standard deviation of the independently determined values for ΔΔGapp is 0.29 kcal mol−1, whereas the sum of the average standard deviations of the CAT and western blot terms is 0.60 kcal mol−1. Mutants for which the sum of the standard deviations of the CAT and western blot terms exceeds the standard deviation of ΔΔGapp by at least 0.30 (or 0.60) kcal mol−1 are identified by single (or double) asterisks in the last column of Table 1. It is also noteworthy that the standard deviation of ΔΔGapp does not exceed the sum of the CAT and western blot standard deviations for any of the 28 mutants, as might occur by chance even if the variances of the two terms were merely uncorrelated.
ΔΔGapp corresponds closely to ΔΔGmut from ultracentrifugation
We compared our set of ΔΔGapp values for point mutants of the glycophorin A TMD with the thermodynamic data of Fleming and colleagues 2; 8–10 for which the free energy change of dimerization associated with a mutation, ΔΔGmut, has been determined by measuring the free energy of association of both wild type and mutant fusion proteins in detergent micelles by sedimentation equilibrium analytical ultracentrifugation. Using Student’s t-test, only 8 of 28 mutants – Leu75Gly, Ile76Ala, Val80Gly, Gly83Ile, Val84Ala, Thr87Ala, Thr87Ile, and Thr87Val – show values of ΔΔGapp that differ significantly from ΔΔGmut (at the 95% confidence level; see Materials and Methods). This could simply mean that the t-test fails to find significant differences because the data have large standard deviations. However, the same t-test criteria show that 18 of the 28 values for ΔΔGapp differ significantly from no change in stability (0.0 ± 0.1 kcal mol−1), another set of 18 values for ΔΔGapp differ significantly from the most disruptive ΔΔGmut (3.8 ± 0.1 kcal mol−1), and 17 values for ΔΔGapp differ significantly from an intermediate value of 1.9 ± 0.1 kcal mol−1. Thus, the range and standard deviations of ΔΔGapp do allow the t-test to distinguish among the range of values of ΔΔGmut. We conclude that the measured values of ΔΔGapp are broadly distributed for the different mutants and that the majority of these values correspond closely to the independently determined values of ΔΔGmut.
Regression analysis of ΔΔGapp versus ΔΔGmut for all 28 mutants yields a fit with a slope of 1.07 and a correlation coefficient R = 0.74 (Figure 5); note that the error bars in Figure 5 represent the standard errors for three independent ultracentrifuge experiments (for ΔΔGmut) or the standard errors for three independent TOXCAT cultures (for ΔΔGapp). Omitting the five mutants at position Thr87 (for reasons presented in the Discussion) improves the fit (R = 0.80, slope = 1.08, intercept = 0.06). Together, the t-tests and regression analyses indicate that the effects of individual point mutations on glycophorin A dimerization as assessed in vivo using TOXCAT are usually similar to the effects seen by analytical ultracentrifugation of purified proteins in detergent. These findings suggest that the two methods are measuring the same basic phenomena despite the differences between the contexts in which the measurements are made. By contrast, statistically significant differences between ΔΔGapp and ΔΔGmut for certain mutants suggest that the association tendencies of these particular glycophorin A variants are not the same in detergents and in TOXCAT.
Figure 5. Correlation of TOXCAT apparent free energy changes with free energy differences determined by sedimentation equilibrium analytical ultracentrifugation 2; 8–10; 35.
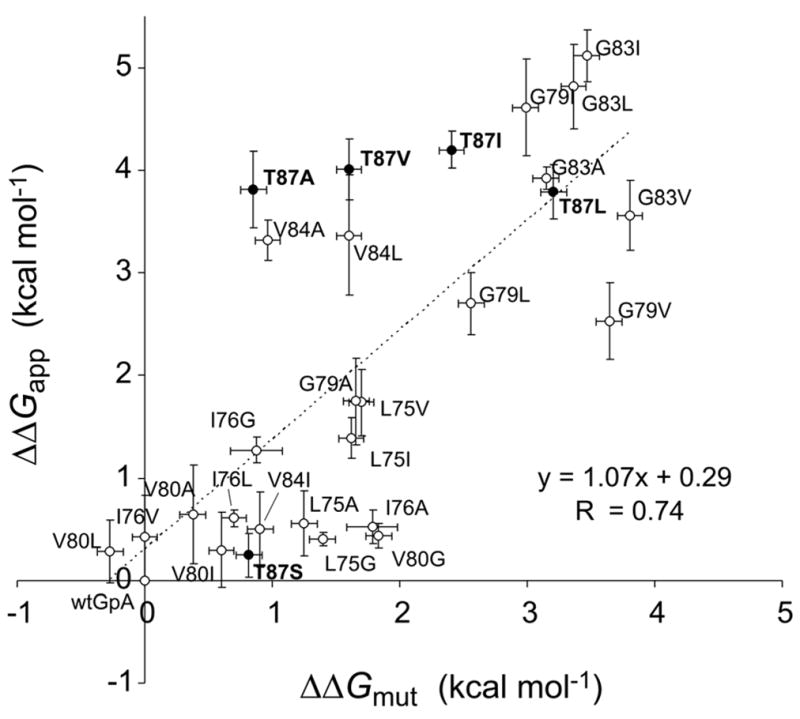
Mutations involving Thr87 are represented as black dots and are labeled in bold; omitting these data points from the fit gives R = 0.80. The near-unity slope of this fit shows that the TOXCAT assay samples the same range as the biophysical measurements.
Evaluating the assumption that the fusion protein is largely monomeric
Although our method does not directly determine the mole fraction of monomer and dimer for any of our ToxR fusions, the wide range of observed CAT activities for different mutants and the corresponding values from ultracentrifugation for ΔΔGmut allow us to make inferences about the fractional association of the wild type fusion protein. If the wild type ToxR′(GpATMD)MBP fusion protein were present at high mole fraction and thus existed primarily as dimers in E. coli membranes, then slightly destabilizing mutations (+1.0 kcal mol−1) would be expected to cause little change in the mole fraction of dimeric protein or in the observed CAT activity. We simulated the effects of perturbing the free energy of dimerization assuming that different initial levels of association for the wild type protein were giving rise to wild type levels of CAT activity (see Figure 6). Essentially no change in observed CAT signal would be expected if an overwhelmingly dimeric wild type construct (fraction monomer = 0.002, corresponding to the regime where [Ptotal] ≫ 1/Ka) were destabilized by up to 4 kcal mol−1. By comparing the theoretical lines in Figure 6 to raw CAT data for mutants expressing identical amounts of fusion protein, we conclude that the constructs are expressed at low enough concentration that even wild type fusion protein must be significantly monomeric. It is necessary to assume a wild type monomer fraction of at least 0.33, and probably ≥ 0.5, to account for the range of observed CAT activity and to allow direct correlation with the free energy changes measured independently in the ultracentrifuge for the same glycophorin A mutants.
Figure 6. Simulations suggest that the effects of mutations on measured CAT levels are consistent with low fractional dimerization of the wild type fusion protein.
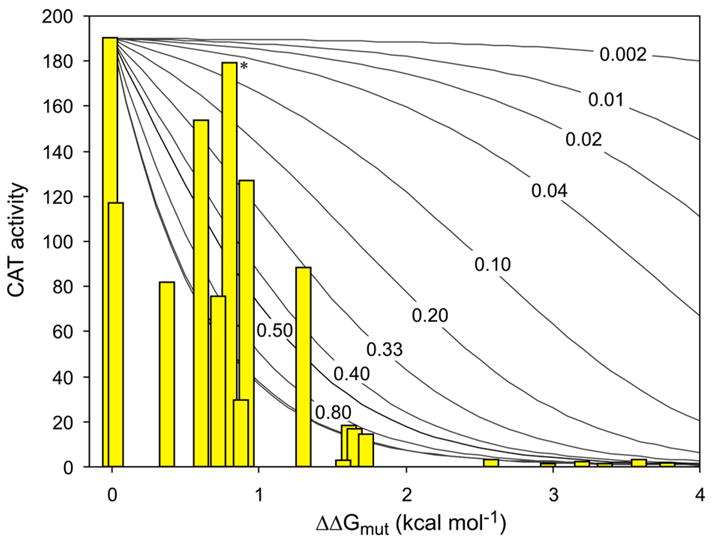
The solid curves depict how CAT activity (y-axis) would drop off as the dimer is destabilized up to 4 kcal mol−1 (x-axis) when the wild type construct is assumed to be present at the indicated mole fractions of monomer; the two unlabeled lines farthest to the left are for wild type monomer mole fractions of 0.01 and 0.001. CAT activity (yellow bars) for wild type glycophorin A and 18 mutants are presented at horizontal positions corresponding to the free energy change for each variant as measured by sedimentation equilibrium 2; 8–10; 35. Outliers from the t-test comparison have been excluded. CAT activities are shown are for individual replicates with very similar fusion protein expression levels, eliminating the need to correct for concentration effects. The yellow bar labeled with an asterisk corresponds to Thr87Ser, which is mildly disruptive by sedimentation equilibrium but dimerizes as wildtype in TOXCAT.
It is important to understand how the approximation in our derivation affects the value of the apparent association constant Kapp, from which we calculate ΔΔGapp. The correct expression for Ka squares [Ptotal] − 2[P2] in the denominator (equation 3), but our expression for Kapp squares a term proportional to [Ptotal]. We approximate the fraction of monomer as [Ptotal] because calculating [Ptotal] − 2[P2] from TOXCAT observable parameters would require coefficients α and β from equations 6 and 7. The effect of this approximation on ΔΔGapp is illustrated by the calculated curves in Figure 7. In the dilute limit, where nearly 100% of the wild type fusion protein is monomeric, ΔΔGapp calculated from equation 10 accurately reflects ΔΔG over the entire range. However, if the wild type construct were only 10% monomeric at the concentrations in the membrane, a true destabilization of 1.0 kcal mol−1 would give ΔΔGapp of just 0.08 kcal mol−1 because the fraction of dimer would only drop from 90% to 78%. The concomitant doubling of the fraction of monomer (10% to 22%) is neglected in calculating ΔΔGapp due to our approximation. Thus, if the wild type ToxR′(GpATMD)MBP fusion protein were primarily dimeric in E. coli membranes, the assumption used in calculating ΔΔGapp from TOXCAT data would compress the apparent free energy scale, resulting in the slope of a plot of ΔΔGapp versus ΔΔGmut being much less than unity. For instance, if the wild type construct were just 10% monomeric, the slope of a regression line for ΔΔGapp versus ΔΔG would be just 0.454 (from a linear fit to the calculated data in Figure 7 over the range 0 to 4 kcal mol−1). Although we cannot directly measure the fractional association of the wild type fusion protein by our method, the slope of 1.07 for the regression analysis of ΔΔGapp versus ΔΔGmut allows us to infer that the wild type construct must sample the monomeric state substantially.
Figure 7. Predicted deviation of ΔΔGapp from ΔΔ G for varying absolute association of wild type fusion construct.

For wild type species with the fraction monomeric protein indicated at right, we calculate monomer and dimer fractions exactly for a range of −G (using Ka from equation 3) and then calculate ΔΔGapp using the first term of equation 10 (−RT ln [dimerWT/dimermut]), which assumes that the mole fraction of monomeric protein can be approximated as the total protein. In the dilute limit (solid line, slope = 1) the assumption holds, but as the fraction of monomeric protein decreases, ΔΔGapp initially changes more slowly than ΔΔG (dashed lines). The (ΔΔGmut, ΔΔGapp) data points from Figure 5 except mutants at Thr87 have been superimposed along with the linear regression for these points (dotted line, slope = 1.08).
A weak correlation between ΔΔGapp and dimerization phenotypes from SDS-PAGE is improved by a hydrophobicity term
We performed regression analysis between the ΔΔGapp values described here and the previously reported dimerization phenotypes for the same mutations in the glycophorin A TMD under conditions of SDS-PAGE 33. Based on their dimerization on SDS-PAGE, mutants were previously assigned scoreSDS = 0 (as wild type), 1 (significant dimer), 2 (detectable dimer), or 3 (no dimer). Figure 8 shows that ΔΔGapp correlates weakly with scoreSDS (R = 0.53, Panel A), but the agreement can be considerably improved (R = 0.71, Panel B) by including a term for the change of hydrophobicity that accompanies the mutation (fitting ΔΔGapp versus scoreSDS − Δ Hφ, where ΔHφ is the difference in hydrophobicity between the replacing and original residue on the biological hydrophobicity scale 41). Omitting the mutants at position Thr87 improves these fits only slightly (R = 0.57 or 0.75 for panels A or B, respectively).
Figure 8. Regression analysis of apparent free energies from TOXCAT versus the SDS-PAGE phenotypes of Lemmon et al. 33.

The poor fit achieved using the arbitrary scale of the SDS-PAGE phenotypes (Panel A) can be significantly improved by adding a term that accounts for the change in hydrophobicity of each substitution (Panel B). Mutations at Thr87 are presented as black dots.
Discussion
TOXCAT measures changes in association free energy due to mutations
We show here that the TOXCAT assay can be used to measure changes in the apparent free energy of in vivo dimerization of a transmembrane domain that result from point mutations. Wild type and mutant constructs show up to 200-fold differences in reporter gene expression, giving a large dynamic range that compares favorably with the extent of modulation of gene expression observed for the intact ToxR/ctx system 42; 43 upon which the TOXCAT assay is based. Although there is some variation in fusion protein expression levels, the experimental values for ΔΔGapp are very reproducible from one culture to the next, and for most mutants ΔΔGapp from TOXCAT is quite similar to ΔΔGmut from ultracentrifugation. Despite the approximations made in deriving equation 10 and the complexity of the biological system in which the TOXCAT data are acquired, the near-unity slope for the regression analysis in Figure 5 strongly suggests that the TOXCAT method for determining ΔΔGapp agrees closely with ultracentrifugation-derived measures of the effects of mutations on the self-association of the glycophorin A transmembrane domain. The near-zero intercept of the same regression analysis further suggests that the TOXCAT assay is sensitive to even small decreases in the stability of the glycophorin A TMD dimer. The similarities between ΔΔGapp and ΔΔGmut indicate that the TOXCAT approach can be as quantitative as a biophysical approach to measuring effects of mutagenesis on association, and that sedimentation equilibrium measurements in detergents can accurately report on the same phenomena that occur in membranes of living cells. The excellent quantitative agreement with the thermodynamic data from detergent micelles may be somewhat surprising, given that the approach described here does not systematically perturb the mole fraction of fusion protein in the membrane, does not measure the fraction of dimeric ToxR fusion protein at all, and therefore does not determine ΔΔGapp. Rather, we extract ΔΔGapp by assuming that the TOXCAT reporter gene expression is proportional to the fraction of dimer and that the total amount of fusion protein is proportional to a western blot intensity, and then using the ratio of mutant and wild type values for these two measurables to calculate ΔΔGapp (while assuming that the mole fraction of dimers is small).
Because sequence changes could possibly alter the expression levels or the membrane insertion efficiency of the TOXCAT fusion proteins, we tested our library of mutant constructs for proper topology of membrane insertion and measured the amount of TOXCAT protein in each sample assayed for reporter gene expression. Although we found no evidence of altered membrane insertion, we did observe up to three fold changes in the levels of expressed ToxR fusion protein for mutant proteins compared to wild type (see distribution in Figure 4). Cells expressing significantly higher levels of a particular fusion protein on a given day also show higher reporter gene expression for that culture. Higher CAT expression for a given sample lowers the reporter gene term −RT ln [CATmut/CATWT] compared to other replicates, but elevated western blot intensity increases the fusion protein term −RT ln [WBWT/WBmut]2. This compensation is illustrated across our entire data set in Table 1, where we show that combining these two terms to calculate ΔΔGapp for each replicate experiment before averaging gives a much smaller standard error than averaging the triplicates for each term and then combining them to calculate ΔΔGapp. Thus, although our approach does not systematically alter the level of ToxR fusion protein expression in cells, we do observe the expected trends in the observables when fusion protein levels vary stochastically. The compensations between the terms in equation 10 that result in good agreement between independent replicate measurements of ΔΔGapp suggest that our data are reporting on equilibrium association of the ToxR fusion protein in cell membranes.
The role of Thr87 in glycophorin A dimerization depends on the lipidic environment
Despite generally good agreement between the ΔΔGapp values reported here and the ΔΔGmut measurements of Fleming and colleagues, there are statistically significantly differences between these observations for eight single point mutants, including three outliers that map to Thr87 and that are all more disruptive in vivo than in vitro. The TOXCAT data show that all four apolar substitutions at Thr87 are strongly disruptive whereas Thr87Ser is essentially non-disruptive. Together, these data suggest that the polar side chain γ oxygen of Thr87 is critical for dimerization, particularly since isosteric Thr87Val is strongly disruptive, but Thr87Ser (which retains the side chain γ oxygen) permits wild type association. The ultracentrifugation data, on the other hand, show a graded disruptive effect for mutations at position Thr87, with the rank order of disruption correlating with size (Leu > Ile > Val > Ala ~ Ser). Because Val is more disruptive than Ser, a role for the side chain γ oxygen might be inferred, but Ala is as mildly disruptive as Ser, implying that a small residue can suffice at this position. The solution NMR structure of glycophorin A in detergent micelles indicates that the Thr87 side chain donates a hydrogen bond to the carbonyl oxygen of Gly83 of the same helix and packs with the opposite monomer 44. However, solid state NMR experiments on glycophorin A peptides reconstituted into lipid bilayers suggest that the side chain of Thr87 could be involved in an intermonomer hydrogen bond 45. The discrepancies between ΔΔGapp and ΔΔGmut for mutations at Thr87 may therefore reflect differences in the structure of the glycophorin A dimer interface in bilayers compared to detergent micelles. Another possibility is that Thr87 (and variants) could contribute differentially to stability in detergents compared to membranes through effects on the free energy of the monomeric state.
Hydrophobicity changes influence dimerization in SDS but not in membranes
Although ΔΔGapp achieves only weak agreement with the qualitative dimerization phenotypes reported based on SDS-PAGE assays, the agreement can be substantially improved by including a term that modifies the SDS-PAGE score by the difference in hydrophobicity caused by the mutation (see Figure 8). This suggests that loss of hydrophobicity within the transmembrane domain of glycophorin A decreases dimer stability under conditions of SDS-PAGE but does not affect dimer stability as measured by TOXCAT. Russ and Engelman drew a similar conclusion from the observation that tyrosine substitutions at non-interfacial positions of the glycophorin A TMD are non-disruptive in TOXCAT but disruptive on SDS-PAGE 14. The relative hydrophobicity of mutations also affects the self-association of the BNIP3 TMD in SDS-PAGE: hydrophobic substitutions away from the dimer interface have little or no effect on dimerization, while polar substitutions are generally disruptive 46. The results presented here support the proposal 46 that polar substitutions affect the apparent stability of TMD interactions by causing the TMD to unfold in a detergent environment, allowing it to access a conformation that would not be available in the two-stage model for membrane protein folding in a bilayer 47. The influence of hydrophobicity on the helicity of peptides in lipidic environments is well known 48 and has been proposed to result from coupling between partitioning and folding 49. By showing that quantitative agreement between in vivo and SDS-PAGE assays for self-association can be improved using a term for hydrophobicity, the present work suggests that under some conditions hydrophobic partitioning can be coupled to helix-helix association, as predicted by interface-centered membrane protein folding thermodynamic formalism of White and Wimley 49. This is also supported by findings from the BNIP3 system in which decreases in hydrophobicity cause loss of helicity and enhance backbone amide exchange 46. Therefore, although SDS micelles act as a poor membrane mimetic for some transmembrane spans, it may be possible to use appropriate hydrophobicity or partitioning scales 41; 50; 51 to ‘correct’ results from this detergent to better reflect the results obtained in membranes. Minimal improvements are achieved when a similar correction is attempted for the regression analysis of ΔΔGapp and ΔΔGmut, suggesting that the detergent used for the ultracentrifugation analysis (C8E5) is a better membrane mimetic than SDS. We note, however, that the three most N-terminal outliers from the t-test comparison of ΔΔGapp and ΔΔGmut – Leu75Gly, Ile76Ala, and Val80Gly – represent large-to-small mutations that are more disruptive in the ultracentrifuge than in TOXCAT; for these substitutions, hydrophobicity changes would be expected to contribute substantially to the discrepancy between the TOXCAT data and the ultracentrifugation data.
Validity of the assumption that the fusion protein is largely monomeric
The theoretical basis for our approach includes the assumption that the amount of monomeric fusion protein in the cell membrane can be approximated as the amount of total protein ([P] ≈ [Ptotal], equation 4). Although we have no direct measures of the fractional association of the wild type ToxR′(GpATMD)MBP fusion protein, a comparison of theoretical association curves with the range of observed CAT activities plotted against ΔΔGmut (Figure 6) strongly suggests that the fusion protein is expressed at mole fractions low enough to keep it largely monomeric. Substantial deviation from a linear fit with a slope of unity would have been expected for a regression analysis of ΔΔGapp versus ΔΔGmut (Figure 7) if the wild type fusion protein were present at high mole fractions, causing it to be overwhelmingly dimeric. No such trends appear in our data: ΔΔGapp and ΔΔGmut data pairs are statistically indistinguishable for more than 70% of the mutants by Student’s t-test, and the near-unity slope of the regression analysis in Figure 5 shows clearly that the scale of ΔΔGapp is not compressed compared to that of ΔΔGmut. The calculated curves in Figure 7 indicate that the deviation of ΔΔGapp from ΔΔGmut would not drown out the correlation even at just 25% monomer, and so we suggest that TOXCAT should be able to differentiate between dimerization of the wild type glycophorin A transmembrane domain and species that associate even more tightly. If, however, the fusion protein were to be expressed at much higher levels, or if the sequence under study were to have a significantly tighter association constant, it would be possible to enter a regime where sequence changes had little effect on TOXCAT signals, and the apparent free energy scale would be compressed.
The strong homodimerization of the glycophorin A transmembrane domain has made it a positive control for biological assays of transmembrane helix-helix interactions, but measurements of the fractional association of membrane-inserted glycophorin A fusion proteins in vivo have not been obtained until recently. Schneider and colleagues varied the expression level of wild type and mutant glycophorin A GALLEX fusion proteins in cells with an inducible promoter and used the saturation of the GALLEX signal to estimate the concentration at which reporter gene expression is 50% repressed 52. Since the GALLEX and TOXCAT fusions are presumably expressed at different levels, and must have different free energy contributions to dimerization from extramembranous protein-protein interactions and from protein-nucleic acid interactions, the fractional association of fusion proteins for these two systems would not be expected to be the same. However, Schneider and colleagues used wild type and mutant ΔΔGdimer measurements to calculate ΔΔGmut values for five mutants that we have analyzed here using TOXCAT. Table 2 presents the analytical ultracentrifugation, GALLEX, and TOXCAT data for these five point mutants. The rank order of stability of these mutants is roughly conserved in the three assays, but the free energy scale for the GALLEX measurements appears to be more compressed than the TOXCAT or sedimentation equilibrium data.
Table 2.
Changes in association free energy for five glycophorin A mutants from ultracentrifugation and two biological assays
The method presented here measures the effects of point mutations on the free energy of helix-helix interactions within membranes of living cells. ΔΔGiven the many components in the cell membrane and the number of biological processes and biochemical procedures upon which TOXCAT depends, it is remarkable that the TOXCAT approach achieves the present level of agreement with thermodynamic data from biophysical measurements on purified proteins. Although we measure only an apparent change in the free energy of helix-helix interaction, the internal consistency of our findings, the compensation between the terms -RT ln [CATmut/CATWT] and −RT ln [WBWT/WBmut]2, and the agreement with genuine thermodynamic data suggest that the TOXCAT system is actually providing a thermodynamic read-out of transmembrane domain dimerization. These results demonstrate that complex biological processes (transcription of a reporter gene) can be regulated by the stability of helix-helix association in membranes and that the thermodynamic effects of single point mutations as measured in detergents can accurately predict the effects of these mutations in complex biological systems. We expect that the combination of thermodynamic measurements on purified proteins in detergents and in bilayers as well as the characterization of interactions using TOXCAT or other biological assays will be critical to the continued development of insights into the specificity and stability of transmembrane domain interactions.
Experimental Methods
Constructs and site-directed mutagenesis
The pccKAN vector expressing a ToxR′(GpATMD)MBP chimera was described previously by Russ and Engelman 14. Single-point mutations within the wild type glycophorin A TMD were generated using the QuikChange kit (Stratagene, La Jolla, CA), and mutations were confirmed by automated dideoxynucleotide sequencing.
TOXCAT cultures
All media contained 50 μg ml−1 carbenicillin. Plasmids containing wild type and mutant pccKToxR′(GpATMD)MBP chimerae were transformed into Escherichia coli NT326 cells and plated on Luria Bertani (LB) plates. Colonies were grown in LB medium until A420 ~ 0.2, and then stored as glycerol stocks at −80 °C. LB cultures were inoculated from glycerol stocks and grown at 37 °C overnight. 40 μl of overnight culture was diluted into fresh LB culture tubes, grown until A420 ~ 1.0, and 10.0 A420 units of cells were harvested by centrifugation at 13,000 × g for 5 min. (Note that when studying the BNIP3 TMD, we harvested 4.0 A420 units of cells 38). The cell pellets were washed with 0.4 ml of sonication buffer (25 mM Tris-HCl, 2 mM EDTA, pH 8.0) and resuspended in 2 ml of sonication buffer for lysis by probe sonication. After removing an aliquot of the whole cell lysate for Western blot analysis, the remaining lysate was centrifuged at 13,000 × g for 15 min, and the supernatant (cleared lysate) was stored at −20 °C for spectrophotometric CAT assay.
Spectrophotometric CAT assay
The method described by Shaw 37 was used to measure chloramphenicol acetyltransferase (CAT) activity in cleared cell lysates. The rate of transfer of an acetyl group from acetyl-CoA to chloramphenicol is detected by the rate of color change (412 nm) associated with the reaction of the resulting free coenzyme A with 5,5′-dithiobis-(2-nitrobenzoic acid) (DTNB). 12 μl of cleared lysate was mixed with 300 μl reaction buffer (0.1 mM acetyl-CoA, 0.4 mg/ml DTNB, 0.1 M Tris-HCl, pH 7.8) and the absorbance at 412 nm was measured on a Cary 50 spectrophotometer at 3 s intervals for 2 min to obtain the background rate of acetyl-CoA hydrolysis. 12 μl of 2.5 mM chloramphenicol was then added to the reaction, mixed thoroughly, and the absorbance at 412 nm was again measured for 1 min; for samples that showed very low levels of CAT activity, the measuring time was extended to 2 min. Each lysate was assayed in triplicate, and the average change in absorbance at 412 nm was converted into CAT enzyme activity (ε=13,600).
Western blots
Aliquots of whole cell lysate were brought to 0.1 mg ml−1 hen egg white lysozyme and incubated on ice for 15 min. 0.01 U of DNase I was added to the reaction and incubated on ice for a further 20 min. Samples were mixed with equal volumes of 2x SDS-PAGE sample buffer (with 0.1 M dithiothreitol), heated to 95 °C for 10 min, separated on pre-cast 15% polyacrylamide gels (Bio-Rad), blotted onto nitrocellulose membranes, and blocked in skim milk. ToxR′(GpATMD)MBP chimera were detected with biotinylated anti-MBP primary antibody and visualized with streptavidin-horseradish peroxidase conjugate and ECL reagent (Amersham Biosciences). An Alpha Innotech digital camera system (equipped with a cooled CCD) was used to image the membranes and measure the intensities of the bands.
Maltose complementation assay
E. coli NT326 cultures carrying the ToxR′(GpATMD)MBP constructs were inoculated from glycerol stocks into LB and grown at 37 °C overnight. 10 μl of overnight culture was added to fresh culture tubes containing M9 minimal medium (0.4% glucose as sole carbon source), grown at 37 °C for 8 hours, streaked on M9 minimal media plates containing 0.4% maltose as sole carbon source, and incubated at 37 °C for 3 days. Plates were imaged using an Alpha Innotech digital camera system.
Apparent free energy difference calculations
The apparent change in free energy of association for a mutant transmembrane domain relative to the wild type transmembrane domain is given by ΔΔGapp = −RT ln Kapp where
CATmut and CATWT are the chloramphenicol acetyl transferase activities of mutant and wild type lysates, and WBWT and WBmut are the Western blot band intensities (in arbitrary units) for full-length wild type and mutant ToxR′(GpATMD)MBP chimerae. Reported values for ΔΔGapp are the mean (± standard deviation) of three independent experiments. Values for ΔΔGapp are reported to the second decimal place in Table 1 to clarify the calculation of standard deviations; the average precision for these measured values is about 0.3 kcal mol−1 (based on triplicate independent cultures), and precisions for individual mutants range from 0.1 to 0.5 kcal mol−1 (see column SD ΔΔG in Table 1).
Statistical analyses
Values for ΔΔGapp (from TOXCAT; Table 1) and ΔΔGmut (from ultracentrifugation 2; 8; 10) were compared using a Student’s t-test (two degrees of freedom) to determine the significance of differences in the measurements. For the TOXCAT data, the standard deviation used was the higher of SD ΔΔG from Table 1 or 0.2 kcal mol−1. The standard deviations used for the ultracentrifugation data were from the cited literature 2; 8; 10, and were typically 0.1 or 0.2 kcal mol−1.
Acknowledgments
We thank J.S. Olson for comments and criticism on the experiments, the analysis, and the manuscript. This work was supported by Robert A. Welch Foundation grant C-1513 (to K.R.M.), NIH grant R01 GM067850 (to K.R.M.), and by NSF grant MCB0423807 (to K.G.F.).
Footnotes
Publisher's Disclaimer: This is a PDF file of an unedited manuscript that has been accepted for publication. As a service to our customers we are providing this early version of the manuscript. The manuscript will undergo copyediting, typesetting, and review of the resulting proof before it is published in its final citable form. Please note that during the production process errors may be discovered which could affect the content, and all legal disclaimers that apply to the journal pertain.
References
- 1.MacKenzie KR. Folding and Stability of alpha-Helical Integral Membrane Proteins. Chem Rev. 2006;106:1931–77. doi: 10.1021/cr0404388. [DOI] [PubMed] [Google Scholar]
- 2.Fleming KG, Ackerman AL, Engelman DM. The effect of point mutations on the free energy of transmembrane alpha-helix dimerization. J Mol Biol. 1997;272:266–75. doi: 10.1006/jmbi.1997.1236. [DOI] [PubMed] [Google Scholar]
- 3.Fleming KG. Probing stability of helical transmembrane proteins. Methods Enzymol. 2000;323:63–77. doi: 10.1016/s0076-6879(00)23361-2. [DOI] [PubMed] [Google Scholar]
- 4.Fleming KG. Standardizing the free energy change of transmembrane helix-helix interactions. J Mol Biol. 2002;323:563–71. doi: 10.1016/s0022-2836(02)00920-8. [DOI] [PubMed] [Google Scholar]
- 5.Cristian L, Lear JD, DeGrado WF. Determination of membrane protein stability via thermodynamic coupling of folding to thiol-disulfide interchange. Protein Sci. 2003;12:1732–40. doi: 10.1110/ps.0378603. [DOI] [PMC free article] [PubMed] [Google Scholar]
- 6.Cristian L, Lear JD, DeGrado WF. Use of thiol-disulfide equilibria to measure the energetics of assembly of transmembrane helices in phospholipid bilayers. Proc Natl Acad Sci U S A. 2003;100:14772–7. doi: 10.1073/pnas.2536751100. [DOI] [PMC free article] [PubMed] [Google Scholar]
- 7.You M, Li E, Wimley WC, Hristova K. Forster resonance energy transfer in liposomes: measurements of transmembrane helix dimerization in the native bilayer environment. Anal Biochem. 2005;340:154–64. doi: 10.1016/j.ab.2005.01.035. [DOI] [PMC free article] [PubMed] [Google Scholar]
- 8.Fleming KG, Engelman DM. Specificity in transmembrane helix-helix interactions can define a hierarchy of stability for sequence variants. Proc Natl Acad Sci U S A. 2001;98:14340–4. doi: 10.1073/pnas.251367498. [DOI] [PMC free article] [PubMed] [Google Scholar]
- 9.Doura AK, Fleming KG. Complex interactions at the helix-helix interface stabilize the glycophorin A transmembrane dimer. J Mol Biol. 2004;343:1487–97. doi: 10.1016/j.jmb.2004.09.011. [DOI] [PubMed] [Google Scholar]
- 10.Doura AK, Kobus FJ, Dubrovsky L, Hibbard E, Fleming KG. Sequence context modulates the stability of a GxxxG-mediated transmembrane helix-helix dimer. J Mol Biol. 2004;341:991–8. doi: 10.1016/j.jmb.2004.06.042. [DOI] [PubMed] [Google Scholar]
- 11.Stouffer AL, Nanda V, Lear JD, DeGrado WF. Sequence determinants of a transmembrane proton channel: an inverse relationship between stability and function. J Mol Biol. 2005;347:169–79. doi: 10.1016/j.jmb.2005.01.023. [DOI] [PubMed] [Google Scholar]
- 12.Langosch D, Brosig B, Kolmar H, Fritz HJ. Dimerisation of the glycophorin A transmembrane segment in membranes probed with the ToxR transcription activator. J Mol Biol. 1996;263:525–30. doi: 10.1006/jmbi.1996.0595. [DOI] [PubMed] [Google Scholar]
- 13.Brosig B, Langosch D. The dimerization motif of the glycophorin A transmembrane segment in membranes: importance of glycine residues. Protein Sci. 1998;7:1052–6. doi: 10.1002/pro.5560070423. [DOI] [PMC free article] [PubMed] [Google Scholar]
- 14.Russ WP, Engelman DM. TOXCAT: a measure of transmembrane helix association in a biological membrane. Proc Natl Acad Sci U S A. 1999;96:863–8. doi: 10.1073/pnas.96.3.863. [DOI] [PMC free article] [PubMed] [Google Scholar]
- 15.Leeds JA, Boyd D, Huber DR, Sonoda GK, Luu HT, Engelman DM, Beckwith J. Genetic selection for and molecular dynamic modeling of a protein transmembrane domain multimerization motif from a random Escherichia coli genomic library. J Mol Biol. 2001;313:181–95. doi: 10.1006/jmbi.2001.5007. [DOI] [PubMed] [Google Scholar]
- 16.Gurezka R, Langosch D. In vitro selection of membrane-spanning leucine zipper protein-protein interaction motifs using POSSYCCAT. J Biol Chem. 2001;276:45580–7. doi: 10.1074/jbc.M105362200. [DOI] [PubMed] [Google Scholar]
- 17.Schneider D, Engelman DM. GALLEX, a measurement of heterologous association of transmembrane helices in a biological membrane. J Biol Chem. 2003;278:3105–11. doi: 10.1074/jbc.M206287200. [DOI] [PubMed] [Google Scholar]
- 18.Laage R, Langosch D. Dimerization of the synaptic vesicle protein synaptobrevin (vesicle-associated membrane protein) II depends on specific residues within the transmembrane segment. Eur J Biochem. 1997;249:540–6. doi: 10.1111/j.1432-1033.1997.00540.x. [DOI] [PubMed] [Google Scholar]
- 19.Gurezka R, Laage R, Brosig B, Langosch D. A heptad motif of leucine residues found in membrane proteins can drive self-assembly of artificial transmembrane segments. J Biol Chem. 1999;274:9265–70. doi: 10.1074/jbc.274.14.9265. [DOI] [PubMed] [Google Scholar]
- 20.Laage R, Rohde J, Brosig B, Langosch D. A conserved membrane-spanning amino acid motif drives homomeric and supports heteromeric assembly of presynaptic SNARE proteins. J Biol Chem. 2000;275:17481–7. doi: 10.1074/jbc.M910092199. [DOI] [PubMed] [Google Scholar]
- 21.Mendrola JM, Berger MB, King MC, Lemmon MA. The single transmembrane domains of ErbB receptors self-associate in cell membranes. J Biol Chem. 2002;277:4704–12. doi: 10.1074/jbc.M108681200. [DOI] [PubMed] [Google Scholar]
- 22.Bowen ME, Engelman DM, Brunger AT. Mutational analysis of synaptobrevin transmembrane domain oligomerization. Biochemistry. 2002;41:15861–6. doi: 10.1021/bi0269411. [DOI] [PubMed] [Google Scholar]
- 23.McClain MS, Iwamoto H, Cao P, Vinion-Dubiel AD, Li Y, Szabo G, Shao Z, Cover TL. Essential role of a GXXXG motif for membrane channel formation by Helicobacter pylori vacuolating toxin. J Biol Chem. 2003;278:12101–8. doi: 10.1074/jbc.M212595200. [DOI] [PubMed] [Google Scholar]
- 24.Roy R, Laage R, Langosch D. Synaptobrevin transmembrane domain dimerization-revisited. Biochemistry. 2004;43:4964–70. doi: 10.1021/bi0362875. [DOI] [PubMed] [Google Scholar]
- 25.Ruan W, Lindner E, Langosch D. The interface of a membrane-spanning leucine zipper mapped by asparagine-scanning mutagenesis. Protein Sci. 2004;13:555–9. doi: 10.1110/ps.03357404. [DOI] [PMC free article] [PubMed] [Google Scholar]
- 26.Melnyk RA, Kim S, Curran AR, Engelman DM, Bowie JU, Deber CM. The affinity of GXXXG motifs in transmembrane helix-helix interactions is modulated by long-range communication. J Biol Chem. 2004;279:16591–7. doi: 10.1074/jbc.M313936200. [DOI] [PubMed] [Google Scholar]
- 27.Schneider D, Engelman DM. Motifs of two small residues can assist but are not sufficient to mediate transmembrane helix interactions. J Mol Biol. 2004;343:799–804. doi: 10.1016/j.jmb.2004.08.083. [DOI] [PubMed] [Google Scholar]
- 28.Schneider D, Engelman DM. Involvement of transmembrane domain interactions in signal transduction by alpha/beta integrins. J Biol Chem. 2004;279:9840–6. doi: 10.1074/jbc.M312749200. [DOI] [PubMed] [Google Scholar]
- 29.Li R, Gorelik R, Nanda V, Law PB, Lear JD, DeGrado WF, Bennett JS. Dimerization of the transmembrane domain of Integrin alphaIIb subunit in cell membranes. J Biol Chem. 2004;279:26666–73. doi: 10.1074/jbc.M314168200. [DOI] [PubMed] [Google Scholar]
- 30.Chin CN, Sachs JN, Engelman DM. Transmembrane homodimerization of receptor-like protein tyrosine phosphatases. FEBS Lett. 2005;579:3855–8. doi: 10.1016/j.febslet.2005.05.071. [DOI] [PubMed] [Google Scholar]
- 31.Zhou FX, Merianos HJ, Brunger AT, Engelman DM. Polar residues drive association of polyleucine transmembrane helices. Proc Natl Acad Sci U S A. 2001;98:2250–5. doi: 10.1073/pnas.041593698. [DOI] [PMC free article] [PubMed] [Google Scholar]
- 32.Zhou FX, Cocco MJ, Russ WP, Brunger AT, Engelman DM. Interhelical hydrogen bonding drives strong interactions in membrane proteins. Nat Struct Biol. 2000;7:154–60. doi: 10.1038/72430. [DOI] [PubMed] [Google Scholar]
- 33.Lemmon MA, Flanagan JM, Hunt JF, Adair BD, Bormann BJ, Dempsey CE, Engelman DM. Glycophorin A dimerization is driven by specific interactions between transmembrane alpha-helices. J Biol Chem. 1992;267:7683–9. [PubMed] [Google Scholar]
- 34.Lemmon MA, Treutlein HR, Adams PD, Brunger AT, Engelman DM. A dimerization motif for transmembrane alpha-helices. Nat Struct Biol. 1994;1:157–63. doi: 10.1038/nsb0394-157. [DOI] [PubMed] [Google Scholar]
- 35.Fleming KG, Ren CC, Doura AK, Eisley ME, Kobus FJ, Stanley AM. Thermodynamics of glycophorin A transmembrane helix dimerization in C14 betaine micelles. Biophys Chem. 2004;108:43–9. doi: 10.1016/j.bpc.2003.10.008. [DOI] [PubMed] [Google Scholar]
- 36.Lemmon MA, Flanagan JM, Treutlein HR, Zhang J, Engelman DM. Sequence specificity in the dimerization of transmembrane alpha-helices. Biochemistry. 1992;31:12719–25. doi: 10.1021/bi00166a002. [DOI] [PubMed] [Google Scholar]
- 37.Shaw WV. Chloramphenicol acetyltransferase from chloramphenicol-resistant bacteria. Methods Enzymol. 1975;43:737–55. doi: 10.1016/0076-6879(75)43141-x. [DOI] [PubMed] [Google Scholar]
- 38.Sulistijo ES, Jaszewski TM, MacKenzie KR. Sequence-specific dimerization of the transmembrane domain of the “BH3-only” protein BNIP3 in membranes and detergent. J Biol Chem. 2003;278:51950–6. doi: 10.1074/jbc.M308429200. [DOI] [PubMed] [Google Scholar]
- 39.Gorman CM, Moffat LF, Howard BH. Recombinant genomes which express chloramphenicol acetyltransferase in mammalian cells. Mol Cell Biol. 1982;2:1044–51. doi: 10.1128/mcb.2.9.1044. [DOI] [PMC free article] [PubMed] [Google Scholar]
- 40.Young SL, Barbera L, Kaynard AH, Haugland RP, Kang HC, Brinkley M, Melner MH. A nonradioactive assay for transfected chloramphenicol acetyltransferase activity using fluorescent substrates. Anal Biochem. 1991;197:401–7. doi: 10.1016/0003-2697(91)90411-l. [DOI] [PubMed] [Google Scholar]
- 41.Hessa T, Kim H, Bihlmaier K, Lundin C, Boekel J, Andersson H, Nilsson I, White SH, von Heijne G. Recognition of transmembrane helices by the endoplasmic reticulum translocon. Nature. 2005;433:377–81. doi: 10.1038/nature03216. [DOI] [PubMed] [Google Scholar]
- 42.Miller VL, Mekalanos JJ. Synthesis of cholera toxin is positively regulated at the transcriptional level by toxR. Proc Natl Acad Sci U S A. 1984;81:3471–5. doi: 10.1073/pnas.81.11.3471. [DOI] [PMC free article] [PubMed] [Google Scholar]
- 43.Miller VL, Taylor RK, Mekalanos JJ. Cholera toxin transcriptional activator toxR is a transmembrane DNA binding protein. Cell. 1987;48:271–9. doi: 10.1016/0092-8674(87)90430-2. [DOI] [PubMed] [Google Scholar]
- 44.MacKenzie KR, Prestegard JH, Engelman DM. A transmembrane helix dimer: structure and implications. Science. 1997;276:131–3. doi: 10.1126/science.276.5309.131. [DOI] [PubMed] [Google Scholar]
- 45.Smith SO, Eilers M, Song D, Crocker E, Ying W, Groesbeek M, Metz G, Ziliox M, Aimoto S. Implications of threonine hydrogen bonding in the glycophorin A transmembrane helix dimer. Biophys J. 2002;82:2476–86. doi: 10.1016/S0006-3495(02)75590-2. [DOI] [PMC free article] [PubMed] [Google Scholar]
- 46.Sulistijo ES, Mackenzie KR. Sequence Dependence of BNIP3 Transmembrane Domain Dimerization Implicates Side-chain Hydrogen Bonding and a Tandem GxxxG Motif in Specific Helix-Helix Interactions. J Mol Biol. 2006;364:974–90. doi: 10.1016/j.jmb.2006.09.065. [DOI] [PubMed] [Google Scholar]
- 47.Popot JL, Engelman DM. Membrane protein folding and oligomerization: the two-stage model. Biochemistry. 1990;29:4031–7. doi: 10.1021/bi00469a001. [DOI] [PubMed] [Google Scholar]
- 48.Li SC, Deber CM. A measure of helical propensity for amino acids in membrane environments. Nat Struct Biol. 1994;1:558. doi: 10.1038/nsb0894-558. [DOI] [PubMed] [Google Scholar]
- 49.White SH, Wimley WC. Hydrophobic interactions of peptides with membrane interfaces. Biochim Biophys Acta. 1998;1376:339–52. doi: 10.1016/s0304-4157(98)00021-5. [DOI] [PubMed] [Google Scholar]
- 50.Wimley WC, White SH. Experimentally determined hydrophobicity scale for proteins at membrane interfaces. Nat Struct Biol. 1996;3:842–8. doi: 10.1038/nsb1096-842. [DOI] [PubMed] [Google Scholar]
- 51.Wimley WC, Creamer TP, White SH. Solvation energies of amino acid side chains and backbone in a family of host-guest pentapeptides. Biochemistry. 1996;35:5109–24. doi: 10.1021/bi9600153. [DOI] [PubMed] [Google Scholar]
- 52.Finger C, Volkmer T, Prodohl A, Otzen DE, Engelman DM, Schneider D. The stability of transmembrane helix interactions measured in a biological membrane. J Mol Biol. 2006;358:1221–8. doi: 10.1016/j.jmb.2006.02.065. [DOI] [PubMed] [Google Scholar]