

Abstract
The development of a brain template for diffusion tensor imaging (DTI) is crucial for comparisons of neuronal structural integrity and brain connectivity across populations, as well as for the development of a white matter atlas. Previous efforts to produce a DTI brain template have been compromised by factors related to image quality, the effectiveness of the image registration approach, the appropriateness of subject inclusion criteria, the completeness and accuracy of the information summarized in the final template. The purpose of this work was to develop a DTI human brain template using techniques that address the shortcomings of previous efforts. Therefore, data containing minimal artifacts were first obtained on 67 healthy human subjects selected from an age-group with relatively similar diffusion characteristics (20–40 years of age), using an appropriate DTI acquisition protocol. Non-linear image registration based on mean diffusion-weighted and fractional anisotropy images was employed. DTI brain templates containing median and mean tensors were produced in ICBM-152 space and made publicly available. The resulting set of DTI templates is characterized by higher image sharpness, provides the ability to distinguish smaller white matter fiber structures, contains fewer image artifacts, than previously developed templates, and to our knowledge, is one of only two templates produced based on a relatively large number of subjects. Furthermore, median tensors were shown to better preserve the diffusion characteristics at the group level than mean tensors. Finally, white matter fiber tractography was applied on the template and several fiber-bundles were traced.
Keywords: Template, DTI, brain, human, normalization, registration, Turboprop, PROPELLER
Introduction
The development of a brain template for diffusion tensor imaging (DTI) (Basser and Pierpaoli, 1996) is crucial for comparisons of neuronal structural integrity (Le Bihan et al., 2001) and brain connectivity (Basser et al., 2000) across populations, as well as for the development of a white matter atlas (Mori et al., 2008). The potential of DTI for detecting differences in brain tissue micro-architecture between healthy subjects and patients has been recognized in several studies on various brain-related diseases, such as schizophrenia (Lim et al., 1999), bipolar disorder (Bruno et al., 2008), alcoholism (Pfefferbaum and Sullivan, 2005), stroke (van Gelderen et al., 1994), multiple sclerosis (Bammer et al., 2000), Alzheimer’s (Arfanakis et al., 2007), dyslexia (Klingberg et al., 2000), amyotrophic lateral sclerosis (Ellis et al., 1999), epilepsy (Arfanakis et al., 2002b), traumatic brain injury (Arfanakis et al., 2002a), and others. These studies have adopted one of two approaches for investigating intergroup differences: regions of interest (ROI) and voxel-based analyses. The first approach involves manual or semi-automated selection of ROIs, followed by comparison of the results from the selected ROIs between groups (Ellis et al., 1999; Arfanakis et al., 2002b). The main disadvantage of ROI analysis in DTI is that quantities such as the primary diffusion direction cannot be compared, since brain positioning varies between subjects. The second approach involves spatial normalization of the data in each group to a template and subsequent comparison between groups, either within selected ROIs, or on a voxel-by-voxel basis (Bruno et al., 2008; Klingberg et al., 2000). Tensor reorientation techniques that take into account the transformation applied during spatial normalization of DTI datasets have been developed (Alexander et al., 2001; Xu et al., 2003), and as a result, comparisons between quantities dependent on the tensor’s orientation are feasible (Jones et al., 2002; Schwartzman et al., 2005). However, spatial normalization of the DTI data is typically achieved by first normalizing coregistered T1 or T2-weighted images from each subject to a template, such as the Montreal Neurological Institute (MNI) template, and then applying the same transformations to the corresponding DTI data; or by selecting one subject’s DTI data as the reference, and registering the DTI data from all other subjects to the reference. When no tensor information is used for the normalization, it is not ensured that diffusion characteristics match between subjects. In addition, transformations that are estimated based on undistorted images (e.g. T1-weighted) are not appropriate for use with distorted conventional spin-echo echo-planar DTI (SE-EPI-DTI) maps, even when using parallel imaging, since the two datasets do not match spatially. Also, the artifacts present in SE-EPI-DTI data vary between subjects, as well as for the same subject in different head positions (Gui et al., 2008). These artifacts have a negative effect on the normalization process in brain regions such as the brainstem, the temporal and frontal lobes (Peng et al., 2008). Finally, when using a single subject’s DTI data as reference, one needs to take into account the fact that a single subject’s brain may not be representative of other subjects of the same cohort, and that a single subject’s data contain more noise than a template produced by averaging multiple datasets. Noise reduces the accuracy of the normalization and the validity of group averaging, and limits the clinical potential of DTI. Therefore, careful development of a representative DTI human brain template is crucial for accurate comparisons of neuronal structural integrity and brain connectivity across populations.
Development of a DTI template that is representative of the healthy human brain is also important for the generation of a detailed white matter atlas. The existing brain atlases are either based on a small number of brains analyzed postmortem, and are not in digital format, or contain only limited information on white matter (Toga et al., 2006). Since the introduction of DTI, several white matter structures have been mapped in individual subjects (Wakana et al., 2004). DTI data from a large number of healthy human subjects can be combined and used to segment various white matter structures, in order to produce a digital atlas of human brain white matter (Mori et al., 2008).
A number of studies have produced average human brain DTI data using different approaches. Jones et al. used affine transformations to register fractional anisotropy (FA) maps from ten human subjects to the FA map of another subject, and then applied the transformation parameters to reorient the diffusion tensors (Jones et al., 2002). All FA maps were produced with EPI-based DTI. Muller et al. used affine spatial normalization to coregister the image volumes with no diffusion weighting (b=0sec/mm2) from thirteen subjects, in MNI space (Muller et al., 2007). The transformation parameters were then applied on the diffusion tensors, and the tensors were reoriented. All datasets were acquired with EPI-based DTI. Goodlett et al. normalized five EPI-based DTI datasets in two steps (Goodlett et al., 2006). In the first step, the b=0sec/mm2 images were registered to a T2-weighted image-template using affine alignment, and the transformation parameters were applied to the diffusion tensors. In the second step, deformable registration improved correspondence between the 5 DTI datasets and the template. Six diffusion directions were used for data acquisition. Zhang et al. normalized nine EPI-based DTI datasets in two steps (Zhang et al., 2006). In the first step, the diffusion anisotropy maps from eight subjects were matched to the maps of the ninth subject (assumed to be the template) using affine transformation. In the second step, the aligned images were registered to the template using deformable registration. Mori et al. normalized 81 EPI-based DTI datasets acquired on two 1.5Tesla (T) MRI scanners with parallel imaging and acceleration of 2, from a group of subjects with ages ranging from 18 to 59 years (Mori et al., 2008). The mean diffusion weighted (DW) images were first coregistered using affine alignment, and the transformation parameters were then applied to the diffusion tensors. Park et al. used Line-scan DTI, which provides distortion free DTI data, and non-linear registration to normalize DTI data from 16 subjects (Park et al., 2003). Due to the low signal to noise ratio (SNR) per unit time achieved with Line-scan DTI, the slice thickness was increased to 4mm, and only 6 diffusion directions were used. The main characteristics of these and other efforts to develop a human brain DTI template are summarized in Table 1. However, in each study mentioned above, a combination of several sources of error prohibited the development of an accurate DTI template: a) EPI-related image artifacts, b) suboptimal diffusion encoding schemes or imaging protocol, c) the use of affine instead of nonlinear registration, d) the use of a single scalar quantity for normalization, which often did not include any DTI information, e) limited number of subjects, f) averaging data across age-groups with different diffusion properties (Table 1).
Table 1.
A list of critical methods and parameters used in this and other studies on the development of a human brain DTI template. The total number of subjects, number of subjects per gender, age-range, magnetic field strength (B0), pulse sequence, echo-time (TE), number of diffusion directions, voxel size, gap between slices, normalization approach, and information used for the normalization are listed.
| Study | # of Subj. | Age-range (years) | B0 (T) | Pulse Sequence | TE (ms) | # of diff. dirs | Voxel size (mm3) | Gap | Normalization approach |
|---|---|---|---|---|---|---|---|---|---|
| This study | 67 M:27 F:40 |
20–40 | 3 | Turboprop | 94 | 12 | 10.5 | No | Non-linear, (FA and mean DW) |
| Jones et al. 2002 | 11 M:11 F:0 |
25–39 | 1.5 | EPI | 107 | 64 | 15.6 | No | Affine, (FA) |
| Mori et al. 2008 | 81 M:42 F:39 |
18–59 | 1.5 | EPI, Parallel imaging | N/A | 30 | 15.6 | No | Affine, (mean DW) |
| Muller et al. 2007 | 13 M:10 F:3 |
53.1 ± 15.3 | 1.5 | EPI | 93 | 12 | 4.95 | No | Affine, (b=0sec/mm2) |
| Goodlett et al. 2006 | 5 | 1 | 3 | EPI | 73 | 6 | 8 | No | Non-linear, (FA) |
| Zhang et al. 2006 | 9 | 19–30 | 3 | EPI | 99 | 12 | 8.88 | Yes | Non-linear, (Diffusion Anisotropy) |
| Park et al. 2003 | 16 | 30–51 | 1.5 | Line-Scan | 64 | 6 | 8.77 | Yes | Non-linear, (Multi-channel) |
| Chiang et al. 2008 | 34 M:20 F:14 |
73.6±9 | 1.5 | EPI | 106 | 44 | 7.92 | Yes | Non-linear, (Tensors) |
| Xu et al. 2003 | 9 | N/A | 1.5 | EPI, segmented | N/A | 6 | 11.4 | No | Non-linear, (T1-weighted) |
| Ardekani et al. 2006 | 10 M:8 F:2 |
31±3 | 3 | EPI, Parallel imaging | 91 | 6 | 3.4 | No | Non-linear, (Trace and FA) |
| Van Hecke et al. 2008 | 20 M:8 F:12 |
25±3 | 1.5 | EPI | 100 | 60 | 8 | N/A | Non-linear, (Tensors) |
The purpose of this work was to develop a DTI human brain template using an approach that addresses the shortcomings of previous studies. Therefore, Turboprop-DTI data, which contain minimal distortions and other artifacts (e.g. artifacts caused by magnetic susceptibility variations and eddy-currents) (Pipe and Zwart, 2006; Arfanakis et al., 2005; Gui et al., 2008), were first obtained on a large number of healthy human subjects selected from an age-group with relatively similar diffusion characteristics. Non-linear image registration techniques were employed, and information from multiple quantities derived from the diffusion tensor was taken into account during registration. The use of different combinations of quantities in the registration process was quantitatively evaluated. Furthermore, the accuracy of the final registration was estimated based on the ability to match selected brain landmarks between subjects. Tensor reorientation was performed in order to produce a template that contains complete tensors. The use of median vs. mean tensors to summarize the group’s diffusion properties was evaluated. The DTI brain template was produced in the spatial coordinates of the ICBM-152 brain template (International Consortium for Brain Mapping) that is often used in the neuroimaging community, and was made publicly available. The resulting template was compared to those produced in previous studies, and primarily to that of Mori et al., 2008, which is currently the only other publicly available DTI template also based on a large number of subjects. Finally, white matter fiber tractography was applied on the resulting template and several fiber-bundles were traced.
Methods
MRI Data Acquisition
Sixty-seven healthy human subjects participated in this study (40 female, 27.2±5.4 years of age, 20–39 years of age) (27 male, 31.7±5.6 years of age, 22–40 years of age). Although the female subjects were on average younger than the male subjects (p=0.0016, based on a two-tailed t-test), for the selected age-range, the diffusion characteristics of the brain are shown to be very similar between subjects (Sullivan and Pfefferbaum, 2006; Hasan et al., 2008). All participants provided written informed consent according to procedures approved by the institutional committee for the protection of human subjects. Scans were performed on a 3T General Electric MRI scanner (GE, Waukesha, WI). Bulk motion was minimized by restricting the subjects’ head with cushions. Each subject was scanned with Turboprop-DTI using: TR=5800msec, TE=94ms, 8 spin-echoes per TR (echo-train length ETL=8), 5 k-space lines per spin-echo (turbofactor=5), 128 samples per line, 16 blades per image, field-of-view 24cm × 24cm, 45 contiguous oblique axial slices, 3mm slice thickness, and 256 × 256 final image matrix. DW images with b=900sec/mm2 were acquired in each slice for a set of 12 diffusion directions uniformly distributed in three-dimensional (3D) space (minimum energy scheme) (Hasan et al., 2001). Two b=0sec/mm2 images were also acquired for each slice. The duration of the Turboprop-DTI scan was 21 minutes and 57 seconds.
High-resolution T1-weighted data were also obtained for each subject, using the 3D magnetization-prepared rapid acquisition gradient echo (MP-RAGE) sequence with the following parameters: TE=3.2ms, TR=8ms, preparation time=725ms, flip angle 6°, field of view 24cm × 24cm, 124 slices, 1.5mm slice thickness, 192×256 k-space matrix reconstructed to 256×256. The scan time for this sequence was 9 minutes and 58 seconds.
Data Analysis
DTI Data Pre-Processing
In each subject, the DW image-volumes for the different diffusion gradient directions were averaged, and a mean DW volume was produced. The mean DW volume was then registered to the b=0sec/mm2 image-volume using 3D rigid-body mutual information registration (FSL, Oxford, UK) (Jenkinson and Smith, 2001). Each of the DW image-volumes was then registered to the new mean DW volume, using 3D rigid-body mutual information registration, to eliminate any mismatch due to motion between the acquisition of the DW data and the b=0sec/mm2 images. Head-motion was in general minimal in the datasets included in this work. Following motion correction, the DW volumes were averaged again to obtain the final mean DW volume for each subject.
The coregistered b=0sec/mm2 and DW volumes were used to calculate the diffusion tensor in each voxel (FSL, Oxford, UK). Fractional anisotropy (FA) and trace volumes were also produced for each subject. The brain was extracted in all volumes using BET (FSL, Oxford, UK) (Smith, 2002). However, this process did not remove many noisy signals around the brain that result in abnormally high FA values. Therefore, an additional mask was produced by filtering out: a) voxels with FA>0.75 values located next to voxels with FA=0 (set to 0 by BET), and b) clusters with fewer than 50 voxels that were not connected to the brain. The final mask was applied on the mean DW, FA and trace volumes.
The b=0sec/mm2 volume of each subject was smoothed with a Gaussian kernel with full width at half maximum (FWHM) of 8mm, and was registered to the ICBM-152 template using rigid-body registration (FSL, Oxford, UK). Subsequently, all b=0sec/mm2 volumes were normalized to the ICBM-152 template using non-linear registration (SPM5, Wellcome Department of Imaging and Neuroscience, London, UK), and the total deformation was estimated for each subject. The subject with the lowest total deformation was identified. The original b=0sec/mm2 volume from that subject was smoothed with a Gaussian kernel with FWHM=8mm, and was normalized to the ICBM-152 template using non-linear registration (SPM5). The same spatial transformation was applied to the mean DW, FA, and trace volumes from the same subject. Trilinear interpolation was used in the normalizations. The final dimensions of the b=0sec/mm2, mean DW, FA, and trace volumes were 181 × 217 × 181 voxels, and the final voxel-size was 1mm × 1mm × 1mm. The normalized volumes from this subject functioned as a temporary template.
Evaluation of Non-Linear DTI Normalization Based on Multiple Quantities
The mean DW volumes from 11 randomly selected subjects and the temporary template were smoothed with Gaussian kernels with different FWHMs (between 2mm and 9mm) (Fig. 1). For each smoothing size, the mean DW volumes from the 11 subjects were normalized to the mean DW volume of the temporary template, using non-linear registration based on 3D discrete cosine transform (DCT) basis functions (7×9×7=441 coefficients) (Rosario et al., 2008) and 32 iterations (SPM5). The resulting spatial transformations were applied on the b=0sec/mm2 and DW volumes from the 11 subjects (Fig. 1). Trilinear interpolation was used in the normalization process. The final dimensions of the normalized b=0sec/mm2 and DW volumes were 181 × 217 × 181 voxels, and the final voxel-size was 1mm × 1mm × 1mm. Diffusion tensors were calculated in each voxel of the normalized data, and FA and trace maps were produced for the 11 subjects (FSL). The diffusion tensors were then reoriented according to the non-linear spatial transformation applied during normalization, using the preservation of principal directions (PPD) method (Alexander et al., 2001). The FA volumes from the 11 subjects were averaged, and white matter masks were obtained by thresholding the mean FA volume at 0.4<FA<0.5, 0.5<FA<0.6, 0.6<FA<0.7, 0.7<FA<0.8, 0.8<FA<0.9, and 0.9<FA<1 (Fig. 1). The average coherence of primary eigenvectors was then estimated for white matter voxels from each range of FA values (Jones et al., 2002). The whole procedure was repeated for different smoothing sizes, and plots of the average coherence of primary eigenvectors in white matter as a function of the smoothing size were produced, for each range of FA values (Fig. 1).
Figure 1.

Flowchart diagram of the process followed in order to evaluate normalization based on mean DW information, for different levels of smoothing. A similar process was followed to evaluate normalization based on mean DW and FA information, as well as, mean DW, FA and trace information.
The procedure described in the last paragraph was repeated with normalization based on both mean DW and FA information. The only deviation from that procedure was that, in each subject, the displacement fields from the normalization of mean DW and FA maps to the temporary template were averaged, and the resulting spatial transformation was applied on the b=0sec/mm2 and DW volumes of that subject. The same process was repeated with normalization based on mean DW, FA and trace information. Plots of the average coherence of primary eigenvectors in white matter as a function of the smoothing size were compared, for each range of FA values mentioned above, and for normalization based on: a) mean DW information, b) mean DW and FA information, and c) mean DW, FA and trace information. Maps of the difference in coherence between the different normalization approaches were also produced. The normalization procedure that provided high average coherence of primary eigenvectors in white matter was used in the rest of this work for the development of the final DTI brain template.
The accuracy in matching different brain structures between subjects was assessed for the selected normalization approach. For that purpose, eight landmarks were first selected in the b=0sec/mm2 images and FA maps of the 11 subjects, obtained after normalization with the selected approach (Table 2). The same landmarks were also selected on the average b=0sec/mm2 images for the group of 11 subjects. The mean and standard deviation of the distance between the location of the landmarks in the average and individual b=0sec/mm2 images were estimated.
Table 2.
MNI coordinates of the landmarks selected for assessing the accuracy of the normalization approach, and the mean and standard deviation of the distance between the landmarks in the group-average and individual b=0sec/mm2 images.
| (x,y,z) MNI coordinates | Mean Distance (mm) | Standard Deviation of Distance (mm) |
|---|---|---|
| (1, 31, −3) | 1.3 | 0.7 |
| (1, −45, 7) | 1.3 | 0.9 |
| (−18, 41, −5) | 1.3 | 0.8 |
| (18, 42, −5) | 1.1 | 0.8 |
| (39, −2, −26) | 1.4 | 0.5 |
| (−39, −6, −26) | 0.9 | 0.7 |
| (−6, −8, 40) | 1.1 | 0.7 |
| (1, 1, −5) | 0.8 | 1.0 |
Development of the DTI Brain Template
The b=0sec/mm2 and DW volumes from the 67 participants were normalized to the temporary template using the strategy selected in the last step. The final dimensions of the normalized b=0sec/mm2 and DW volumes were 181 × 217 × 181 voxels, and the final voxel-size was 1mm × 1mm × 1mm. Mean b=0sec/mm2 and mean DW maps over all subjects were produced. The locations of various brain structures in the mean b=0sec/mm2 maps and ICBM-152 T2-weighted images were compared quantitatively for the two templates. The landmarks used in this comparison were those listed in Table 2, as well as the following: {(−8, 71, 5), (−8, −106, 1), (−8, −36, −44), (14, −37, 70), (−70, −26, −12), (71, −26, −12)} (MNI coordinates in mm), corresponding to structures at, or near, the most anterior, posterior, inferior, superior, left, and right parts of the brain, respectively. Diffusion tensors were also calculated in each normalized dataset. The diffusion tensors were then reoriented using PPD. The mean tensor in each voxel of the final DTI template was obtained by averaging the tensors from the 67 subjects on an element-by-element basis. The resulting template was named “IITmean DTI template”. Furthermore, the median tensor in each voxel of the final DTI template was selected to be the tensor with the minimum average distance from the tensors of all other subjects (Jones et al., 2002). The template containing the median tensor in each voxel was named the “IITmedian DTI template”. Maps of FA and trace were also produced from the mean and median tensors. The IITmean and IITmedian templates, as well as the corresponding FA and trace maps, and the b=0sec/mm2 and mean DW volumes are available at www.iit.edu/~mri.
The IITmean and IITmedian DTI templates were compared on a voxel-by-voxel basis by subtracting corresponding maps of FA, trace, linearity, planar, and spherical indices (Basser and Pierpaoli, 1996; Alexander et al., 2000). Additionally, in order to explain the differences between the two templates simulations were conducted. First, a cylindrical diffusion tensor with eigenvalues λ1=1.7×10⁻³ mm2/sec, λ2=0.2×10⁻³ mm2/sec, and λ3=0.2×10⁻³ mm2/sec, was simulated so that its primary, secondary, and tertiary eigenvectors were parallel to the x, y, and z-axes, respectively. One thousand tensors were then simulated by first rotating the original tensor around the y-axis, and subsequently around the x-axis. The angle of rotation around the y-axis was selected from a Gaussian distribution with a mean of zero and a FWHM of 10°, and the angle of rotation around the x-axis was selected randomly. Thus, the 1000 simulated tensors were positioned so that their primary eigenvectors were Gaussian distributed around the x-axis. The mean and median of the 1000 tensors were estimated, and their shape was compared using quantities such as the linearity, planar and spherical indices, and the FA (Alexander et al., 2000). The simulation was repeated for angles of rotation around the y-axis selected from Gaussian distributions with FWHM between 10° and 180°, in increments of 10°. Plots of quantities describing the shape of the mean and median tensors were produced. The same process was repeated for simulated generally anisotropic tensors with eigenvalues λ1=1.25×10⁻³ mm2/sec, λ2=0.7×10⁻³ mm2/sec, and λ3=0.15×10⁻³ mm2/sec. In a separate simulation, cylindrical diffusion tensors with the eigenvalues mentioned earlier, were mixed with spherical tensors with λ1=λ2=λ3=0.7×10⁻³ mm2/sec. The percentage of spherical tensors included in the mixture was varied between 0% and 100%, and the primary, secondary, and tertiary eigenvectors of all tensors were parallel to the x, y, and z-axes, respectively. The mean and median tensors were estimated and plots of quantities describing the shape of the mean and median tensors were produced.
The IITmean and IITmedian DTI templates were compared to previously published templates. First, diffusion anisotropy color maps were compared based on level of artifacts, smoothness, and ability to identify certain small brain structures. Second, the Sobel operator was applied on FA maps of a) the IITmean DTI template and b) the only other publicly available DTI template also based on a large number of subjects (Mori et al., 2008). An estimate of the image gradient was obtained in each voxel and was used to evaluate the sharpness of the FA maps corresponding to the two templates. Regions of interest (ROI) were drawn on the FA maps following application of the Sobel operator, on the detected edges of homologous white matter structures, covering voxels where the gradient was highest (Table 3). The number of voxels included in each ROI is listed in Table 3. The image gradient in the selected ROIs was compared between templates. A two-tailed Student’s t-test was used to assess the significance of any differences. Only differences with p<0.01, corrected for multiple comparisons with the Bonferroni approach, were considered significant. Differences in image sharpness of the FA maps of the IITmean template and that developed by Mori et al. were also assessed by comparing the normalized power spectra between templates.
Table 3.
Mean and standard deviation of the image gradient at the edges of white matter structures of the IITmean template and the template published by Mori et al., 2008. The number of voxels used to measure the average image gradient for each white matter structure is also listed.
| Structure | IITmean | Mori et al. 2008 | # of voxels | p-value |
|---|---|---|---|---|
| Genu | 1.4±0.2 | 0.91±0.07 | 31 | <2×10⁻¹³ |
| Cingulum | 0.84±0.12 | 0.44±0.08 | 17 | <2×10⁻⁸ |
| Anterior limb of internal capsule | 0.57±0.04 | 0.44±0.06 | 15 | <3×10⁻⁵ |
| Superior longitudinal fasciculus | 1.20±0.17 | 0.72±0.03 | 20 | <2×10⁻⁹ |
| Inferior longitudinal fasciculus | 0.9±0.1 | 0.71±0.04 | 28 | <4×10⁻¹¹ |
| Corticopontine tract | 1.1±0.1 | 0.51±0.09 | 39 | <2×10⁻²⁵ |
ROIs were also drawn in the central portion of homologous white matter structures of the IITmean DTI template and that of Mori et al. (Table 4). All ROIs were drawn based on axial mean b=0sec/mm2 images and FA maps, in a single, randomly selected hemisphere (except for the splenium and genu of the corpus callosum). FA values in the selected ROIs were compared between templates. A two-tailed Student’s t-test was used to assess the significance of any differences. Only differences with p<0.01, corrected for multiple comparisons with the Bonferroni approach, were considered significant.
Table 4.
Mean and standard deviation of FA in white matter ROIs of the IITmean template and the template published by Mori et al., 2008.
| Structure | IITmean FA | Mori et al. 2008, FA | # of voxels | p-value |
|---|---|---|---|---|
| Splenium | 0.841±0.015 | 0.729±0.018 | 24 | <2×10⁻¹⁶ |
| Genu | 0.862±0.011 | 0.690±0.017 | 16 | <2×10⁻¹³ |
| Cingulum | 0.60±0.03 | 0.40±0.03 | 64 | <5×10−45 |
| Posterior limb of internal capsule | 0.72±0.03 | 0.63±0.03 | 40 | <4×10⁻¹⁵ |
| External capsule | 0.47±0.03 | 0.32±0.01 | 30 | <2×10⁻²⁰ |
| Forceps minor | 0.52±0.02 | 0.42±0.02 | 23 | <2×10⁻¹² |
| Corticopontine tract | 0.45±0.05 | 0.29±0.02 | 10 | <6×10⁻⁵ |
| Optic Radiations | 0.53±0.04 | 0.48±0.02 | 30 | <2×10⁻⁵ |
Finally, several commonly traced white matter fiber-tracts were mapped based on the data of the IITmean template, in order to assess the accuracy of fiber-orientation information in the IIT template. These tracts were the: corpus callosum (cc), inferior fronto-occipital fasciculus (ifo), forceps minor (fm), superior longitudinal fasciculus (slf), cerebrospinal tract (cst), uncinate fasciculus (unc), cingulum (cg), fornix (fx), and inferior longitudinal fasciculus (ilf) (all abbreviations of names of anatomical structures mentioned in this paper are included in Table 5). ROIs were selected, which functioned as seeds for tractography based on the stream-lines approach with 2nd order Runge-Kutta integration (www.slicer.org). The resulting estimates of white matter pathways were qualitatively compared to a white matter atlas. A quantitative assessment was not feasible since the ground truth regarding white matter pathways is not known for each subject, or for the group.
Table 5.
Abbreviations of names of anatomical structures
| ac | Anterior commissure | ilf | Inferior longitudinal fasciculus |
| alic | Anterior limb of internal capsule | mcp | Middle cerebellar peduncle |
| atr | Anterior thalamic radiations | ml | Medial lemniscus |
| cc | Corpus callosum | oc | Optic chiasm |
| cg | Cingulum | on | Optic nerve |
| cpt/cst | Corticopontine/corticospinal tract | opt | Optic tract |
| dn | Dentate nucleus | pc | Posterior commissure |
| dscp | Decussation of superior cerebellar peduncles | pct | Pontine crossing tract |
| ec | External capsule | plic | Posterior limb of the internal capsule |
| fm | Forceps minor | ptr | Posterior thalamic radiations |
| fx | Fornix | scp | Superior cerebellar peduncle |
| fxc | Column of the fornix | slf | Superior longitudinal fasciculus |
| fxp | Precommissural part of the fornix | sn | Substantia nigra |
| gcc | Genu of the corpus callosum | st | Stria terminalis |
| icp | Inferior cerebellar peduncle | str | Superior thalamic radiations |
| ifo | Inferior fronto-occipital fasciculus | unc | Uncinate fasciculus |
Results
Evaluation of DTI Normalization Based on Multiple Quantities
Graphs of the average coherence of primary eigenvectors in white matter as a function of the smoothing size are shown in Figure 2, for different normalization approaches and different FA values. In voxels with 0.4<FA<1, the average coherence was higher when normalization was based on more information than just the mean DW (Fig. 2). More specifically, in voxels with 0.4<FA<0.7, the highest average coherence was achieved when using mean DW and FA information in the normalization process. In voxels with 0.7<FA<1, average coherence was the highest when using mean DW, FA and trace information (Fig. 2). Also, the maximum average coherence in voxels with 0.4<FA<1 was achieved for smoothing with a Gaussian kernel with FWHM between 4mm – 5mm, approximately (Fig. 2). Examples of maps of the difference in coherence between different normalization approaches are shown in Figure 3. The number of voxels and standard deviation of the coherence (StdDevCoherence) for each range of FA values were lower for higher FA values (Table 6). For most white matter voxels, average coherence was the highest when combining mean DW and FA information for the purposes of normalization, and when smoothing with FWHM between 4–5mm. Thus, the normalization approach that was chosen for the development of the DTI brain template was based on mean DW and FA information, and smoothing with a Gaussian kernel with FWHM=4mm.
Figure 2.

Graphs of the average coherence of primary eigenvectors in white matter as a function of the smoothing size, for different normalization approaches and different FA values. Squares correspond to normalization using only mean DW information, triangles to mean DW and FA information, and X’s to mean DW, FA and trace information. Error bars representing the standard deviation of coherence for each range of FA values were not included, since they would overlap with each other and complicate the graph. Instead, the standard deviations for normalization using mean DW and FA information and smoothing with FWHM=4mm were included in Table 6. The standard deviations for other normalization approaches were almost equal to those shown in Table 6.
Figure 3.

Maps of the difference in coherence of primary eigenvectors (A–D) when using: i) mean DW and FA information for the purposes of normalization and smoothing with FWHM=4mm, compared to using ii) mean DW information and smoothing with FWHM=5mm. In images A–D, white represents higher coherence when using approach (i), black represents higher coherence when using approach (ii), and the grey color of the background represents no difference in coherence between the two normalization approaches. Images E–H show corresponding FA maps derived from the final IITmean DTI template, and were included here to better visualize the location of the differences shown in images A–D.
Table 6.
Number of voxels and standard deviation of the coherence (StdDevCoherence) for each range of FA values, when normalization is based on mean DW and FA information and the FWHM of the smoothing kernel is 4mm. Similar numbers of voxels and StdDevCoherence were obtained for the other normalization approaches.
| # of voxels | StdDevCoherence | |
|---|---|---|
| 0.4<FA<0.5 | 134,093 | 0.13 |
| 0.5<FA<0.6 | 71,448 | 0.09 |
| 0.6<FA<0.7 | 29,468 | 0.06 |
| 0.7<FA<0.8 | 14,826 | 0.04 |
| 0.8<FA<0.9 | 5,976 | 0.02 |
| 0.9<FA<1 | 868 | 0.02 |
The accuracy in matching different brain structures between subjects for the selected normalization approach is described in Table 2. The mean distance between landmarks in the group and individual b=0sec/mm2 images was approximately equal to 1.1mm (Table 2). For 60% of all landmarks selected in all subjects, the distance was 1mm or less, for 86% of all landmarks 2mm or less, and for 100% of the landmarks the distance was 3 mm or less.
Development of the DTI Brain Template
Examples of the mean b=0sec/mm2 and mean DW maps over all participants are shown in Figure 4. Most of the brain features visible in the images from individual subjects were preserved after averaging the normalized maps from the 67 subjects. Also, comparison of the mean b=0sec/mm2 maps to the published ICBM-152 T2-weighted template showed good correspondence of the size and location of brain structures between the two datasets (Fig. 4). More specifically the difference in the location of all landmarks between the two templates was less than 1mm.
Figure 4.

Axial images from the ICBM-152 T2-weighted brain template (top row), and the corresponding mean b=0sec/mm2 (second row) and mean DW (third row) maps over all 67 participants. The bottom row contains overlays of the diffusion anisotropy color maps derived from the IITmean template on ICBM-152 T2-weighted images.
Examples of diffusion anisotropy color maps, FA and trace maps corresponding to the IITmean and IITmedian templates are displayed in Figure 5. Most of the features present in diffusion anisotropy color maps, FA and trace maps from individual subjects were preserved in the IITmean and IITmedian templates. Images derived from the IITmedian template appeared more noisy than the corresponding images from the IITmean template, especially in regions near the surface of the brain (Fig. 5).
Figure 5.

Axial diffusion anisotropy color maps, FA and trace maps derived from the IITmean (A, C, E) and IITmedian (B, D, F) templates.
Subtracting diffusion anisotropy maps corresponding to the IITmean and IITmedian templates demonstrated that, in white matter tissue, diffusion anisotropy of mean tensors was lower on average than that of median tensors (Fig. 6A,B). Furthermore, near the interface of brain tissue and CSF-filled spaces, the eigenvalues and trace were increased, and the FA was in many cases decreased for mean compared to median tensors (Fig. 6). In the simulations that were conducted to explain the main effects causing the differences between the mean and median templates, when averaging cylindrical tensors that were not aligned with each other, the linearity and FA of the mean tensor decreased, and the spherical index increased with increasing angles between the simulated tensors (Fig. 7A). In contrast, the values of all quantities derived from the median tensor remained constant and equal to those of each individual simulated tensor (Fig. 7A). Similar results were obtained for generally anisotropic tensors. In the simulations where cylindrical tensors were mixed with spherical tensors, the linearity and FA of the mean tensor decreased, and the spherical index increased with increasing percentage of spherical tensors included in the mixture (Fig. 7B). In contrast, the values of all quantities derived from the median tensor remained constant and equal to those of the cylindrical tensors as long as the percentage of spherical tensors included in the mixture was lower than 50%. When the percentage of spherical tensors was higher than 50% the values of all quantities derived from the median tensor were equal to those of the spherical tensors (Fig. 7B).
Figure 6.

A) Maps of the voxels in which the FA of the median tensor is higher than that of the mean tensor. B) Maps of the voxels in which the FA of the mean tensor is higher than that of the median tensor. The different grey scale levels represent the absolute value of the FA difference between mean and median tensors. C) Map of the voxels in which the trace of the median tensor is higher than that of the mean tensor. D) Map of the voxels in which the trace of the mean tensor is higher than that of the median tensor. The different grey scale levels represent the absolute value of the difference in trace between the mean and median tensors.
Figure 7.

A) Simulation of averaging misaligned cylindrical tensors: Plots of the linearity, spherical index and FA of mean (grey line) and median (black line) tensors as a function of half of the FWHM of the Gaussian distribution used to select the rotation of simulated cylindrical tensors around the y-axis. Increased FWHM corresponds to tensors that are not well aligned with each other. B) Simulation of averaging cylindrical and spherical tensors: Plots of the linearity, spherical index and FA of mean (grey line) and median (black line) tensors as a function of the percentage of spherical tensors included in the mixture.
The diffusion anisotropy color maps derived form the IITmean DTI template appeared sharper than the anisotropy color maps of previously published DTI templates (Jones et al., 2002; Mori et al., 2008; Xu et al., 2003; Chiang et al., 2008). The values of the FA image gradient at the edges of selected white matter structures were significantly higher in the IITmean template compared to that of Mori et al., 2008 (Table 3). Furthermore, the energy at high spatial frequencies was higher in the normalized power spectrum of FA maps from the IITmean template than the template of Mori et al., 2008 (Fig. 8). Consequently, the anterior and posterior commissures (ac, pc) near the medial sagittal plane (Fig. 9D,G), the optic chiasm (oc) (Fig. 9G), and the decussation of the superior cerebellar peduncles (dscp) (Fig. 9C) were visible in the IITmean template, and not in the template of Mori et al, 2008. Furthermore, the medial lemniscus (ml) (Fig. 9A), inferior cerebellar peduncles (icp) (Fig. 9B), inferior fronto-occipital fasciculus (ifo) (Fig. 9C), substantia nigra (sn) (Fig. 9C), cingulum (cg) (Fig. 9D,F), column of the fornix (fxc) (Fig. 9D), precommissural part of the fornix (fxp) (Fig. 9D), fornix (fx) (Fig. 9E,G), corpus callosum (cc) (Fig. 9F,G), appeared sharper in the IITmean template compared to the template by Mori et al., 2008 (Table 3).
Figure 8.

Normalized power spectra of FA maps from the IITmean template (black curve) and that of Mori et al., 2008 (grey curve). Each curve was obtained by averaging all the profiles of the power spectra along axes centered at a spatial frequency of 0mm−1 and rotated by 1° intervals. The power spectra shown here correspond to the FA maps shown in Figure 9D.
Figure 9.
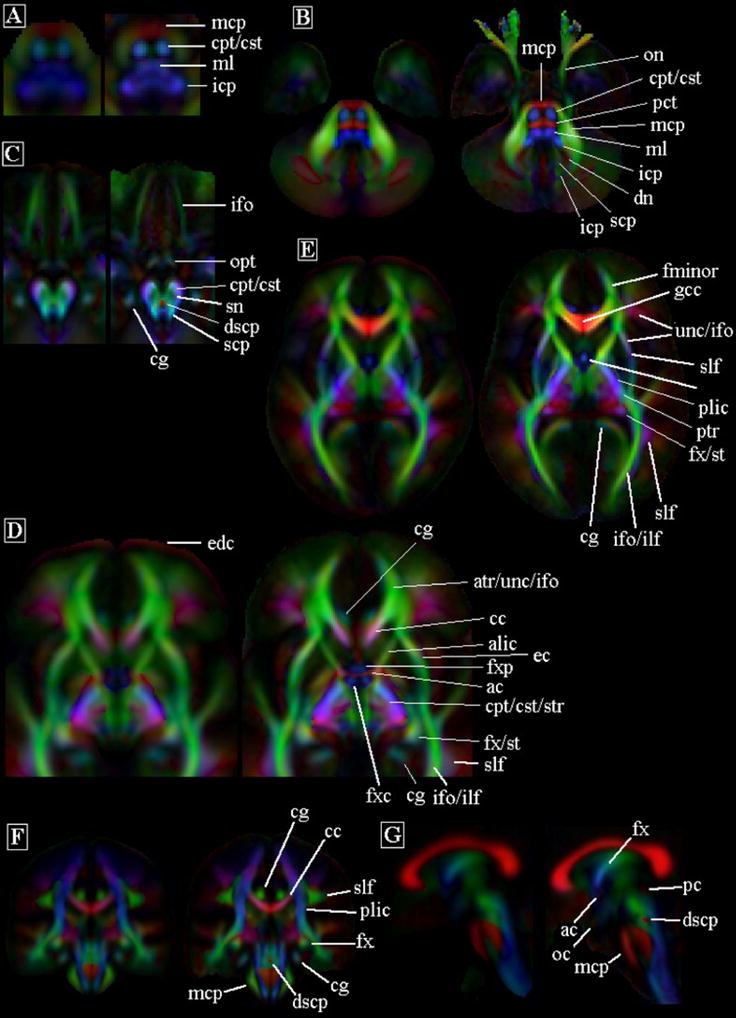
Diffusion anisotropy color maps obtained from a previously published DTI template (left image in each image pair) (Mori et al., 2008) and the IITmean DTI template (right image in each image pair). Abbreviations are defined in Table 4.
Several white matter structures appeared markedly darker in the FA and anisotropy color maps of the template by Mori et al., 2008, compared to the IITmean template (cerebropontine/cerebrospinal tract, cpt/cst, Fig. 9A) (ml, Fig. 9A,) (fxc, fxp, Fig. 9D) (cc, Fig. 9G). Quantitative comparison of FA values in selected white matter ROIs of the IITmean template and the template developed by Mori et al., showed significantly lower FA values in all selected ROIs in the latter (p<6×10⁻⁵) (Table 4). Furthermore, the FA values in the ROIs of the IITmean template were comparable to those published elsewhere for individual subjects in similar age groups (Pierpaoli et al., 1996; Bisdas et al., 2008).
The IIT templates were free of eddy-current artifacts, while a red-colored band caused by eddy-currents (edc) was visible in the template by Mori et al. (Fig. 9D,E). No other image artifacts were visible in the IIT templates, while susceptibility-induced artifacts were seen in several previously published templates (Chiang et al., 2008; Zhang et al., 2006; Ardekani and Sinha, 2006). Finally, the optic nerves (on) were clearly visible only in the IITmean template (Fig. 9B) (Jones et al., 2002; Mori et al., 2008). A detailed comparison of the median tensors to those of other templates was not feasible, since only one other such template has been published, and only few images were presented (Jones et al., 2002).
Finally, several commonly traced white matter fiber-tracts were mapped based on the data of the IITmean template (Fig. 10). Comparison to a white matter atlas showed good correspondence of the resulting estimates of these tracts to known white matter anatomy of the human brain (Mori et al., 2005; Wakana et al., 2004).
Figure 10.

3D renderings of the cc (A), ifo (B), fm (C), slf (D), cst (E), unc (F), cg (G), fx (H), ilf (I), produced from the IITmean DTI template.
Discussion
A DTI human brain template that is free of artifacts and preserves the information on the microstructural properties of white matter throughout the brain, is crucial for accurate voxel-based comparisons of the micro-architecture of white matter across populations, as well as for the development of a white matter atlas. In this work, several shortcomings of previously published efforts to develop a DTI brain template were addressed. The resulting set of DTI templates a) is characterized by higher image sharpness, b) provides the ability to distinguish smaller white matter fiber structures, c) contains fewer image artifacts, than previously developed templates, and to our knowledge, is one of only two templates produced based on a relatively large number of subjects. Additionally, the IIT DTI templates contain information on the microstructure of brain tissue that is comparable to what has been published for individual healthy subjects from similar age groups. Finally, the IITmean and IITmedian templates match spatially the commonly used ICBM-152 anatomical brain template, thereby simplifying the combination of DTI, anatomical and functional brain investigations.
Effects of DTI data acquisition methods on the final human brain DTI template
One of the factors contributing to the quality of the IITmean and IITmedian DTI templates was that the DTI data used in the development of these templates contained minimal image artifacts. Since Turboprop-DTI is a gradient and spin-echo (GRASE) DTI sequence, it provides images with significantly fewer susceptibility and eddy-current-related artifacts than conventional EPI-based DTI (Pipe et al., 2002), even when the latter is combined with parallel imaging (Gui et al., 2008). As a result, the final IIT templates were free of eddy-current artifacts. This was not true for the only other template based on a relatively large number of subjects and constructed using SE-EPI-DTI data (Mori et al. 2008) (Fig. 9D,E) (Table 1). Furthermore, the IIT templates were not affected by susceptibility artifacts in the brainstem, temporal and frontal lobes, in contrast to previously published, EPI-based DTI templates (Chiang et al., 2008; Zhang et al., 2006; Ardekani and Sinha, 2006). A manifestation of this was the fact that white matter fiber-bundles such as the cpt, cst, oc, on, ifo, ilf, were visible and sharper in the IIT templates compared to DTI templates based on SE-EPI-DTI (Fig. 9) (Table 3) (Jones et al., 2002; Mori et al., 2008).
In addition to using DTI data with minimal artifacts, the acquisition scheme used in this work was more appropriate for the development of an accurate DTI template than schemes used in previous efforts. In the only other study that also used a technique that provides distortion-free DTI data (Line-Scan DTI) to scan 16 subjects, and averaged the data, a slice thickness of 4mm and only 6 diffusion directions were used due to the low SNR per unit time for that sequence (Park et al., 2003) (Table 1). In SE-EPI-DTI studies, 1.5T scanners, relatively large voxels (15.6mm3) (Mori et al., 2008; Jones et al., 2002), gaps between the slices (Chiang et al., 2008; Zhang et al., 2006; Park et al., 2003), and 6 diffusion directions (Goodlett et al., 2006; Park et al., 2003; Xu et al., 2003; Ardekani and Sinha, 2006) were used (Table 1). In contrast, in the work presented here, a 3T scanner, relatively small voxels (10.5mm3), a slice thickness of 3mm with no gaps between slices, and a minimum energy scheme with 12 diffusion directions were used, providing sufficient SNR (SNR=24±10 for white matter in b=0sec/mm2 images), sufficiently high spatial resolution, and high-quality DTI information, which are necessary for the development of an accurate DTI template (Hasan et al., 2001; Papadakis et al., 1999; Jones, 2004). Compared to Line-Scan DTI, this acquisition scheme was possible with Turboprop-DTI, since the latter is characterized by higher SNR per unit time than the former. However, a higher number of diffusion directions and smaller voxels than those used in this work would not be appropriate for Turboprop-DTI at this time, since in order to achieve sufficient SNR for each image volume, the acquisition time would have to be increased significantly.
Effects of participants’ age on the final human brain DTI template
In addition to the improved DTI data acquisition procedures used in this work, a careful recruitment of human subjects was also conducted. More specifically, the fact that the diffusion properties of brain tissue change with age was taken into consideration. For that reason, healthy subjects between the ages of 20 and 40 years were recruited, since the diffusion properties of the brain are relatively unchanged in that age group (Sullivan and Pfefferbaum, 2006; Hasan et al., 2008). Furthermore, the minimum, maximum and mean age for the groups of men and women that participated in this study were similar. In contrast, previous studies averaged DTI data from subjects with very different ages (e.g. 18–59 years of age) (Mori et al., 2008), for which the differences in macro and micro-structural properties of the brain are expected to be significant. This is possibly one reason for the significantly lower FA values detected in white matter in the template developed by Mori et al., compared to the IITmean template. Although, as a direct consequence of our recruitment strategy the IITmean and IITmedian DTI templates contain information that is representative of the characteristics of healthy human brain in the 20–40 years age-range only, we believe that such a template is more meaningful and potentially more useful than a template that is produced by averaging fundamentally different microstructural characteristics. A possible solution would be to repeat the process presented here for different age-groups, in order to produce age-specific DTI brain templates.
Effects of spatial normalization methods on the final human brain DTI template
Another significant factor contributing to the quality of the IIT DTI templates was the selection of spatial normalization strategy. Non-linear registration was used in this work. The benefits of non-linear approaches towards accurate normalization of DTI data are widely known (Rohde et al., 2004; Goodlett et al., 2006; Zhang et al., 2006; Zhang et al., 2007; Park et al., 2003; Alexander and Gee, 2000; Ardekani and Sinha, 2006; van Hecke et al., 2008). However, in few previously published efforts to develop a DTI template affine registration was used instead, which is driven by macroscopic features and may provide less accurate inter-subject matching (Jones et al., 2002; Mori et al., 2008; Muller et al., 2007). The main advantage of affine registration is reduced sensitivity to image noise compared to non-linear approaches. In the present work, the effects of image noise on non-linear normalization were minimized: a) by using DTI data with sufficient SNR, b) by combining mean DW and FA information during normalization, and c) by appropriately smoothing the mean DW and FA images for the purposes of transformation estimation. Furthermore, mean DW images are characterized by significantly low noise content, since they are produced by averaging multiple DW images from different diffusion gradient directions.
As a result of the non-linear registration approach used in this work, the mismatch of selected landmarks was only 1.1mm on average. Additionally, although different landmarks were used in the present study and that of Mori et al., 2008, the 60%, 86% and 100% points in the cumulative distribution of mismatch of landmarks were shifted to lower mismatches in the former compared to the latter, suggesting lower registration errors in the present study. Comparison of the normalization accuracy by means of the coherence of primary eigenvectors was not feasible, since the only other publicly available template to date (Mori et al., 2008) includes only the final mean tensors, and not the tensors from individual datasets.
The normalization approach used here also contributed to the increased sharpness of diffusion anisotropy maps derived from the IIT DTI templates compared to DTI templates produced with affine registration of a single scalar quantity (Mori et al., 2008; Jones et al., 2002) (Table 3) (Fig. 8,9). The selected normalization approach also allowed relatively small white matter structures, such as the anterior commissure, to be clearly visible in the final IIT DTI templates (Fig. 9). In addition, the FA values in white matter were higher in the IITmean template compared to the template developed by Mori et al., partly due to increased normalization accuracy that limited averaging of properties from microstructurally different tissues. Furthermore, tractography based on the IITmean DTI template resulted in maps of tracts that showed good correspondence to known white matter anatomy (Fig. 10). Although tractography results cannot be validated in living subjects, the general features of the major pathways presented here were similar to those of tracts produced in individual subjects, suggesting that the normalization approach used here maintained similar tensor-orientation information in the IITmean DTI template as that of single subjects. However, for several structures near the surface of the brain, normalization was not as successful, similar to previously published studies. This was demonstrated as reduced FA in the IITmean template, and enhanced noise in the FA of the IITmedian template, due to assignment of very different tensors to the same final location. Further research is required to develop advanced techniques that will allow accurate normalization of DTI data even in regions near the surface of the brain.
The non-linear normalization performed in this study was based on algorithms provided by SPM5, which are widely used and extensively tested, and on the information contained in mean DW and FA maps from the different subjects. It was demonstrated that normalization based on combination of mean DW and FA information was superior to normalization based only on mean DW data, and of similar or higher quality compared to normalization based on mean DW, FA and trace information. It is true that many more combinations of different scalar quantities derived from the diffusion tensor could be tested, and even the diffusion tensor itself could be included in the normalization process to potentially improve inter-subject registration of DTI data. However, the main macro and microstructural features of the brain are contained in mean DW and FA images. Mean DW maps are characterized by high SNR and capture well the anatomy of the brain, while FA maps contain crucial white matter information. Thus, with the use of robust and easy to use non-linear registration tools it was possible to achieve normalization of the quality presented in this work. Nevertheless, a number of inter-subject registration approaches that are more accurate than the normalization tools of SPM5 used here, have been developed (Klein et al., In press). Also, several advanced non-linear registration algorithms that normalize DTI data based on more information derived from the diffusion tensor than what was used here, or the diffusion tensor itself, have been published (Cao et al., 2005; Rohde et al., 2004; Park et al., 2003; Alexander and Gee, 2000; Ruiz-Alzola et al., 2002; Verma and Davatzikos, 2004; Ziyan et al., 2007; Yeo et al., 2008). Further research is necessary to compare the accuracy of these algorithms. The raw data acquired in this work could serve as a basis for such comparisons, and the templates presented here could serve as a benchmark for future investigations.
The IITmean and IITmedian templates were shown to be in good agreement with the commonly used ICBM-152 template in terms of size and position of different brain structures (Fig. 4). This can be attributed to the use of non-linear registration tools and DTI raw data with minimal image artifacts. The fact that the IIT DTI templates match the ICBM-152 templates well, may allow simple integration of functional, macro and microstructural investigations.
Mean vs. median tensors
In the simulations, it was demonstrated that when the primary eigenvectors of multiple anisotropic tensors with the same shape are misaligned, the FA and linearity index of the mean tensor are reduced, and the spherical index of the mean tensor is increased, compared to the individual tensors (Fig. 7A). Also, the deviation in the shape of the mean tensor from that of the individual tensors increases for increased angular mismatch. In contrast, the median tensor maintains the shape of the individual tensors (and therefore the FA, linearity index values etc.) (Fig. 7A). This effect was observed in the experimental data, where the FA was shown to be higher in more white matter voxels of the IITmedian than the IITmean template, suggesting a mismatch in the primary eigenvectors of white matter tensors (Fig. 6A,B).
In the simulations, it was also demonstrated that when highly anisotropic and isotropic tensors are assigned to the same location due to imperfections in registration, the FA and linearity index of the mean tensor are reduced, and the spherical index of the mean tensor is increased, compared to the anisotropic tensors (Fig. 7B). For a mixture of isotropic and anisotropic tensors, as the percentage of isotropic tensors increases, the deviation in the shape of the mean tensor from that of the anisotropic tensors continuously increases, and the shape of the mean tensor approaches gradually that of the isotropic tensors. In contrast, the median tensor maintains the shape of the anisotropic tensors as long as at least 50% of the tensors are anisotropic, and assumes the shape of the isotropic tensors when less than 50% of the tensors are anisotropic (Fig. 7B). This effect was observed in the experimental data, where the FA in some edges of the ventricles appeared higher in the IITmedian than the IITmean template, suggesting the presence of imperfections in registration (Fig. 6A). Furthermore, since the eigenvalues of tensors in cerebrospinal fluid (CSF) are higher than the eigenvalues in grey or white matter, imperfections in inter-subject registration of CSF-filled spaces increase the eigenvalues of the mean tensor in neighboring tissues. In contrast, for the eigenvalues of the median tensor to be affected, more than 50% of the mixed tensors should correspond to CSF. This effect was observed in the experimental data, where the trace values along the edges of CSF-filled spaces were higher in the IITmean than the IITmedian template (Fig. 6C,D).
Based on the results shown in Figures 6 and 7, and the discussion above, one may conclude that the median tensor better represents the characteristics of tensors grouped during registration than the mean tensor. However, near the surface of the brain, the accuracy in registration of different structures is lower than in the rest of the brain. In some near-surface regions, the IITmedian template appears to be noisy, especially in diffusion anisotropy maps and less in trace maps. In the same regions where the IITmedian template appears noisy, the IITmean template is characterized by low anisotropy due to averaging of tensors with different shape and orientation. The decision of using the IITmedian instead of the IITmean template, or the opposite, ultimately depends on the task that one wishes to accomplish. For example, when a template that accurately represents the shape of the grouped tensors is of highest importance, then the IITmedian template would be most appropriate. The apparent SNR in different regions of the brain in the IITmedian template may be used as a measure of confidence for the information presented by both templates in these regions. For spatial normalization purposes, the IITmean template may be most appropriate since the noise in the IITmedian template may lead to registration errors, especially when combined with non-linear normalization techniques. These differences in the two templates will be reduced as the accuracy in the spatial normalization used for the construction of the templates is improved. Further research is required to evaluate the utility of the IIT DTI templates for different applications.
Conclusion
In this work, a set of human brain DTI templates (IITmean and IITmedian) was developed for subjects between 20 and 40 years of age. The IIT templates match spatially the ICBM-152 template, and a) are characterized by higher image sharpness, b) provide the ability to distinguish smaller white matter fiber structures, c) contain fewer image artifacts, than several previously published DTI templates, including the only other template based on a large number of subjects. Furthermore, the IIT DTI templates contain information on the microstructure of brain tissue that is comparable to what has been published for individual healthy subjects from similar age groups. The factors that contributed to the quality of the IIT templates were: a) the use of DTI data acquisition techniques and imaging protocol that provide image quality appropriate for the development of a brain template, b) the recruitment of subjects from a limited age-group with similar diffusion characteristics, c) the use of non-linear spatial normalization techniques, and d) the combination of information from different quantities derived from the DTI data during normalization. Also, the IIT templates were developed based on DTI data from 67 subjects. Differences between the IITmean and IITmedian DTI templates were investigated in simulations and actual data. The decision to use one template over the other depends on the task that one wishes to accomplish. Possible uses of the IIT templates include among others: spatial normalization of DTI data to a common space for voxel-based comparisons of the microstructural properties of brain tissue between cohorts of human subjects, development of a white matter atlas, and automated segmentation of white matter structures on a subject-by-subject basis through normalization to the IIT templates. Further improvement in the normalization techniques used for the development of the IIT templates will increase the accuracy of both templates and reduce the differences between them. The IITmean and IITmedian templates, the corresponding FA and trace maps, and the b=0sec/mm2 and mean DW volumes are available at www.iit.edu/~mri.
Acknowledgments
This work was supported by a grant from the National Institute of Biomedical Imaging and Bioengineering (NIBIB) 1R21EB006525-01.
Footnotes
Publisher's Disclaimer: This is a PDF file of an unedited manuscript that has been accepted for publication. As a service to our customers we are providing this early version of the manuscript. The manuscript will undergo copyediting, typesetting, and review of the resulting proof before it is published in its final citable form. Please note that during the production process errors may be discovered which could affect the content, and all legal disclaimers that apply to the journal pertain.
References
- Alexander AL, Hasan K, Kindlmann G, Parker DL, Tsuruda JS. A geometric analysis of diffusion tensor measurements of the human brain. Magn Reson Med. 2000;44:283–291. doi: 10.1002/1522-2594(200008)44:2<283::aid-mrm16>3.0.co;2-v. [DOI] [PubMed] [Google Scholar]
- Alexander DC, Gee JC. Elastic matching of diffusion tensor images. Comput Vis Image Und. 2000;77:233–250. [Google Scholar]
- Alexander DC, Pierpaoli C, Basser PJ, Gee JC. Spatial transformations of diffusion tensor magnetic resonance images. IEEE Trans Med Imaging. 2001;20:1131–1139. doi: 10.1109/42.963816. [DOI] [PubMed] [Google Scholar]
- Ardekani S, Sinha U. Statistical representation of mean diffusivity and fractional anisotropy brain maps of normal subjects. J Magn Reson Imaging. 2006;24:1243–1251. doi: 10.1002/jmri.20745. [DOI] [PubMed] [Google Scholar]
- Arfanakis K, Haughton VM, Carew JD, Rogers BP, Dempsey RJ, Meyerand ME. Diffusion tensor MR imaging in diffuse axonal injury. AJNR Am J Neuroradiol. 2002a;23:794–802. [PMC free article] [PubMed] [Google Scholar]
- Arfanakis K, Hermann BP, Rogers BP, Carew JD, Seidenberg M, Meyerand ME. Diffusion tensor MRI in temporal lobe epilepsy. Magn Reson Imaging. 2002b;20:511–519. doi: 10.1016/s0730-725x(02)00509-x. [DOI] [PubMed] [Google Scholar]
- Arfanakis K, Gui M, Lazar M. White matter tractography by means of Turboprop diffusion tensor imaging. Ann N Y Acad Sci. 2005;1064:78–87. doi: 10.1196/annals.1340.014. [DOI] [PubMed] [Google Scholar]
- Arfanakis K, Gui M, Tamhane AA, Carew JD. Investigating the Medial Temporal Lobe in Alzheimer’s Disease and Mild Cognitive Impairment, with Turboprop Diffusion Tensor Imaging, MRI-volumetry, and T2-relaxometry. Brain Imaging Behav. 2007;1:11–21. [Google Scholar]
- Bammer R, Augustin M, Strasser-Fuchs S, Seifert T, Kapeller P, Stollberger R, Ebner F, Hartung HP, Fazekas F. Magnetic resonance diffusion tensor imaging for characterizing diffuse and focal white matter abnormalities in multiple sclerosis. Magn Reson Med. 2000;44:583–591. doi: 10.1002/1522-2594(200010)44:4<583::aid-mrm12>3.0.co;2-o. [DOI] [PubMed] [Google Scholar]
- Basser PJ, Pierpaoli C. Microstructural and physiological features of tissues elucidated by quantitative-diffusion-tensor MRI. J Magn Reson B. 1996;111:209–219. doi: 10.1006/jmrb.1996.0086. [DOI] [PubMed] [Google Scholar]
- Basser PJ, Pajevic S, Pierpaoli C, Duda J, Aldroubi A. In vivo tractography using DT-MRI data. Magn Reson Med. 2000;44:625–632. doi: 10.1002/1522-2594(200010)44:4<625::aid-mrm17>3.0.co;2-o. [DOI] [PubMed] [Google Scholar]
- Bisdas S, Bohning DE, Besenski N, Nicholas JS, Rumboldt Z. Reproducibility, interrater agreement, and age-related changes of fractional anisotropy measures at 3T in healthy subjects: Effect of the applied b-value. AJNR Am J Neuroradiol. 2008;29:1128–1133. doi: 10.3174/ajnr.A1044. [DOI] [PMC free article] [PubMed] [Google Scholar]
- Bruno S, Cercignani M, Ron MA. White matter abnormalities in bipolar disorder: a voxel-based diffusion tensor imaging study. Bipolar Disorders. 2008;10:460–468. doi: 10.1111/j.1399-5618.2007.00552.x. [DOI] [PubMed] [Google Scholar]
- Cao Y, Miller MI, Winslow RL, Younes L. Large deformation diffeomorphic metric mapping of vector fields. IEEE Transactions on Medical Imaging. 2005;24:1216–1230. doi: 10.1109/tmi.2005.853923. [DOI] [PubMed] [Google Scholar]
- Chiang MC, Leow AD, Klunder AD, Dutton RA, Barysheva M, Rose SE, McMahon KL, de Zubicaray GI, Toga AW, Thompson PM. Fluid registration of diffusion tensor images using information theory. IEEE Transactions on Medical Imaging. 2008;27:442–456. doi: 10.1109/TMI.2007.907326. [DOI] [PMC free article] [PubMed] [Google Scholar]
- Ellis CM, Simmons A, Jones DK, Bland J, Dawson JM, Horsfield MA, Williams SC, Leigh PN. Diffusion tensor MRI assesses corticospinal tract damage in ALS. Neurology. 1999;53:1051–1058. doi: 10.1212/wnl.53.5.1051. [DOI] [PubMed] [Google Scholar]
- Goodlett C, Davis B, Jean R, Gilmore J, Gerig G. Improved correspondence for DTI population studies via unbiased atlas building. Med Image Comput Comput Assist Interv Int Conf. 2006;9(2):260–267. doi: 10.1007/11866763_32. [DOI] [PubMed] [Google Scholar]
- Gui M, Peng H, Carew JD, Lesniak MS, Arfanakis K. A tractography comparison between turboprop and spin-echo echo-planar diffusion tensor imaging. Neuroimage. 2008;42:1451–1462. doi: 10.1016/j.neuroimage.2008.05.066. [DOI] [PMC free article] [PubMed] [Google Scholar]
- Guimond A, Guttmann CRG, Warfield SK, Westin CF. Deformable registration of DT-MRI data based on transformation invariant tensor characteristics. Proceedings of the IEEE International Symposium on Biomedical Imaging; Washington DC, USA. 2002. pp. 1–4. [Google Scholar]
- Hasan KM, Ewing-Cobbs L, Kramer LA, Fletcher JM, Narayana PA. Diffusion tensor quantification of the macrostructure and microstructure of human midsagitaal corpus callosum across the lifespan. NMR Biomed. 2008;21:1094–1101. doi: 10.1002/nbm.1286. [DOI] [PMC free article] [PubMed] [Google Scholar]
- Hasan KM, Parker DL, Alexander AL. Comparison of gradient encoding schemes for diffusion-tensor MRI. J Magn Reson Imaging. 2001;13:769–780. doi: 10.1002/jmri.1107. [DOI] [PubMed] [Google Scholar]
- Jenkinson M, Smith SM. A global optimization method for robust affine registration of brain images. Medical Image Analysis. 2001;5(2):143–156. doi: 10.1016/s1361-8415(01)00036-6. [DOI] [PubMed] [Google Scholar]
- Jones DK, Griffin LD, Alexander DC, Catani M, Horsfield MA, Howard R, Williams SC. Spatial normalization and averaging of diffusion tensor MRI data sets. Neuroimage. 2002;17:592–617. [PubMed] [Google Scholar]
- Jones DK. The effect of gradient sampling schemes on measures derived from diffusion tensor MRI: A Monte-Carlo study. Magn Reson Med. 2004;51:807–815. doi: 10.1002/mrm.20033. [DOI] [PubMed] [Google Scholar]
- Klein A, Andersson J, Ardekani BA, Ashburner J, Avants B, Chiang MC, Christensen GE, Collins L, Hellier P, Song JH, Jenkinson M, Lepage C, Rueckert D, Thompson P, Vercauteren T, Woods RP, Mann JJ, Parsey RV. Evaluation of 14 nonlinear deformation algorithms applied to human brain MRI registration. Neuroimage. doi: 10.1016/j.neuroimage.2008.12.037. in press. [DOI] [PMC free article] [PubMed] [Google Scholar]
- Klingberg T, Hedehus M, Temple E, Salz T, Gabrieli JD, Moseley ME, Poldrack RA. Microstructure of temporo-parietal white matter as a basis for reading ability: evidence from diffusion tensor magnetic resonance imaging. Neuron. 2000;25:493–500. doi: 10.1016/s0896-6273(00)80911-3. [DOI] [PubMed] [Google Scholar]
- Le Bihan D, Mangin JF, Poupon C, Clark CA, Pappata S, Molko N, Chabriat H. Diffusion tensor imaging: concepts and applications. J Magn Reson Imaging. 2001;13:534–546. doi: 10.1002/jmri.1076. [DOI] [PubMed] [Google Scholar]
- Lim KO, Hedehus M, Moseley M, de Crespigny A, Sullivan EV, Pfefferbaum A. Compromised white matter tract integrity in schizophrenia inferred from diffusion tensor imaging. Arch Gen Psychiatry. 1999;56:367–374. doi: 10.1001/archpsyc.56.4.367. [DOI] [PubMed] [Google Scholar]
- Mori S, Oishi K, Jiang H, Jiang L, Li X, Akhter K, Hua K, Faria AV, Mahmood A, Woods R, Toga AW, Pike GB, Neto PR, Evans A, Zhang J, Huang H, Miller MI, van Zijl P, Mazziotta J. Stereotaxic white matter atlas based on diffusion tensor imaging in an ICBM template. Neuroimage. 2008;40:570–582. doi: 10.1016/j.neuroimage.2007.12.035. [DOI] [PMC free article] [PubMed] [Google Scholar]
- Mori S, Wakana S, van Zijl PCM, Nagae-Poetcher LM. MRI atlas of human white matter. 1. Elsevier; San Diego: 2005. [Google Scholar]
- Muller HP, Unrath A, Ludolph AC, Kassubek J. Preservation of diffusion tensor properties during spatial normalization by use of tensor imaging and fibre tracking on a normal brain database. Phys Med Biol. 2007;52:N99–109. doi: 10.1088/0031-9155/52/6/N01. [DOI] [PubMed] [Google Scholar]
- Park HJ, Kubicki M, Shenton ME, Guimond A, McCarley RW, Maier SE, Kikinis R, Jolesz FA, Westin CF. Spatial normalization of diffusion tensor MRI using multiple channels. Neuroimage. 2003;20:1995–2009. doi: 10.1016/j.neuroimage.2003.08.008. [DOI] [PMC free article] [PubMed] [Google Scholar]
- Papadakis NG, Xing D, Houston GC, Smith JM, Smith MI, James MF, Parsons AA, Huang CL, Hall LD, Carpenter TA. A study of rotationally invariant and symmetric indices of diffusion anisotropy. Magn Reson Imaging. 1999;17:881–892. doi: 10.1016/s0730-725x(99)00029-6. [DOI] [PubMed] [Google Scholar]
- Peng H, Agam G, Gui M, Arfanakis K. Evaluation of spatial normalization in Turboprop-DTI vs. SE-EPI-DTI. Proceedings of the ISMRM Sixteenth Scientific Meeting; Toronto, Canada. 2008. p. 1800. [Google Scholar]
- Pfefferbaum A, Sullivan EV. Disruption of brain white matter microstructure by excessive intracellular and extracellular fluid in alcoholism: evidence from diffusion tensor imaging. Neuropsychopharmacology. 2005;30:423–432. doi: 10.1038/sj.npp.1300623. [DOI] [PubMed] [Google Scholar]
- Pierpaoli C, Jezzard P, Basser PJ, Barnett A, Di Chiro G. Diffusion tensor MR imaging of the human brain. Radiology. 1996;201:637–648. doi: 10.1148/radiology.201.3.8939209. [DOI] [PubMed] [Google Scholar]
- Pipe JG, Farthing VG, Forbes KP. Multishot diffusion-weighted FSE using PROPELLER MRI. Magn Reson Med. 2002;47:42–52. doi: 10.1002/mrm.10014. [DOI] [PubMed] [Google Scholar]
- Pipe JG, Zwart N. Turboprop: improved PROPELLER imaging. Magn Reson Med. 2006;55(2):380–385. doi: 10.1002/mrm.20768. [DOI] [PubMed] [Google Scholar]
- Rohde GK, Pajevic S, Pierpaoli C. Multi-channel registration of diffusion tensor images using directional information. IEEE international Symposium on Biomedical Imaging: Nano to Macro. 2004;1:712–715. [Google Scholar]
- Rosario BL, Ziolko SK, Weissfeld LA, Price JC. Assessment of parameter settings for SPM5 spatial normalization of structural MRI data: application to type 2 diabetes. Neuroimage. 2008;41:363–370. doi: 10.1016/j.neuroimage.2008.02.004. [DOI] [PMC free article] [PubMed] [Google Scholar]
- Ruiz-Alzola J, Westin CF, Warfield SK, Alberola C, Maier S, Kikinis R. Nonrigid registration of 3-D tensor medical data. Med Image Anal. 2002;6:143–161. doi: 10.1016/s1361-8415(02)00055-5. [DOI] [PubMed] [Google Scholar]
- Smith SM. Fast robust automated brain extraction. Hum Brain Map. 2002;17(3):143–155. doi: 10.1002/hbm.10062. [DOI] [PMC free article] [PubMed] [Google Scholar]
- Sullivan EV, Pfefferbaum A. Diffusion tensor imaging and aging. Neurosci Biobehav Rev. 2006;30:749–761. doi: 10.1016/j.neubiorev.2006.06.002. [DOI] [PubMed] [Google Scholar]
- Schwartzman A, Dougherty RF, Taylor JE. Cross-subject comparison of principal diffusion direction maps. Magn Reson Med. 2005;53:1423–1431. doi: 10.1002/mrm.20503. [DOI] [PMC free article] [PubMed] [Google Scholar]
- Toga AW, Thompson PM, Mori S, Amunts K, Zilles K. Towards multimodal atlases of the human brain. Nat Rev Neurosci. 2006;7:952–966. doi: 10.1038/nrn2012. [DOI] [PMC free article] [PubMed] [Google Scholar]
- van Gelderen P, de Vleeschouwer MHM, DesPres D, Pekar J, van Zijl PCM, Moonen CTW. Water diffusion and acute stroke. Magn Reson Med. 1994;31:154–163. doi: 10.1002/mrm.1910310209. [DOI] [PubMed] [Google Scholar]
- van Hecke W, Sijbers J, D’Agostino E, Maes F, De Backer S, Vandervliet E, Parizel PM, Leemans A. On the construction of an inter-subject diffusion tensor magnetic resonance atlas of the healthy human brain. Neuroimage. 2008;43:69–80. doi: 10.1016/j.neuroimage.2008.07.006. [DOI] [PubMed] [Google Scholar]
- Verma R, Davatzikos C. Matching of diffusion tensor images using Gabor features. IEEE International Symposium on Biomedical Imaging: Nano to Macro. 2004;1:396–399. [Google Scholar]
- Wakana S, Jiang H, Nagae-Poetcher LM, van Zijl PCM, Mori S. Fiber tract-based atlas of human white matter anatomy. Radiology. 2004;230:77–87. doi: 10.1148/radiol.2301021640. [DOI] [PubMed] [Google Scholar]
- Xu D, Mori S, Shen D, van Zijl PC, Davatzikos C. Spatial normalization of diffusion tensor fields. Magn Reson Med. 2003;50:175–182. doi: 10.1002/mrm.10489. [DOI] [PubMed] [Google Scholar]
- Yeo BTT, Vercauteren T, Fillard P, Pennec X, Gotland P, Ayache N, Clatz O. DTI registration with exact finite-strain differential. IEEE International Symposium on Biomedical Imaging: Nano to Macro; 2008. pp. 700–703. [Google Scholar]
- Zhang H, Yushkevich PA, Alexander DC, Gee JC. Deformable registration of diffusion tensor MR images with explicit orientation optimization. Med Image Anal. 2006;10:764–785. doi: 10.1016/j.media.2006.06.004. [DOI] [PubMed] [Google Scholar]
- Zhang H, Yushkevich PA, Rueckert D, Gee JC. Unbiased white matter atlas construction using diffusion tensor images. Int Conf Med Image Comput Comput Assist Interv. 2007;10(2):211–218. doi: 10.1007/978-3-540-75759-7_26. [DOI] [PubMed] [Google Scholar]
- Ziyan U, Sabuncu MR, O’Donnell LJ, Westin CF. Nonlinear registration of diffusion MR images based on fiber bundles. Int Conf Med Image Comput Comput Assist Interv. 2007;4791:351–358. doi: 10.1007/978-3-540-75757-3_43. [DOI] [PubMed] [Google Scholar]