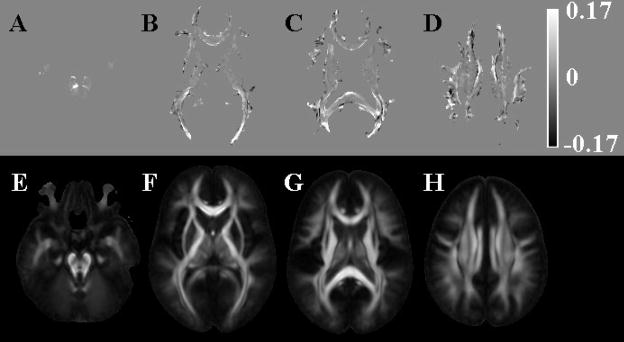
Figure 3.
Maps of the difference in coherence of primary eigenvectors (A–D) when using: i) mean DW and FA information for the purposes of normalization and smoothing with FWHM=4mm, compared to using ii) mean DW information and smoothing with FWHM=5mm. In images A–D, white represents higher coherence when using approach (i), black represents higher coherence when using approach (ii), and the grey color of the background represents no difference in coherence between the two normalization approaches. Images E–H show corresponding FA maps derived from the final IITmean DTI template, and were included here to better visualize the location of the differences shown in images A–D.

