Abstract
The ability of stem cells to differentiate into specified lineages in the appropriate locations is vital to morphogenesis and adult tissue regeneration. While soluble signals are important regulators of patterned differentiation, here we show that gradients of mechanical forces can also drive patterning of lineages. In the presence of soluble factors permitting osteogenic and adipogenic differentiation, human mesenchymal stem cells at the edge of multicellular islands differentiate into the osteogenic lineage, while those in the center became adipocytes. Interestingly, changing the shape of the multicellular sheet modulated the locations of osteogenic versus adipogenic differentiation. Measuring traction forces revealed gradients of stress that preceded and mirrored the patterns of differentiation, where regions of high stress resulted in osteogenesis while stem cells in regions of low stress differentiated to adipocytes. Inhibiting cytoskeletal tension suppressed the relative degree of osteogenesis versus adipogenesis, and this spatial patterning of differentiation was also present in three-dimensional multicellular clusters. These findings demonstrate a role for mechanical forces in linking multicellular organization to spatial differentials of cell differentiation, and represent an important guiding principle in tissue patterning that could be exploited in stem cell-based therapies.
Introduction
Morphogenesis involves a complex coordination of spatial rearrangements that give rise to numerous complex structures, and the differentiation of stem cells into the many cell types that populate these structures (1, 2). This orchestration of patterned differentiation within developmental structures is thought to be primarily regulated by spatial gradients of diffusible factors known as morphogens (3–6). It is generally thought that these morphogens can simultaneously control morphologic changes and differentiation programs in cells, such that the appropriate cell types attain their corresponding locations within complex tissues.
In addition to such morphogens, it is also clear that gradients in mechanical forces also exist within developing embryos that could contribute to the process of morphogenesis. During many of the massive rearrangements that occur in early development, such as convergence and extension, neural tube formation, dorsal closure, and anterior gut formation, mechanical forces appear to be involved (7–10). Furthermore, recent work suggests that such mechanical factors appear to contribute to the specification of adult mesenchymal and embryonic stem cells to various lineage fates (11–15). In the context of mesenchymal stem cells (MSCs), it has been shown that progressively increasing RhoA-mediated cytoskeletal tension can alter lineage specification from adipocytes or neural precursors to myocytes and osteoblasts (11, 12), raising the possibility that spatial gradients of stress within a structure could act to pattern differentiation. We recently introduced an approach to generate such force gradients in micropatterned sheets of cells, and demonstrated that such gradients can drive patterns of cell proliferation in endothelial and epithelial cells (16). It remains unclear, however, if such gradients of forces can also determine patterns of lineage specification of stem cells.
Here, we demonstrate that multicellular aggregates of MSCs undergo lineage specification as a function of aggregate geometry and of cell position within the aggregate. Cells on the outer edge of simple sheets committed to an osteogenic lineage while interior MSCs differentiated to adipocytes. Three-dimensional structures also exhibited partitioning of fat and bone. These patterns appear to result from non-uniform patterns in mechanical stress determined by multicellular shape, and generated by the actin-myosin cytoskeleton. Understanding these mechanical patterning effects will not only improve our understanding of in vivo differentiation, but may also provide important insights for optimizing stem cell-based therapies.
Materials and Methods
Materials
The following reagents were purchased from the given suppliers: Polydimethylsiloxane (PDMS) (Dow Corning Sylgard 184), Y-27632 (Tocris Bioscience 1254), blebbistatin (Tocris Bioscience 1760), ML-7 (Calbiochem 475880), fibronectin (BD Biosciences 356008), low melting point agarose (GibcoBRL 15517-014). Recombinant adenoviruses encoding GFP and ROCK 3 were prepared using the AdEasy XL system (Stratagene) as previously described (17).
Cell culture
Human Mesenchymal Stem Cells (Cambrex Biosciences, 32-year-old male and 21-year-old male) were cultured in growth media consisting of DMEM supplemented with 10% FBS, 0.3 mg/ml L-glutamine, 100 units/ml penicillin, and 100 μg/ml streptomycin. Adipogenic induction and osteogenic differentiation media were purchased from Cambrex Biosciences. Media was changed every 3 days except when cells were treated with blebbistatin and Y-27632 in which case the media was replaced daily. When infected with ad-GFP and ad-ROCKΔ3, adenoviruses containing GFP and ROCKΔ3 respectively, cells were incubated with the virus overnight and used the next day.
Pattern generation
Patterns of fibronectin on PDMS-coated coverslips were generated by microcontact printing (11). The regions surrounding the patterns were rendered non-adhesive by incubating the coverslips in F127 pluronic (BASF) (18). MSCs were seeded onto the coverslips at a density of 20,000 cells/cm2. After an initial 24 hours in growth media, the cells were then cultured in either adipogenic or osteogenic media, or a 1:1 mixture of both for the subsequent 14 days unless otherwise indicated.
Staining
After 14 days, the cells were fixed in 3.7% paraformaldehyde and stained for alkaline phosphatase using Fast Blue RR Salt/naphthol (Sigma FBS25-10CAP, 855-20ML), lipid droplets with 3 mg/ml Oil Red O (Sigma O-0625) in 60% isopropanol, and nuclei with DAPI (Invitrogen D1306). To assay for differentiation after 5 days in culture, the transcription factors PPARγ and cbfa-1 were stained for. After triton extracting the soluble component and fixing with 3.7% paraformaldehyde, the samples were blocked overnight with 33% goat serum. The coverslips were then incubated in rabbit anti-PPARγ (Santa Cruz Biotechnology sc-7196) and rat anti-cbfa-1 (R&D Systems MAB2006) antibodies for one hour. After three PBS washes the coverslips were incubated in 488-goat anti-rabbit and 647-goat anti-rat (Molecular Probes A-11034, A-21247) secondary antibodies as well as DAPI. After three PBS washes, the coverslips were mounted.
Microscopy and analysis
An Eclipse TE-200 microscope (Nikon) with a 10x objective was used to capture images of alkaline phosphatase and Oil Red O-stained patterns. An Axiovert 200M microscope (Zeiss) with a 40x objective was used to capture fluorescence images of transcription factor-stained patterns. Because the patterns were larger than the 40x field of view, multiple images were captured and stitched to form a single image of the entire pattern.
Four concentric circles were drawn around the circular patterns to divide them into four zones of equal area. Cells that stained positive for Oil Red O or had PPARγ in their nuclei were scored as adipocytes, while cells that stained positive for alkaline phosphatase or had cbfa-1 in their nuclei were counted as osteogenic cells. Cells with neither stain were scored as undifferentiated. The cells were then counted and used to calculate the percentage of each cell type in each zone. Means were calculated from three experiments with at least three circles analyzed from each. Bar graphs show mean ± S.E.M. Statistical significance between means of different lineages within a zone or between means of the same cell type in two different zones was calculated using Student’s t test.
Measurement of traction forces
Traction forces were measured using microfabricated post array detectors as previously described (19). Briefly, mPADs were microcontact printed with fibronectin so that cells cultured on the devices spread and conformed to the printed patterns. The cells were cultured on mPADs in the presence of growth media for 24 hours before being fixed in 3.7% paraformaldehyde. Images of post tips and bases were captured using a Zeiss Axiovert XX microscope 40x objective, stitched to form the pattern, and used to calculate the post deflections and from that, the forces exerted on them by the cells. Statistical significance between force distributions was calculated by using the Wilcoxon rank-sum test.
3D structure generation and analysis
Molds were produced by pushing PDMS stamps with relief features, cast from photolithographically fabricated Su-8 templates, onto prepolymer PDMS in oxygen plasma-treated Petri dishes. After curing for two hours at 60 °C, the stamps were removed, leaving a mold with wells. Prior to cell seeding, the molds were immersed in F127 pluronic to render the PDMS non-adhesive. Prepolymer Type I Collagen was added to the molds at 4 °C. The molds were placed in a vacuum chamber to remove air bubbles trapped at the bottom of the well. MSCs were trypsinized, resuspended in gel precursor at a density of 2×10⁶ cells/ml, and then added to the molds. The molds were then centrifuged at 1200 rpm for 2.5 minutes to pool the cells into the wells. After aspirating the excess gel, the mold was exposed to a temperature of 37 °C to polymerize the collagen. 1% low melting point liquid agarose was added to the molds to encase the microgel structures. The agarose was gelled at 4 °C for one minute and fresh culture medium was added to the dishes.
Microgels were stained for alkaline phosphatase and lipid droplets as above, encased in OCT compound and snap frozen in liquid nitrogen. Cross-sections were taken using a Leica CM 1850 cryostat (Leica Microsystems) and imaged as above. A MATLAB program was written to analyze the images. First, the program created two binarized images, one red representing adipogenesis and one blue representing osteogenesis, from the original color image (supplemental Fig. 1). Next, 1-pixel ‘shells’ starting from the perimeter of the structure and terminating at its center were generated. Finally, each shell was compared against the two binarized color images to compute the percentage of red and blue pixels in the shell. The percentages were either plotted versus shell distance from the center (supplemental Fig. 2), or used to determine the percentage of fat and bone in four concentric zones of equal area. Means were calculated from three experiments with cross sections of at least three structures analyzed from each. Graphs show mean ± S.E.M. Statistical significance between means of different lineages within a zone or between means of the same cell type in two different zones was calculated using Student’s t test. Statistical significance between curves in supplemental Fig. 2 was calculated by applying the sign test to the paired experiments.
Results
Patterning of lineages occurs within multicellular aggregates
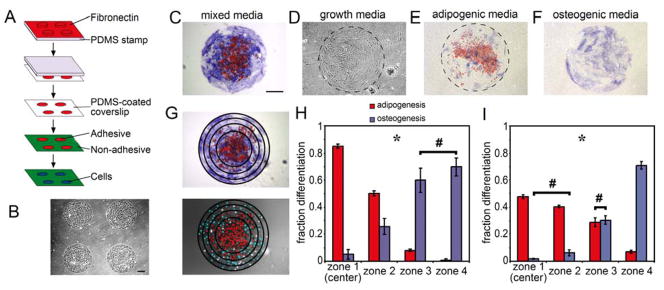
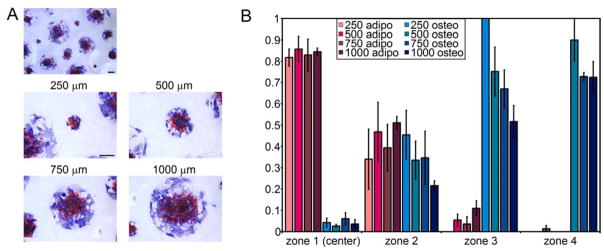
To produce monolayer sheets of human MSCs in a circular shape, we seeded cells onto substrates engineered with arrays of adhesive islands generated by microcontact printing fibronectin onto coverslips (Fig. 1A, B). After allowing cells to attach and form a sheet overnight, MSCs were exposed to a 1:1 mixture of adipogenic and osteogenic induction media, and after 14 days co-stained for lipid droplets to indicate adipogenesis and alkaline phosphatase to indicate osteogenesis. Cells within the interior of these circles contained lipid droplets (red), whereas those at the edge stained positively for alkaline phosphatase (blue) (Fig. 1C). This patterned segregation of lineages emerged in all sizes of circles examined (250 to 1000 um diameter, approx. 20 to 250 cells) (Fig. 2A), but did not occur in cells exposed to growth, adipogenic or osteogenic media alone (Fig. 1D–F). To quantify the distribution of lineages in these monolayers, we superimposed four concentric circles on each monolayer to divide it into four zones of equal area and counted the cells within each zone that were positive for each marker (Fig. 1G). In the innermost zone, more than 85% of the cells had lipid droplets and about 5% were alkaline phosphatase positive, whereas in the outermost zone, less than 1% were adipocytes and 70% exhibited an osteogenic phenotype (Fig. 1H). Interestingly, patterned differentiation appears to scale with size, where the relative radii at which cell fates segregate are proportional to the size of the circle (Fig. 2B).
Figure 1.
Patterned segregation of lineages occurs within multicellular aggregates. (A) Schematic showing substrate preparation by microcontact printing. (B) Phase image of MSCs on 1mm circular patterns at day 0. (C–F) 1mm circular MSC aggregates stained for fat droplets (red) and alkaline phosphatase (blue) after 14 days in mixed media (C), growth media (D), adipogenic media alone (E) or osteogenic media alone (F). (G) Concentric circles were placed over circular aggregates to divide them into four zones of equal area. Nuclei were labeled with DAPI to determine cell location. (H) Bar graph showing fraction of each cell type within each zone after 14 days in mixed media. (I) Bar graph showing fraction of each cell type within each zone determined by assaying for transcription factors after 5 days in mixed media. * indicates p<0.05 for all comparisons of the same cell type across different zones or different cell types within the same zone except for those marked with #. All Scale bars indicate 250 μm.
Figure 2.
Partitioning of differentiation scales with size (A) Circular MSC aggregates with diameters 250, 500, 750, and 1000 μm stained for oil droplets (red) and alkaline phosphatase (blue) after 14 days in mixed media. (B) Bar graphs show fraction of each cell type within each zone for circular aggregates of all four sizes. All scale bars indicate 250 μm.
While lipid accumulation is diagnostic for adipogenesis, alkaline phosphatase is not specific for osteogenesis. While detection of calcium deposition can be diagnostic for osteogenic differentiation, it was not possible in this setting because cells escape the constraints of patterning before calcium deposition is typically seen in these cells (> 21 days). As such, we confirmed our findings using two transcription factors for adipogenesis and osteogenesis – PPARγ and cbfa-1/runx2, respectively. PPARγ is expressed within days of addition of adipogenic media (20), and is a transcription factor that is required for adipogenesis (21), activating many of the genes necessary for fatty acid metabolism such as lipoprotein lipase and the fatty-acid binding protein aP2 (22). Cbfa-1/runx2 is similarly expressed at early time points during osteogenesis, and is a transcription factor essential for osteoblast differentiation (23, 24), inducing expression of bone matrix-generating genes such as osteopontin, osteocalcin, type I collagen (25, 26), and alkaline phosphatase (26, 27). Circular monolayers stained for these markers after only 5 days in culture demonstrated 47% of interior cells with PPARγ in the nucleus and 2% with nuclear cbfa-1/runx2 (Fig. 1I). In contrast, 8% of edge cells exhibited nuclear PPARγ whereas more than 73% were positive for cbfa-1/runx2. These results confirmed the partitioning of differentiation within these structures.
Aggregate geometry impacts patterning of differentiation
To assess the effect of monolayer geometry on the distribution of adipogenic and osteogenic lineages, MSCs were confined to different shapes. Squares, rectangles, ellipses, and half-ellipses all resulted in adipogenesis in the interior and osteogenesis at the edges, regardless of whether the edges were straight, cornered or curved (Fig. 3A–D). It was previously observed that the inner, concave edges of annuli exhibited low proliferation as compared to outer edges of solid patterns, suggesting that these inner edges may have different effects (16). Indeed, MSC monolayers cultured in such patterns exhibited osteogenesis at the outer edge and adipogenesis at the inner edge (Fig. 3E,F). It is unclear, however, if the edges imposed this distribution of differentiation because of their location, i.e. outer versus inner, or because they are concave. To address this ambiguity, we generated sinusoidal bands where the same edge oscillates between convex and concave. MSCs in these undulating shapes underwent osteogenesis at convex edges and adipogenesis at concave edges, regardless of the amplitude and thickness of the bands (Fig. 3G,H). These results show that the curvature of the edge as well as the overall shape of the monolayers likely contribute to spatial patterning of the differentiation.
Figure 3.
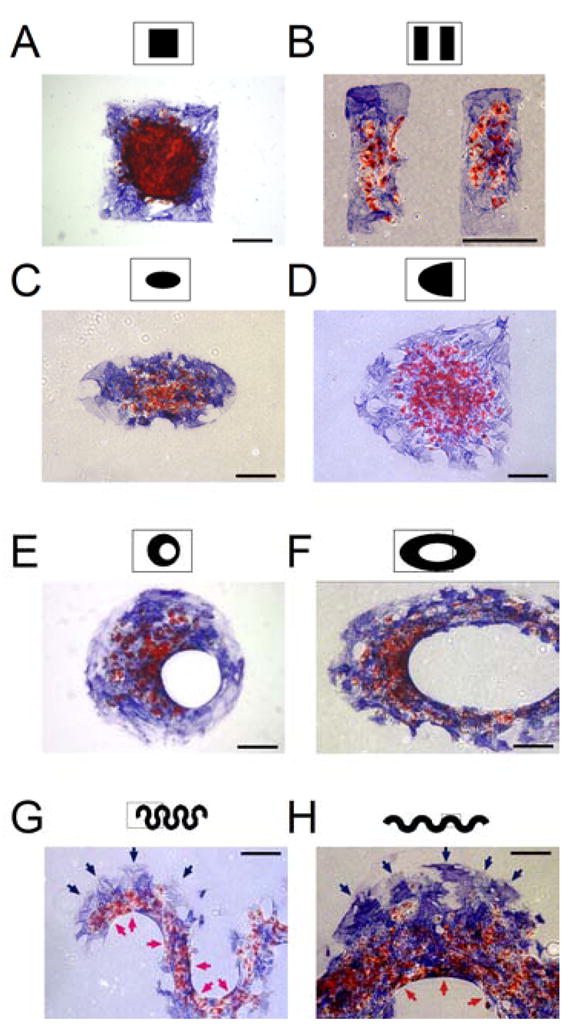
Geometry determines spatial patterning of differentiation. (A–H) MSC aggregates in the shape of a square (A), rectangles (B), an ellipse (C), a half-ellipse (D), an offset annulus (E), an elliptical annulus (F), and sinusoidal bands (G,H) stained for oil droplets (red) and alkaline phosphatase (blue) after 14 days in mixed media. Red arrows indicate adipogenesis at concave edges and blue arrows indicate osteogenesis at convex edges. All Scale bars indicate 250 μm.
Role of tension in patterning of differentiation
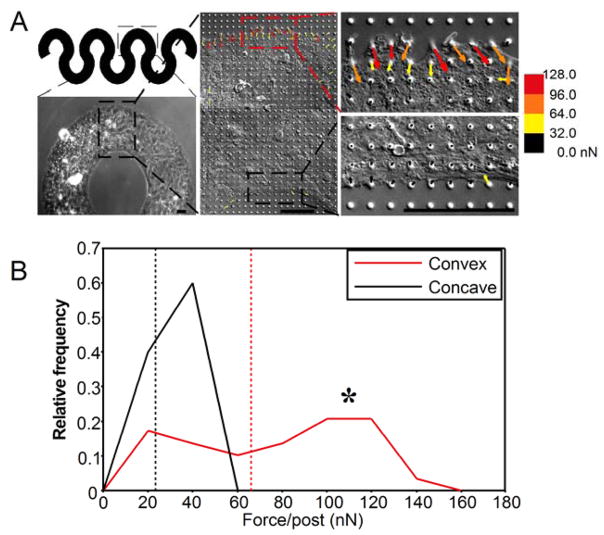
Myosin-generated cytoskeletal tension has been implicated in regulation of spatial patterning of a variety of responses such as proliferation and gastrulation (7, 16). To determine whether spatial differentials in cellular forces arise in our multicellular sheets, and whether such forces correlate to the observed patterns of MSC differentiation, we plated MSCs in sinusoidal monolayers onto microfabricated Post Array Detectors (mPADs) substrates, which consist of an array of elastomeric microneedles that report local traction forces (19) (Fig. 4A). Indeed, the magnitude of forces at the convex edge of the undulations were nearly three times those at the concave edge (66.3 versus 23.6 nN per post), and mirrored the pattern of osteogenic versus adipogenic differentiation. Plotting the distribution of forces at convex edges revealed a peak at 110 nN, as compared to 40 nN at concave edges (Fig. 4B). Thus, the geometry of the multicellular structure can give rise to local gradients of mechanical forces.
Figure 4.
Geometry determines spatial distribution of cytoskeletal tension. (A) Phase images of MSCs on mPADs in the shape of a sinusoidal band. Middle panel shows a traction force vector map superimposed on the image. Right two panels show close-ups of the convex and concave edges. Scale bars are 50 μm. (B) Frequency distribution of forces along the convex and concave edge. * indicates p<0.05. Dashed lines show means.
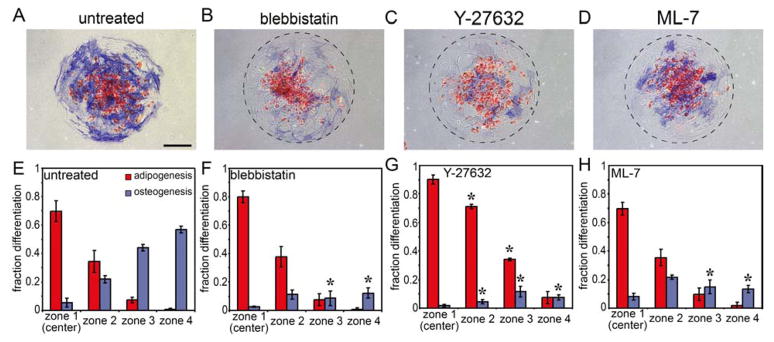
To test whether the high tension generated at convex edges is responsible for increased osteogenesis at those edges, we treated MSCs in such patterns with the non-muscle myosin II inhibitor, blebbistatin. Inhibiting myosin-generated tension abrogated osteogenesis almost completely, while preserving adipogenesis (Fig. 5A,B,E,F). Given possible nonspecific effects of the inhibitor, we confirmed that inhibition of the upstream regulators of myosin, ROCK (Rho-kinase) with Y27632 and MLCK (Myosin Light Chain Kinase) with ML-7, also resulted in specific suppression of osteogenesis (Fig. 5C,D,G,H). These results suggest that localized patterns of cytoskeletal tension within these multicellular sheets trigger patterns of differentiation to different lineages.
Figure 5.
Cytoskeletal tension is necessary for patterned differentiation. (A–D) Circular MSC aggregates stained for oil droplets (red) and alkaline phosphatase (blue) after 14 days in mixed media without inhibitor (A) or in the presence of 50 μM blebbistatin (B), 10 μM Y-27632 (C) or 10 μM ML-7 (D). (E–H) Bar graphs showing fraction of each cell type within each zone. * indicates p<0.05 when compared to corresponding mean in the untreated condition (E). Scale bar indicates 250 μm.
Patterning of differentiation in 3D structures
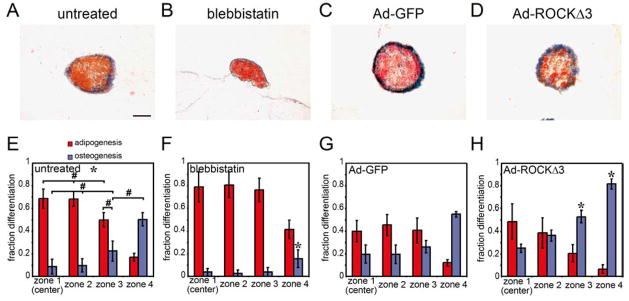
The patterning of differentiation we have observed may arise as a specific response to the micropatterned, flat substrates, and may not represent what occurs when cells are embedded within 3-dimensional contexts. To determine whether patterned differentiation can occur in three-dimensional matrix, we developed a method to construct three-dimensional, multicellular structures of MSCs. PDMS molds produced from photolithographically-fabricated templates with wells of controlled dimensions were used to create MSC-laden collagen constructs of defined three-dimensional geometries (Fig. 6A). MSCs suspended in unpolymerized collagen type I were pooled into the wells by centrifugation, and excess collagen was removed before polymerization. The resulting constructs were then released and encased in agarose to allow culture without diffusion barriers. These three-dimensional structures can be peeled out of the template while retaining their integrity (Fig. 6B). After 14 days in mixed media, cells at the edge of the constructs differentiated to an osteogenic lineage (as indicated by alkaline phosphatase staining) while those at the center underwent adipogenesis (as indicated by lipid droplet staining) (Fig. 6C). To confirm that patterning of differentiation occurred throughout the structures, they were sectioned and imaged (Fig. 6D,E). To quantify the distribution of lineages in these structures, the spatial distribution of red and blue pixels within their cross sections was determined (supplemental Fig. 1). In the innermost zone, MSCs predominantly underwent adipogenesis, whereas cells switched to osteogenic fate in the outermost zone (Fig. 7A,E). While endogenous forces could not be measured within these structures, we examined whether up- or downregulating cytoskeletal tension altered the patterns of differentiation. Constructs treated with blebbistatin decreased osteogenesis, mimicking our findings on flat substrates (Fig. 7B,F, supplemental Fig. 2A). Expressing ROCKΔ3, a mutant form of ROCK that is constitutively active and results in high myosin activity, resulted in a thicker layer of osteogenesis at the edge of the structures (Fig. 7C,D,G,H, supplemental Fig. 2B). These results demonstrate patterned partitioning of lineage specification also occurs in three-dimensional matrices in a tension-dependent manner.
Figure 6.
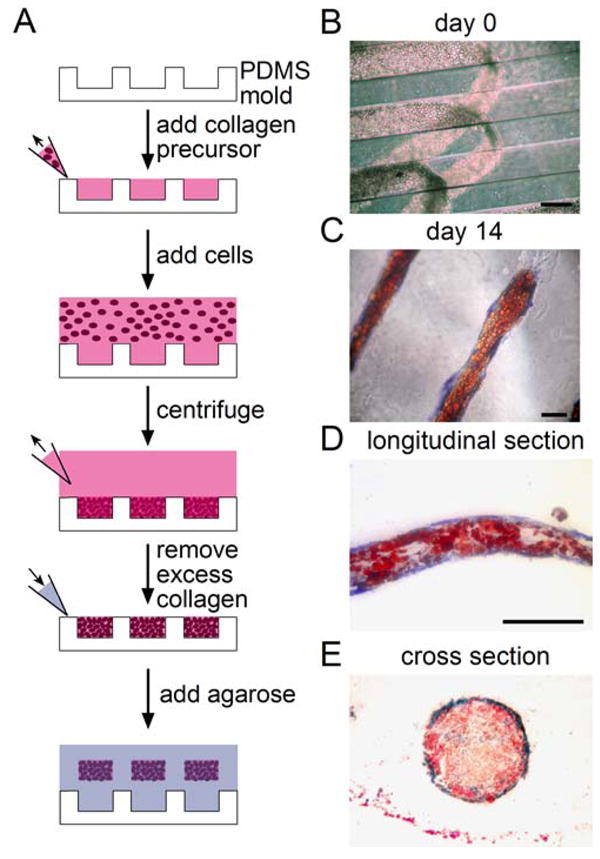
3D multicellular structures undergo partitioning of differentiation. (A) Schematic showing method to create three-dimensional multicellular structures of MSCs. (B) Phase image of MSCs in three-dimensional structures at day 0. (C) Phase image of a three-dimensional MSC structure stained for oil droplets (red) and alkaline phosphatase (blue) after 14 days in mixed media. (D,E) Longitudinal and cross sections of MSC multicellular structures. All scale bars indicate 250 μm.
Figure 7.
3D multicellular structures undergo partitioning of differentiation that can be modulated by cytoskeletal tension. (A,B) Cross sections of 3D MSC structures stained for oil droplets (red) and alkaline phosphatase (blue) after 14 days in mixed media in the absence or presence of 50 μM blebbistatin. (C,D) Cross sections of 3D MSC structures produced with either GFP or ROCKΔ3-infected cells stained for oil droplets (red) and alkaline phosphatase (blue) after 14 days in mixed media. (E–H) Bar graphs showing fraction of each cell type within each zone. In (E), * indicates p<0.05 for all comparisons of the same cell type across different zones or different cell types within the same zone except for those marked with #. In (F) and (H), * indicates p<0.05 when compared to corresponding mean in their respective controls ((E) and (G)). Scale bar indicates 100 μm.
Discussion
During morphogenesis, cells execute massive structural changes that lead to new tissue forms, while simultaneously differentiating to populate those structures. In the adult, cells reside in specific locations within multicellular structures and are subjected to a wide variety of stresses such as shear, stretch, tension, and compression. The findings presented here suggest a direct link between multicellular form, stress distributions, and lineage fate of differentiating stem cells. This link may restrict the differentiation potential of stem cells to specific lineage fates as a function of position within a structure. It is interesting that in our 3D cylinders, MSCs form a hollow shaft of bone with a core of fat, not unlike the anatomy universal to all vertebrate long bones (28). Such hardwiring between tissue form and fate may provide a key mechanism to prevent spurious fate decisions and therefore coordinate tissue development in a variety of settings. For example, geometric factors present in the bone microenvironment could regulate the balance of adipogenic and osteogenic differentiation critical to bone homeostasis. The loss of trabecular bone in osteoporosis may not only be a primary defect in the disease, but also could feed back to alter the balance of ‘convex’ and ‘concave’ surfaces where differential forces exist, thereby further exacerbating any population imbalances. Whether such geometric disturbances actually contribute to such diseases remains to be explored. Furthermore, in the context of engineering tissues for regenerative medicine, such constraints may limit our ability to generate differentiated tissues with arbitrary shapes.
Our findings also indicate that mechanical forces generated by contractile activity of cells provide the patterning cues that couples form to fate decisions. The existence of such cytoskeletal forces has been implicated in numerous developmental processes such as germ band elongation, primary invagination, and neural convergent extension (29–31). Cytoskeletal tension had previously been shown to result in mechanical loading of three-dimensional matrices (32), which can feed back to modulate cell behavior, such as differentiation of fibroblasts into myofibroblasts (33). Here, we demonstrated that gradients of stress are generated simply by the existence of tissue geometry, even when massive rearrangements are not occurring, and therefore should be considered as a potential candidate for driving patterns in cell function. Importantly, though such force gradients appear to be omnipresent in the experimental system presented here, likely as a result of basal contractility of MSCs, our studies also suggest that form and fate could be decoupled or engaged to a different extent through genetic or environmental regulation of cellular contractile activity, and that such manipulations can be exploited in tissue engineering. While our studies implicate force as one factor that can be patterned by multicellular form, others have reported localized gradients in soluble morphogens also patterned by multicellular structures (34–36). Together, gradients in forces and morphogens, then, likely provide the key links that orchestrate the shape changes that occur during morphogenesis, and the coordinate spatial differentials in cell differentiation. Understanding how fate decisions are tied to tissue form will provide a better appreciation of how cells orchestrate morphogenetic processes as well as a roadmap for directing stem cell fates in regenerative therapies.
Supplementary Material
Acknowledgments
We thank Y. Wang for technical assistance, and S. Raghavan, R. Desai, Y. Wang, D. Cohen, and E. Issa for helpful discussions. This work was supported in part by grants from the National Institutes of Health (EB00262, HL73305, GM74048), the Army Research Office Multidisciplinary University Research Initiative, and the Penn Center for Musculoskeletal Disorders.
Footnotes
The authors indicate no potential conflicts of interest.
Author contributions: Sami Alom Ruiz: Conception and design, administrative support, provision of study materials, collection and assembly of data, data analysis and interpretation, and manuscript writing.
Christopher S. Chen: Conception and design, financial support, administrative support, provision of study materials, data analysis and interpretation, manuscript writing, and final approval of manuscript.
References
- 1.Salazar-Ciudad I, Jernvall J, Newman SA. Mechanisms of pattern formation in development and evolution. Development. 2003;130:2027–2037. doi: 10.1242/dev.00425. [DOI] [PubMed] [Google Scholar]
- 2.Keller R. Shaping the vertebrate body plan by polarized embryonic cell movements. Science. 2002;298:1950–1954. doi: 10.1126/science.1079478. [DOI] [PubMed] [Google Scholar]
- 3.Johnson RL, Tabin CJ. Molecular models for vertebrate limb development. Cell. 1997;90:979–990. doi: 10.1016/s0092-8674(00)80364-5. [DOI] [PubMed] [Google Scholar]
- 4.Nilsson O, Parker EA, Hegde A, et al. Gradients in bone morphogenetic protein-related gene expression across the growth plate. Journal of Endocrinology. 2007;193:75–84. doi: 10.1677/joe.1.07099. [DOI] [PubMed] [Google Scholar]
- 5.Stoykova A, Treichel D, Hallonet M, et al. Pax6 modulates the dorsoventral patterning of the mammalian telencephalon. Journal of Neuroscience. 2000;20:8042–8050. doi: 10.1523/JNEUROSCI.20-21-08042.2000. [DOI] [PMC free article] [PubMed] [Google Scholar]
- 6.Nemer G, Nemer M. Regulation of heart development and function through combinatorial interactions of transcription factors. Annals of Medicine. 2001;33:604–610. doi: 10.3109/07853890109002106. [DOI] [PubMed] [Google Scholar]
- 7.Keller R, Davidson LA, Shook DR. How we are shaped: The biomechanics of gastrulation. Differentiation. 2003;71:171–205. doi: 10.1046/j.1432-0436.2003.710301.x. [DOI] [PubMed] [Google Scholar]
- 8.Kiehart DP, Galbraith CG, Edwards KA, et al. Multiple forces contribute to cell sheet morphogenesis for dorsal closure in Drosophila. Journal of Cell Biology. 2000;149:471–490. doi: 10.1083/jcb.149.2.471. [DOI] [PMC free article] [PubMed] [Google Scholar]
- 9.Brouzes E, Farge E. Interplay of mechanical deformation and patterned gene expression in developing embryos. Current Opinion in Genetics & Development. 2004;14:367–374. doi: 10.1016/j.gde.2004.06.005. [DOI] [PubMed] [Google Scholar]
- 10.Farge E. Mechanical induction of twist in the Drosophila foregut/stomodeal primordium. Current Biology. 2003;13:1365–1377. doi: 10.1016/s0960-9822(03)00576-1. [DOI] [PubMed] [Google Scholar]
- 11.McBeath R, Pirone DM, Nelson CM, et al. Cell shape, cytoskeletal tension, and RhoA regulate stem cell lineage commitment. Developmental Cell. 2004;6:483–495. doi: 10.1016/s1534-5807(04)00075-9. [DOI] [PubMed] [Google Scholar]
- 12.Engler AJ, Sen S, Sweeney HL, et al. Matrix elasticity directs stem cell lineage specification. Cell. 2006;126:677–689. doi: 10.1016/j.cell.2006.06.044. [DOI] [PubMed] [Google Scholar]
- 13.Kurpinski K, Chu J, Hashi C, et al. Anisotropic mechanosensing by mesenchymal stem cells. Proceedings of the National Academy of Sciences of the United States of America. 2006;103:16095–16100. doi: 10.1073/pnas.0604182103. [DOI] [PMC free article] [PubMed] [Google Scholar]
- 14.Yamamoto K, Sokabe T, Watabe T, et al. Fluid shear stress induces differentiation of Flk-1-positive embryonic stem cells into vascular endothelial cells in vitro. American Journal of Physiology-Heart and Circulatory Physiology. 2005;288:H1915–H1924. doi: 10.1152/ajpheart.00956.2004. [DOI] [PubMed] [Google Scholar]
- 15.Schmelter M, Ateghang B, Helmig S, et al. Embryonic stem cells utilize reactive oxygen species as transducers of mechanical strain-induced cardiovascular differentiation. Faseb Journal. 2006;20:1182-+. doi: 10.1096/fj.05-4723fje. [DOI] [PubMed] [Google Scholar]
- 16.Nelson CM, Jean RP, Tan JL, et al. Emergent patterns of growth controlled by multicellular form and mechanics. Proceedings of the National Academy of Sciences of the United States of America. 2005;102:11594–11599. doi: 10.1073/pnas.0502575102. [DOI] [PMC free article] [PubMed] [Google Scholar]
- 17.Pirone DM, Liu WF, Ruiz SA, et al. An inhibitory role for FAK in regulating proliferation: a link between limited adhesion and RhoA-ROCK signaling. Journal of Cell Biology. 2006;174:277–288. doi: 10.1083/jcb.200510062. [DOI] [PMC free article] [PubMed] [Google Scholar]
- 18.Tan JL, Liu W, Nelson CM, et al. Simple approach to micropattern cells on common culture substrates by tuning substrate wettability. Tissue Engineering. 2004;10:865–872. doi: 10.1089/1076327041348365. [DOI] [PubMed] [Google Scholar]
- 19.Tan JL, Tien J, Pirone DM, et al. Cells lying on a bed of microneedles: An approach to isolate mechanical force. Proceedings of the National Academy of Sciences of the United States of America. 2003;100:1484–1489. doi: 10.1073/pnas.0235407100. [DOI] [PMC free article] [PubMed] [Google Scholar]
- 20.Sekiya I, Larson BL, Vuoristo JT, et al. Adipogenic differentiation of human adult stem cells from bone marrow stroma (MSCs) Journal of Bone and Mineral Research. 2004;19:256–264. doi: 10.1359/JBMR.0301220. [DOI] [PubMed] [Google Scholar]
- 21.Rosen ED, Sarraf P, Troy AE, et al. PPAR gamma is required for the differentiation of adipose tissue in vivo and in vitro. Molecular Cell. 1999;4:611–617. doi: 10.1016/s1097-2765(00)80211-7. [DOI] [PubMed] [Google Scholar]
- 22.Spiegelman BM. PPAR-gamma: Adipogenic regulator and thiazolidinedione receptor. Diabetes. 1998;47:507–514. doi: 10.2337/diabetes.47.4.507. [DOI] [PubMed] [Google Scholar]
- 23.Komori T, Yagi H, Nomura S, et al. Targeted disruption of Cbfa1 results in a complete lack of bone formation owing to maturational arrest of osteoblasts. Cell. 1997;89:755–764. doi: 10.1016/s0092-8674(00)80258-5. [DOI] [PubMed] [Google Scholar]
- 24.Komori T, Kishimoto T. Cbfa1 in bone development. Curr Opin Genet Dev. 1998;8:494–9. doi: 10.1016/s0959-437x(98)80123-8. [DOI] [PubMed] [Google Scholar]
- 25.Komori T. Requisite roles of Runx2 and Cbfb in skeletal development. Journal of Bone and Mineral Metabolism. 2003;21:193–197. doi: 10.1007/s00774-002-0408-0. [DOI] [PubMed] [Google Scholar]
- 26.Byers BA, Garcia AJ. Exogenous Runx2 expression enhances in vitro osteoblastic differentiation and mineralization in primary bone marrow stromal cells. Tissue Engineering. 2004;10:1623–1632. doi: 10.1089/ten.2004.10.1623. [DOI] [PubMed] [Google Scholar]
- 27.Kojima H, Uemura T. Strong and rapid induction of osteoblast differentiation by Cbfa1/Til-1 overexpression for bone regeneration. J Biol Chem. 2005;280:2944–53. doi: 10.1074/jbc.M311598200. [DOI] [PubMed] [Google Scholar]
- 28.Wilson FJ. Histology image review. New York: McGraw Hill-Companies; 1997. [Google Scholar]
- 29.Bertet C, Sulak L, Lecuit T. Myosin-dependent junction remodelling controls planar cell intercalation and axis elongation. Nature. 2004;429:667–671. doi: 10.1038/nature02590. [DOI] [PubMed] [Google Scholar]
- 30.Davidson LA, Koehl MAR, Keller R, et al. How Do Sea-Urchins Invaginate - Using Biomechanics to Distinguish between Mechanisms of Primary Invagination. Development. 1995;121:2005–2018. doi: 10.1242/dev.121.7.2005. [DOI] [PubMed] [Google Scholar]
- 31.Elul T, Koehl MAR, Keller R. Cellular mechanism underlying neural convergent extension in Xenopus laevis embryos. Developmental Biology. 1997;191:243–258. doi: 10.1006/dbio.1997.8711. [DOI] [PubMed] [Google Scholar]
- 32.Grinnell F. Fibroblast biology in three-dimensional collagen matrices. Trends in Cell Biology. 2003;13:264–269. doi: 10.1016/s0962-8924(03)00057-6. [DOI] [PubMed] [Google Scholar]
- 33.Vaughan MB, Howard EW, Tomasek JJ. Transforming growth factor-beta 1 promotes the morphological and functional differentiation of the myofibroblast. Experimental Cell Research. 2000;257:180–189. doi: 10.1006/excr.2000.4869. [DOI] [PubMed] [Google Scholar]
- 34.Ruhrberg C, Gerhardt H, Golding M, et al. Spatially restricted patterning cues provided by heparin-binding VEGF-A control blood vessel branching morphogenesis. Genes & Development. 2002;16:2684–2698. doi: 10.1101/gad.242002. [DOI] [PMC free article] [PubMed] [Google Scholar]
- 35.Metzger RJ, Krasnow MA. Development - Genetic control of branching morphogenesis. Science. 1999;284:1635–1639. doi: 10.1126/science.284.5420.1635. [DOI] [PubMed] [Google Scholar]
- 36.Nelson CM, VanDuijn MM, Inman JL, et al. Tissue geometry determines sites of mammary branching morphogenesis in organotypic cultures. Science. 2006;314:298–300. doi: 10.1126/science.1131000. [DOI] [PMC free article] [PubMed] [Google Scholar]
Associated Data
This section collects any data citations, data availability statements, or supplementary materials included in this article.


