SYNOPSIS
Objective
We examined the financial and social costs resulting from traumatic brain injury (TBI) in Missouri.
Methods
We computed mortality rates from death certificates, the direct cost of TBI from hospital and emergency department (ED) visit charges, the social cost in terms of years of potential life lost (YPLL) using an abridged Missouri life table, and the indirect financial cost in terms of lost productivity due to premature death for all TBI and four major causes of TBI in Missouri.
Results
During 2001–2005, a mean of 1,358 lives were lost due to TBI in Missouri. Four major causes—unintentional falls, motor vehicle traffic crashes, motorcycle crashes, and firearms—accounted for 88% of all TBI deaths. We estimated the annual direct medical cost of TBI at $95 million, or about $1.67 million per 100,000 Missourians. This cost increased by about 60% between 2001 and 2005. The four major causes of TBI accounted for 68% of all direct medical costs of TBI. We estimated the cost per hospitalization and ED visit at $6,948 and the indirect social cost at 48,501 YPLL. During this period, the mean age of TBI fatality was 44 years. We determined the lost productivity due to TBI mortality—$1.1 billion, or about $18.8 million per 100,000 Missourians—to be three times as high for males as for females.
Conclusions
The types of costs covered in this study underestimated the total cost of TBI in Missouri, as we did not include outpatient care, rehabilitation, and drug costs. Nevertheless, we found the health and economic burden from medical care and mortality related to TBI to be substantial in Missouri.
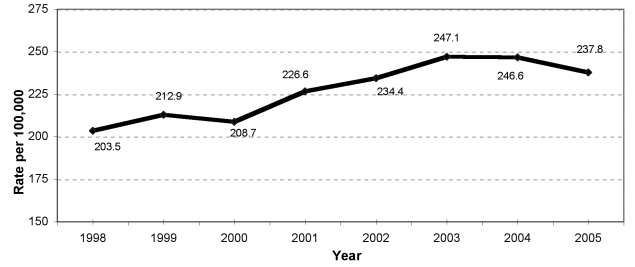
Traumatic brain injury (TBI) is an insult to the brain that can result in impairments and disabilities, often leading to considerable loss of independence, productivity, and income potential. Missouri has seen a troubling increase of 17% in combined emergency department (ED) visits and hospitalizations related to TBI (from 203.5 per 100,000 in 1998 to 237.8 per 100,000 in 2005) (Figure 1). In Missouri, TBI accounted for 2.3% of all injuries annually from 2001 to 2005.1 However, these numbers likely underestimate the true picture, as they do not include an estimate of the number of people who experienced a TBI and sought other or no medical care.
Figure 1.
Traumatic brain injury rate for emergency department visits and hospitalizations for Missouri residents, 1998–2005a
aAge-adjusted rate using U.S. 2000 standard population.
Although all types of falls were the most common cause of TBI, for this analysis we included the mortality and indirect costs for only unintentional falls to ascertain easily preventable types of injuries in this category. The second most common cause of TBI—motor vehicle traffic crashes—includes injuries to pedestrians, bicyclists, and occupants of cars, trucks, and other vehicles, excluding motorcycle-related TBI. We made this a third category because it is an important safety legislation issue. The fourth category included all types of firearms-related TBI.
Several components of costs are associated with TBI. A person might recover fully from TBI, he or she might become partially or completely disabled, or the TBI might result in death. If a person with TBI recovers from the injury and is sent home, there are short-term costs due to ED visits, costs for follow-up visits to physicians or hospital charges (e.g., direct costs), and lost earnings (e.g., indirect costs). If the person becomes partially or fully disabled, there are additional long-term costs due to acute, skilled nursing or intermediate care, rehabilitation, or hospice. In the case of death, there are two major types of costs: (1) years of potential life lost (YPLL), which is the social cost, and (2) productivity loss, which is the indirect economic cost.
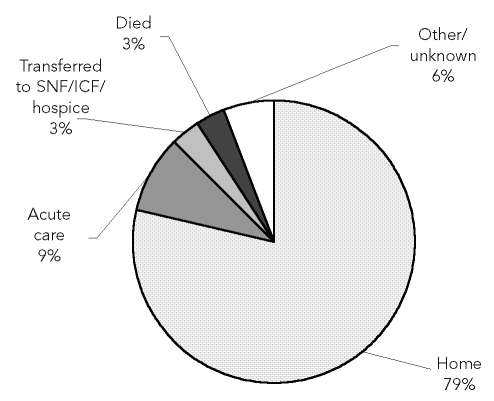
The disposition of TBI patients in Missouri during 2001–2005 is presented in Figure 2. TBI creates a significant public health burden, both nationally and within the state of Missouri, when the number of events, short- and long-term consequences, and costs are considered.
Figure 2.
Dispositions of traumatic brain injury patients from hospitalizations and emergency department visits in Missouri, 2001–2005
SNF = skilled nursing facility
ICF = intermediate care facility
Despite the known burden due to TBI, the actual social and economic costs associated with TBI are largely unknown in Missouri. This insufficient information limits total comprehension of the magnitude of the TBI problem in Missouri and, thus, hinders public health actions to prevent TBI. This study sought to estimate the direct financial and social costs resulting from TBI in Missouri.
The types of costs covered in this study underestimated the total cost of TBI, as we did not include outpatient care, rehabilitation, and drug costs. Because we assessed the overall impact of TBI in Missouri, we did not use the classification of TBI by severity (severe, moderate, mild, and fatal). A 2001 study by Kreutzer et al. used a different classification to assess the cost of TBI. In that classification, they estimated the cost of acute and rehabilitation care associated with TBI.2
METHODS
This study used the macro (i.e., aggregate numbers) approach rather than the traditional micro (i.e., individual case/visit) approach to assess the overall burden of the injury. We presented all TBIs in the four major causes: motor vehicle traffic crashes, firearms, unintentional falls, and motorcycle crashes. We considered motorcycle crashes a separate category due to the safety issue related to helmet laws and the great potential to prevent TBI caused by motorcycle crashes in Missouri. TBI related to unintentional falls was another major issue due to increased occurrences among younger and older Missourians. We excluded other types of falls because we wanted to focus on understanding preventable types of falls.
Data sources
We obtained TBI-related hospitalization and ED visit charges from the Missouri Patient Abstract System (PAS).1 We included only ED visits and hospitalizations with TBI as the primary diagnosis. PAS, which is managed by the Missouri Department of Health and Senior Services (DHSS), contains data from all of the 135 acute care hospitals in Missouri directly or through the Missouri Hospital Association. This system uses the International Classification of Diseases, Ninth Revision, Clinical Modification (ICD-9-CM) diagnostic codes to define different mechanisms and causes of TBI.3 For this study, we combined data from 2001 through 2005 to estimate annual mean inpatient hospitalization and ED visit charges.
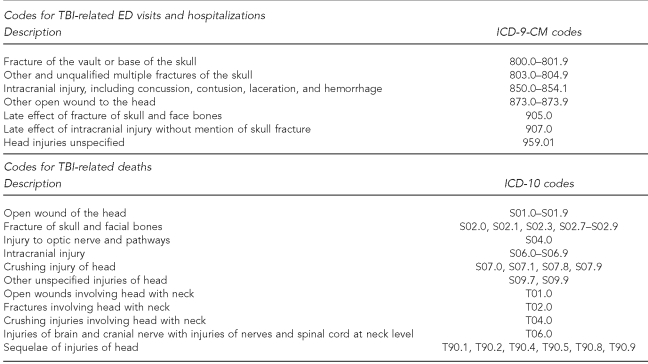
We used Missouri death certificates/records for the years 2001–2005 to obtain mortality data.4 Death certificates use the ICD, 10th Revision (ICD-10) codes to define the different mechanisms and causes of TBI. The ICD-9-CM and ICD-10 codes used in this study are listed in Figure 3; the first set of codes classifies the cause and mechanism of injury, while the second set specifies the cause of death.5
Figure 3.
ICD-9-CM codes for TBI-related ED visits and hospitalizations and ICD-10 codes for deaths
ICD-9-CM = International Classification of Diseases, Ninth Revision, Clinical Modification
TBI = traumatic brain injury
ED = emergency department
ICD-10 = International Classification of Diseases, 10th Revision
Data analysis
To calculate the direct cost associated with TBI, we used hospital and ED visit charges. We expected these charges to be paid by insurance companies and/or patients. Because of market imperfection in the health-care industry, the charges do not represent the true economic cost of the products and care services.6 A cost-to-charge ratio is used by Medicare and third-party payers to reimburse the hospitals and health-care providers. We used a cost-to-charge ratio of 0.442 for Missouri to estimate the direct cost of TBI.7,8
Because the study covered a five-year span, we determined that inflation would influence the direct medical charges in the medical care industry. We used the Consumer Price Index (CPI) for Medical Care for All Urban Consumers, 2001–2005, in the Midwest region (using 2001 as the base year) to adjust these annual charges for inflation.9
We computed the social cost (i.e., YPLL) and the indirect cost (i.e., lost productivity) to measure the cost of premature deaths related to TBI. We computed YPLL by counting the remaining years of expected life based on the abridged life table from the Missouri Vital Statistics. The changes in abridged life tables for the years 2001–2005 were minimal; hence, we used the 2003 (midpoint) abridged life table values to compute the YPLL.10
We estimated the productivity losses due to TBI-related deaths with the annual mean mortality for the years 2001–2005.4 Because the Missouri-specific estimates of present discounted value of future earnings (PDVFE) were unavailable, we used the national estimates for 2000. This method takes into account the life expectancy for different gender and age groups, the percentage of people in the labor force or housekeeping, the current pattern of earnings at successive ages, an imputed value of household production, and the discount rate.11 We computed the PDVFE for Missouri using a 3% discount rate by age and gender.Numbers and data by case rather than visits were not available because of the possibility of identifying individual patients. Because we sought to estimate the total burden/cost, this factor did not affect the total cost estimates. However, the per-visit cost estimate was an underestimation of the cost per case.
The Institutional Review Board at the Missouri DHSS reviewed this study protocol and determined it to be exempt.
RESULTS
Of the four major causes of TBI, unintentional falls caused the greatest number of TBI hospitalizations and ED visits, but motor vehicle traffic accidents caused the highest mortality rate. Motor vehicle traffic accidents resulted in (1) the highest number of ED visits and hospitalization direct costs (followed by unintentional falls), (2) the highest YPLL and productivity losses, and (3) the youngest mean age (36) at death from TBI. Conversely, unintentional falls resulted in the oldest mean age (66) at death from TBI (Table 1).
Table 1.
Summary statistics for TBI by major causes in Missouri, 2001–2005
aRate per 100,000 population
TBI = traumatic brain injury
Mortality
During 2001–2005, TBI was the underlying cause of 1,358 deaths annually in Missouri. Four major causes accounted for 89% of all TBI deaths: motor vehicle traffic crashes (39%), firearms (32%), unintentional falls (15%), and motorcycle crashes (3%). All other causes accounted for about 11% of TBI deaths. We determined the TBI death rate to be 23.8 per 100,000 Missouri population, a rate that was almost three times as high in males (35.3) as in females (12.8). Among the four major causes, motor vehicle traffic crashes led to the highest TBI-related death rate (9.2), followed by firearms (7.6), unintentional falls (3.6), and motorcycle crashes (0.6). Males had higher rates of TBI-related deaths than females at all age levels. The gender disparity in TBI-related death was highest in motorcycle crashes and lowest in unintentional falls (Table 2).
Table 2.
Annual ratea of deaths resulting from TBI by age and cause: Missouri, 2001–2005
aRate per 100,000 population
TBI = traumatic brain injury
Those ≥80 years of age had the highest overall TBI mortality, as well as the highest TBI mortality from unintentional falls for both genders. Males between the ages of 20 and 29 years had the highest number of motor vehicle traffic crash-related TBI deaths, and females aged 10–19 years had the highest rates. Firearms-related TBI deaths were highest for males ≥80 years of age, and for females the highest rate was for those aged 40–49 years. Males between the ages of 20 and 29 and females aged 30–39 had the highest TBI death rates due to motorcycle crashes (Table 2).
Direct cost
During 2001–2005, there were 20,688 inpatient hospitalizations (an annual mean of 4,138 hospitalizations, or 70.8 per 100,000) and 47,428 ED visits (an annual mean of 9,486 ED visits) related to TBI in Missouri. We estimated the associated annual direct cost to be nearly $95 million in total, or $1.67 million per 100,000 population. The four major causes of TBI accounted for 68% of all direct medical costs of TBI: motor vehicle traffic crashes (33%), unintentional falls (30%), motorcycle crashes (3%), and firearms (2%). Even after adjusting for inflation, the cost of TBI ED visits and hospitalizations increased 59.4%, from $69.8 million in 2001 to $111.3 million in 2005. We estimated each Missouri resident's direct costs during 2001–2005 at $17 annually (data not shown).
YPLL
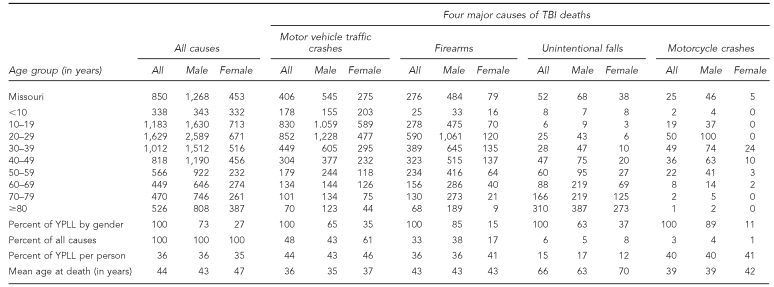
For the period 2001–2005, we determined the estimated annual YPLL due to mortality from TBI as 48,501. The four major causes of TBI caused 90% of total YPLL due to TBI mortality. Table 3 shows the estimated annual YPLL by the four major causes and the breakdown by gender. TBI from motor vehicle traffic crashes caused the highest YPLL, followed by TBI from firearms, unintentional falls, and motorcycle crashes. Males' YPLL accounted for 73% (35,238), whereas females' YPLL accounted for 27% (13,263) of the total YPLL. We estimated a mean loss of 36 YPLL per TBI-related death during 2001–2005.
Table 3.
Annual ratea of YPLL due to mortality resulting from TBI, by age and cause: Missouri, 2001–2005b
aRate per 100,000 population
bWe used the Abridged Life Table for Missouri for 2003 to compute mean number of years of life remaining.
YPLL = years of potential life lost
TBI = traumatic brain injury
Also during this period, we estimated the mean age of TBI fatality as 44 years. However, this mean age varied by cause of TBI, with people dying at a younger age (age 36) due to motor vehicle traffic crashes and an older age (66 years) due to unintentional falls. The mean age at death due to firearms was 43 years; the mean age at death due to motorcycle crashes was 39 years (Table 3).
Productivity losses
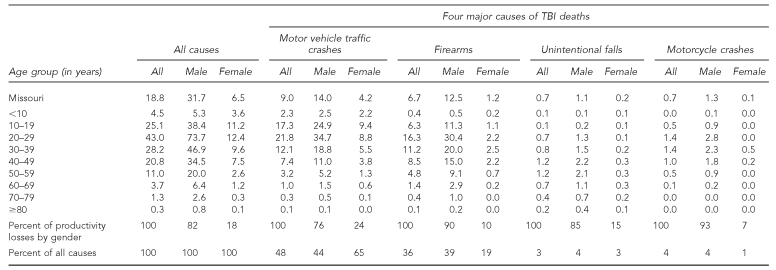
We estimated the total productivity loss due to TBI-related deaths at almost $1.1 billion annually in Missouri. We estimated the rate of productivity loss at $18.8 million per 100,000 Missouri residents ($188 per person), with a three times higher rate for males ($31.7 million) than for females ($6.5 million) (Table 4). Motor vehicle crash-related productivity loss was the highest at $513 million, followed by firearms ($383 million), unintentional falls ($38 million), and motorcycle crashes ($37 million). Table 4 also shows estimated annual productivity loss by the four major causes and by gender.
Table 4.
Annual ratea of productivity losses (in millions of dollars) due to TBI-related deaths by age, gender, and major cause: Missouri, 2001–2005b
aRate per 100,000 population
bWe used the present discounted value of future earnings by age and gender at a 3% discount rate to calculate the productivity losses from TBI. See: Missouri Department of Health and Senior Services. Missouri information for community assessment: death MICA, 2001–2004 [cited 2005 Dec 1]. Available from: URL: http://www.dhss.mo.gov/DeathMICA/index.html
TBI = traumatic brain injury
Of the total, males accounted for about 82% of the productivity loss and females accounted for 18%. We observed a similar pattern by gender by the four major causes of TBI: the rate of productivity loss due to motor vehicle crashes was $9 million per 100,000 Missouri residents, followed by firearms ($6.7 million); unintentional falls and motorcycle crashes each caused $0.7 million in productivity loss (Table 4).
DISCUSSION
Our study found that TBI imposes a heavy social and economic burden on Missouri residents, including more than 1,300 lives lost, more than $1.2 billion in direct ED visit and hospitalization costs and indirect costs due to lost productivity, and nearly 50,000 YPLL. To the best of our knowledge, this is the first study to evaluate the health and economic burden of TBI for an entire state. Our study also identified groups at high risk for TBI with respect to age, gender, and the four major causes of TBI-related deaths. This information is useful to public health authorities for directing resources to prevent the major causes of TBI that result in high human and financial losses.
During 2001–2005, in terms of the level of severity, moderately serious TBI accounted for 56% of the total injuries, followed by the most serious injuries (40%) and the least serious injuries (3%). We determined a mean of 36 YPLL per person due to TBI and $188 annually in productivity losses per person.
During this period, unintentional falls were the most common cause of TBI (37%), followed by motor vehicle traffic crashes (26%), and struck by/against a person or object (21%). Nationally, the top three causes of TBI followed suit: falls (28%), motor vehicle traffic crashes (20%), and struck by/against a person or object (19%).5 Another study estimated the same top two causes of TBI nationally: falls (41%) and motor vehicle traffic crashes (39%).12 A study in England found the same two causes of TBI: unintentional falls (50%) and road traffic collisions (33%).13
Like the studies at the national level, our study observed an interesting scenario: though the unintentional falls-related TBI were highest among the youngest and oldest Missourians (those aged 0–5 and those aged ≥80 years), the rate of mortality was highest only for people aged ≥80 years.5,14
The adoption of Brain Trauma Foundation (BTF) guidelines for treating severe TBI has been shown to result in substantial savings in costs and lives.15 One study concluded that adhering to the BTF treatment protocol could attain a significant reduction in length of hospital stay and charges for TBI.16 According to this study, compliance with the TBI protocol saved $4.7 million in hospital charges during the period of six years. While existing studies add to the knowledge base of TBI, our study provided the socioeconomic cost of TBI at the state level.
Limitations
Our study had some limitations. First, we underestimated the ED visit and hospitalization costs due to an underestimation of TBI incidence, as some TBI incidents were not reported. Second, data on TBI-related disability, lost wages, quality of life, and other costs (e.g., prescriptions, transportation for care, and care wait time) were unavailable in Missouri.
CONCLUSIONS
This study found that the indirect costs were higher than the direct costs for TBI-related deaths, which is confirmed in the literature.17 However, the losses related to TBI (e.g., in terms of deaths, as well as adverse health, social, and financial costs) are easily preventable. Prevention measures such as safety belt and helmet use, and drinking and driving laws, have proved to be effective strategies in reducing injury severity and fatalities, and they can be implemented at a very low cost.18 These policies can play a significant role in preventing and mitigating brain injuries. Through partnering with other agencies and interested parties; working collaboratively at the federal, state, and local levels; remaining vigilant in comprehensive prevention efforts; and maintaining safety policies, we can reduce the number of TBI fatalities and injuries and the overall associated costs. In addition, states' surveillance systems can play an important role in identifying causes and risk factors for developing interventions.19
Acknowledgments
The authors thank Nisreen Kabeer, Mark VanTuinen, Robert Feyerharm, Martha LeMond, Maggie White, Wayne Schramm, Margaret Tyler, Sheila Murphy, David Litchfield, and Andrew Hunter for technical assistance; and Brian Tordoff for proofreading.
Footnotes
This research was supported by the Division of Community and Public Health, Missouri Department of Health and Senior Services, as well as state general revenue.
REFERENCES
- 1.Missouri Department of Health and Senior Services. Patient Abstract System. Jefferson City (MO): Missouri Department of Health and Senior Services; 1999–2003. [Google Scholar]
- 2.Kreutzer JS, Kolakowsky-Hayner SA, Ripley D, Cifu DX, Rosenthal M, Bushnik T, et al. Charges and lengths of stay for acute and inpatient rehabilitation treatment of traumatic brain injury, 1990–1996. Brain Inj. 2001;15:763–74. doi: 10.1080/02699050010025786. [DOI] [PubMed] [Google Scholar]
- 3.Centers for Disease Control and Prevention, National Center for Health Statistics (US) Classifications of diseases and functioning & disability. International Classification of Diseases, Ninth Revision, Clinical Modification (ICD-9-CM) [cited 2005 Oct 12] Available from: URL: http://www.cdc.gov/nchs/about/otheract/icd9/abticd9.htm.
- 4.Missouri Department of Health and Senior Services. Missouri information for community assessment: death MICA, 2001–2004 [cited 2005 Dec 1] Available from: URL: http://www.dhss.mo.gov/DeathMICA/index.html.
- 5.Langlois JA, Rutland-Brown W, Thomas KE. Traumatic brain injury in the United States: emergency department visits, hospitalizations, and deaths. Atlanta: Centers for Disease Control and Prevention, National Center for Injury Prevention and Control (US); 2004. [Google Scholar]
- 6.Finkler SA. The distinction between cost and charges. Ann Intern Med. 1982;96:102–9. doi: 10.7326/0003-4819-96-1-102. [DOI] [PubMed] [Google Scholar]
- 7.Haddix AC, Teutsch SM, Corso PS. Prevention effectiveness: a guide to decision analysis and economic evaluation. 2nd ed. New York: Oxford University Press; 2002. [Google Scholar]
- 8.Office of the Federal Register. Proposed rules. Federal Register. 2001;66:22727. [Google Scholar]
- 9.Department of Labor, Bureau of Labor Statistics (US) Consumer price index: medical care (data for Midwest urban region), 1999–2003 [cited 2005 Oct 1] Available from: URL: http://stats.bls.gov/cpi/data.htm.
- 10.Missouri Department of Health and Senior Services. Missouri vital statistics; abridged life table for total population and by sex: Missouri 2003 [cited 2005 Dec 1] Available from: URL: http://www.dhss.mo.gov/VitalStatistics/MVS03/Table29.pdf.
- 11.Max W, Rice PD, Sung HY, Michel M. Valuing human life: estimating the present value of lifetime earnings, 2000. San Francisco: University of California, Center for Tobacco Control Research and Education; 2004. Also available from: URL: http://repositories.cdlib.org/ctcre/esarm/PVLE2000 [cited 2005 Oct 1] [Google Scholar]
- 12.McGarry LJ, Thompson D, Millham FH, Cowell L, Snyder PJ, Lenderking WR, et al. Outcomes and costs of acute treatment of traumatic brain injury. J Trauma. 2002;53:1152–9. doi: 10.1097/00005373-200212000-00020. [DOI] [PubMed] [Google Scholar]
- 13.Christensen MC, Ridley S, Lecky FE, Munro V, Morris S. Outcomes and costs of blunt trauma in England and Whales. Crit Care. 2008;12:R23. doi: 10.1186/cc6797. [DOI] [PMC free article] [PubMed] [Google Scholar]
- 14.Traumatic brain injury—Colorado, Missouri, Oklahoma, and Utah, 1990–1993. MMWR Morb Mortal Wkly Rep. 1997;46(01):8–11. [PubMed] [Google Scholar]
- 15.Faul M, Wald MM, Rutland-Brown W, Sullivent EE, Sattin RW. Using a cost-benefit analysis to estimate outcomes of a clinical treatment guideline: testing the Brain Trauma Foundation guidelines for the treatment of severe traumatic brain injury. J Trauma. 2007;63:1271–8. doi: 10.1097/TA.0b013e3181493080. [DOI] [PubMed] [Google Scholar]
- 16.Fakhry SM, Trask AL, Waller MA, Watts DD. IRTC Neurotrauma Task Force. Management of brain-injured patients by an evidence-based medicine protocol improves outcomes and decreases hospital charges. J Trauma. 2004;56:492–500. doi: 10.1097/01.ta.0000115650.07193.66. [DOI] [PubMed] [Google Scholar]
- 17.Borg J, Holm L, Peloso PM, Cassidy JD, Carroll LJ, Von Holst H, et al. Non-surgical intervention and cost for mild traumatic brain injury: results of the WHO Collaborating Centre Task Force on Mild Traumatic Brain Injury. J Rehabil Med. 2004;36(43) Suppl:S76–83. doi: 10.1080/16501960410023840. [DOI] [PubMed] [Google Scholar]
- 18.Homan SG, Kabeer NH, Kayani NA, Feyerharm RW, Zhu BP. The public health burden of traumatic brain injuries in Missouri. Jefferson City (MO): Missouri Department of Health and Senior Services, Division of Community and Public Health; 2006. Also available from: URL: http://www.dhss.mo.gov/HIA-Council/TBI-BurdenReport.pdf [cited 2009 Mar 5] [Google Scholar]
- 19.Thurman DJ, Alverson C, Dunn KA, Guerrero J, Sniezek JE. Traumatic brain injury in the United States: a public health perspective. J Head Trauma Rehabil. 1999;14:602–15. doi: 10.1097/00001199-199912000-00009. [DOI] [PubMed] [Google Scholar]


