Abstract
Efflux of K+ from dissociated salamander Müller cells was measured with ion-selective microelectrodes. When the distal end of an isolated cell was exposed to high concentrations of extracellular K+, efflux occurred primarily from the endfoot, a cell process previously shown to contain most of the K+ conductance of the cell membrane. Computer simulations of K+ dynamics in the retina indicate that shunting ions through the Müller cell endfoot process is more effective in clearing local increases in extracellular K+ from the retina than is diffusion through extracellular space.
Local changes in extracellular potassium ion concentration, [K+]o, are produced within the central nervous system as part of normal neuronal activity (1). These changes can affect neuronal activity by altering cellular resting potentials. Astrocytic glia are thought to attenuate changes in local [K+]o by a process known as “K+ spatial buffering” (2, 3). In this process, local increases in [K+]o are accompanied by K+ influx into astrocytes. An equal amount of K+ exits from these cells or from cells electrically coupled to them in regions where [K+]o is lower, thus transferring K+ away from the sites of initial increase.
We have suggested that the retinal Müller cell, a specialized astrocyte that spans nearly the entire width of the retina, buffers changes in retinal [K+]o (4, 5). We have shown that amphibian Müller cells are almost exclusively permeable to K+ (6) and that 94 percent of the total K+ conductance in these cells occurs in the Müller cell endfoot, a process lying adjacent to the vitreous humor (4). This highly asymmetric K+ conductance distribution may make the process of K+ spatial buffering more powerful than has been recognized. For example, nearly all of the K+ current entering Müller cells from regions of increased [K+]o within the retina may leave the Müller cell endfoot process at the vitreo-retinal border. Thus, the vitreous would function as a large potassium sink.
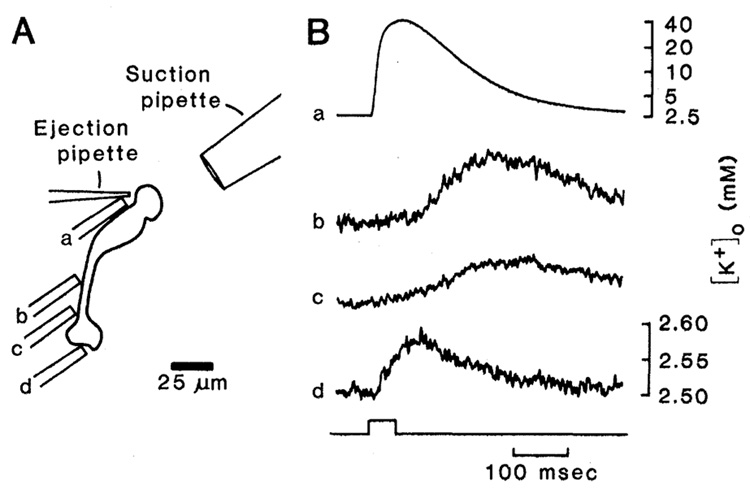
We now present experimental evidence of extracellular K+ buffering by Müller cells which utilizes this asymmetric conductance distribution. Dissociated Müller cells from the salamander Ambystoma tigrinum were prepared and maintained as described (4). The distal end of the Müller cell surface was exposed to increased [K+]o by pressure-ejecting an 85 mM KCl-Ringer solution from an extracellular pipette (approximately 3 µm in tip diameter). Perfusate near this ejection pipette was drawn into a suction pipette (30 µm in diameter) to limit the spread of K+ from the ejection site to other areas of the Müller cell membrane. Single-barreled (7) K+-selective microelectrodes [8 µm in diameter, filled with Corning resin 477317 (8)] were used to measure [K+]o near different regions of the dissociated Müller cell surface (Fig. 1A, sites a through d).
Fig. 1.
Measurement of K+ efflux from a dissociated Ambystoma tigrinum Müller cell. (A) Schematic of a dissociated cell showing location of K+ ejection and suction pipettes and the four positions of the ion-selective microelectrode (a through d). (B) Voltage records from the ion-selective microelectrode made at the locations indicated in (A). The onset and duration of a 50-msec pressure pulse applied to the ejection pipette is indicated at the bottom. Traces b, c, and d are expanded vertically relative to trace a. The concentration scales (mM) were determined by calibrating ion-selective pipettes in a series of K+ solutions.
The results of one experiment are shown in Fig. 1B. At the distal end of the dissociated Müller cell (Fig. 1A, site a), the site of K+ ejection, we measured an increase in [K+]o to 40 mM (Fig. 1B, trace a). When the K+-selective micro-electrode was moved from the ejection site to sites b and c (Fig. 1A), much smaller increases in [K+]o were measured (Fig. 1B, traces b and c). These increases were generated by diffusion and bulk flow of K+ from the ejection site, as indicated by their slower time courses and the decrease in their amplitudes with distance. Similar slow responses were recorded when the ion-selective electrode was moved away from the Müller cell surface. At site d (Fig. 1A), adjacent to that portion of the endfoot surface that normally faces the vitreous, the slow increase in [K+]o was almost absent. However, a rapid, transient increase in [K+]o of 75 µM was seen (Fig. 1B, trace d). This increase was due to efflux of K+ from the endfoot membrane.
Results similiar to those shown in Fig. 1B were obtained from experiments with 26 cells. Short latency responses were recorded at the surface of the endfoot that faces the vitreous in vivo but not from other sites along the Müller cell membrane. The mean latency of the K+ efflux from the endfoot was 12.2 ± 7.0 msec (mean ± standard deviation, n = 38), with latencies as short as 4 msec seen on six occasions.
These results show that K+ entering a Müller cell at the site of [K+]o increase exits preferentially from the endfoot process. The short latency of the increase in [K+]o near the endfoot indicates that this K+ transfer is driven by an electromotive rather than a diffusional force. Efflux of K+ from the endfoot process occurred almost concurrently with K+ influx. Indeed, the endfoot response latencies measured were almost entirely due to the delay introduced by K+ diffusion through extracellular space, both at the site of ejection and at the endfoot.
To determine whether K+ transfer by Müller cells is sufficiently large to generate significant buffering of changes in [K+]o in the retina, we used a previously developed computer model simulating K+ dynamics within the frog retina (5). The model incorporates K+ spatial buffering by Müller cells and K+ diffusion through extracellular space as clearance mechanisms for simulated increases in [K+]o. Except for the changes noted (see Fig. 2), all parameters used in the model were the same as those specified earlier (5).
Fig. 2.
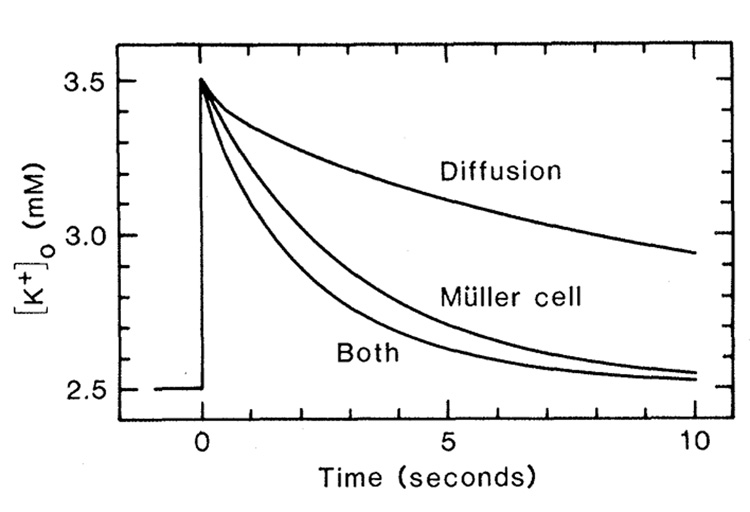
Computer simulation of the clearance of extracellular K+ from the inner plexiform layer of the frog retina after an imposed increase in [K+]o. The time course of K+ clearance achieved by diffusion through extracellular space (Diffusion), by K+ current through Müller cells (Müller cell), and by both mechanisms (Both) are shown. [K+]o was calculated at 30 percent retinal depth, the midpoint of the imposed increase. The following parameters differed from those used in the version of the model previously described (5). Active uptake was assumed not to occur. Müller cell conductance [see (12)] at the end-foot layer (0 to 4 percent retinal depth) was 32 S/cm3 and in the remainder of the cell (5 to 70 percent depth) was 0.62 S/cm3. Location (in percent retinal depth) and extracellular volume fraction (in percent, indicated in parentheses) of retinal layers: endfoot, 0 to 4 (100); optic fiber, 5 to 10 (2.4); ganglion cell, 11 to 19 (2.4); inner plexiform, 20 to 40 (13.3); inner nuclear, 41 to 57 (3); outer plexiform, 58 to 61 (13.8); and outer nuclear, 62 to 70 (3 percent). Volume fraction values from (13).
We stipulated an initial rise in [K+]o from 2.5 to 3.5 mM in the inner plexiform layer, the region of the retina that undergoes the greatest increase in [K+]o when stimulated by light (9). When mechanisms for both K+ spatial buffering and K+ diffusion acted, the increase in [K+]o was reduced to one-half of its initial value in 1.4 seconds (one-half clearance time). A similar one-half clearance time (1.8 to 2.0 seconds) has been measured in the frog retina (10). The Müller cell K+ buffering mechanism acting alone gave a one-half clearance time of 2.1 seconds in our simulation, and diffusion acting alone gave a one-half clearance time of 7.7 seconds. Müller cell K+ spatial buffering is thus large enough to play a major role in clearing increases in [K+]o from the retina. Active uptake of K+ by neurons or glia may also be an important clearance mechanism. The kinetics of active uptake is difficult to assess, however (11), and was not included in our simulation.
When the K+ spatial buffering hypothesis was originally proposed (2), K+ conductance was implicitly assumed to be distributed uniformly across the glial cell surface. Potassium currents produced by this mechanism would lead to K+ transfer over relatively short distances, with excess K+ deposited in nearby neural tissue (3, 11). Potassium spatial buffering by Müller cells appears to be much more efficient. Most of the K+ entering a Müller cell is shunted out through the endfoot process. Thus, excess extracellular K+ is deposited in the vitreous instead of in retinal tissue. The term “K+ siphoning” concisely describes this process. We suggest that K+ siphoning by Müller cells plays an important role in K+ homeostasis in the retina.
This K+ buffering mechanism may be a general phenomenon. The endfeet of astrocytes in the brain lie adjacent to capillaries and the ventricular spaces. If astrocyte endfeet have K+ conductance properties similar to those of Müller cells, excess extracellular K+ would be shunted into capillaries and the cerebrospinal fluid instead of into neural tissue sensitive to changes in [K+]o. Thus K+ siphoning may play an important role in K+ homeostasis in the brain as well.
Acknowledgments
We thank U. C. Dräger for assistance in vimentin labeling of retinal sections, J. Y. Lettvin for suggesting the term “K+ siphoning,” and J. I. Gepner for helpful comments on the manuscript. Supported by NIH grants EY04077 (E.A.N.) and EY05630 (D.A.F.).
Contributor Information
Eric A. Newman, Eye Research Institute of the Retina Foundation, Boston, Massachusetts 02114.
Donald A. Frambach, Eye Research Institute of the Retina Foundation, Boston, Massachusetts 02114
Louis L. Odette, College of Engineering, Boston University, Boston, Massachusetts 02215
References and Notes
- 1.Lux HD. Neuropharmacology. 1974;13:509. doi: 10.1016/0028-3908(74)90140-3. [DOI] [PubMed] [Google Scholar]
- 2.Orkand RK, Nicholls JG, Kuffler SW. J. Neurophysiol. 1966;29:788. doi: 10.1152/jn.1966.29.4.788. [DOI] [PubMed] [Google Scholar]; Kuffler SW. Proc. R. Soc. London Ser. B. 1967;168:1. doi: 10.1098/rspb.1967.0047. [DOI] [PubMed] [Google Scholar]
- 3.Trachtenberg MC, Pollen DA. Science. 1969;167:248. [Google Scholar]
- 4.Newman EA. Nature (London) 1984;309:155. doi: 10.1038/309155a0. [DOI] [PMC free article] [PubMed] [Google Scholar]
- 5.Newman EA, Odette LL. J. Neurophysiol. 1984;51:164. doi: 10.1152/jn.1984.51.1.164. [DOI] [PubMed] [Google Scholar]
- 6.Newman EA. Soc. Neurosci. Abstr. 1981;7:275. [Google Scholar]
- 7.Use of double-barreled microelectrodes is not necessary when measuring [K+]o near dissociated cells because the field potentials generated are negligible compared to the K+ voltages measured by the resin-filled barrel.
- 8.Lux HD, Neher E. Exp. Brain Res. 1973;17:190. doi: 10.1007/BF00235028. [DOI] [PubMed] [Google Scholar]
- 9.Kline RP, Ripps H, Dowling JE. Proc. Natl. Acad. Sci. U.S.A. 1978;75:5727. doi: 10.1073/pnas.75.11.5727. [DOI] [PMC free article] [PubMed] [Google Scholar]; Dick E, Miller RF. Brain Res. 1978;154:388. doi: 10.1016/0006-8993(78)90711-4. [DOI] [PubMed] [Google Scholar]
- 10.Karwoski CJ, Criswell MH, Proenza LM. Invest. Ophthalmol. Visual Sci. 1978;17:678. [PubMed] [Google Scholar]
- 11.Gardner-Medwin AR. J. Physiol. (London) 1983;335:393. doi: 10.1113/jphysiol.1983.sp014541. [DOI] [PMC free article] [PubMed] [Google Scholar]
- 12.The value of Müller cell membrane conductance was determined from the following information. Dissociated Rana pipiens Müller cells with end-feet removed are 84 µm long and have an input conductance of 1.09 × 10⁻⁸ S [E. A. Newman, in preparation; see also (4)]. Müller cells in R. pipiens have a density of 4.8 × 10⁵ cells per square centimeter, as determined from counts of Müller cells in horizontal retinal sections labeled with antiserum to vimentin, a glial cell marker [U. C. Dräger, Nature (London) 303, 169 (1983)]. A Müller cell conductance (excluding the endfoot) of 0.62 S/cm3 is obtained from these values: (1.09 × 10⁻⁸ S per cell) (4.8 × 10⁵ cell per square centimeter) (8.4 × 10⁻³ cm)−1. Intact R. pipiens Müller cells have an input conductance of 5.56 × 10⁻⁸ S. Thus the Müller cell endfoot has a conductance of 32 S/cm3 (on the basis of the thickness of the endfoot layer assumed in the computer model).
- 13.Karwoski CJ, Frambach DA, Proenza LM. in preparation. [Google Scholar]


