

Abstract
Aminoflavone (5-amino-2-(4-amino-3-fluorophenyl)-6,8-difluoro-7-methylchromen-4-one; AF; NSC 686288), a novel anticancer candidate agent, is undergoing clinical evaluation. AF induces DNA-protein cross-links (DPCs), γ-H2AX phosphorylation, aryl hydrocarbon receptor (AhR) signaling, apoptosis and its own metabolism via cytochrome P4501A1 and 1A2 (CYP1A1/1A2) activation in sensitive estrogen receptor positive (ER+) MCF7 breast cancer cells. Estrogen receptor negative (ER−) breast cancer is typically more aggressive with a poorer prognosis. In this investigation, we evaluated the ability of AF to induce reactive oxygen species (ROS) formation, oxidative DNA damage and apoptosis in ER− MDA-MB-468 breast cancer cells. The antioxidant, N-acetyl-L-cysteine (NAC), attenuated the cytotoxic effects of AF in MDA-MB-468 cells; an effect is also observed in ER+ T47D breast cancer cells. Nonmalignant MCF10A breast epithelial cells were resistant to the cytotoxic effects of AF. AF increased intracellular ROS, an effect blocked by NAC and the CYP1A1/1A2 inhibitor, α-Naphthoflavone (α-NF). AF induced oxidative DNA damage as evidenced by increased 8-oxo-7,8-dihydroguanine (8-oxodG) levels and DPC formation in these cells. AF caused S-phase arrest corresponding to an increase in p21(waf1/cip1) protein expression. AF induced caspase 3, 8 and 9 activation, caspase-dependent apoptotic body formation and poly [ADP-ribose] polymerase (PARP) cleavage. Pretreatment with the pan-caspase inhibitor, benzyloxycarbonyl-Val-Ala-DL-Asp(OMe)-fluoromethylketone inhibited apoptosis and partially inhibited ROS formation and oxidative DNA damage. Pretreatment with NAC attenuated AF-induced apoptotic body formation and caspase 3 activation. These studies suggest AF inhibits the growth of breast cancer cells in part, by inducing ROS production, oxidative DNA damage and apoptosis and has the potential to treat hormone-independent breast cancer.
Keywords: DNA damage, oxidative stress, apoptosis, breast cancer, aminoflavone
Excluding cancers of the skin, breast cancer is the most common cancer among women, accounting for nearly 1 in 3 cancers diagnosed in US women. Estrogen receptor positive (ER+) breast cancer tends to respond to selective estrogen receptor modulators (SERMs) such as Tamoxifen. Estrogen receptor negative (ER− ) breast cancer on the other hand is generally unresponsive to these agents.1,2 In addition, not all patients with hormone-dependent breast cancer respond to SERMs and some who initially respond develop resistance to this form of therapy. It is therefore vital to develop drugs that demonstrate anticancer activity in both forms of breast cancer. Aminoflavone (5-amino-2-(4-amino-3-fluorophenyl)-6,8-difluoro-7-methylchromen-4-one; AF; NSC 686288) (Fig. 1a), a novel anticancer candidate agent currently undergoing clinical evaluation, has been previously shown to display potent in vitro and in vivo antiproliferative activity against select human cancer cell lines with a unique anticancer activity profile in the National Cancer Institute (NCI) 60 cell line screen. This suggests that its mechanism of action differs from that of anticancer agents currently used clinically, although the exact mechanism by which AF displays its anticancer activity has not been fully elucidated.3–6
Figure 1.

Aminoflavone inhibits growth and increases ROS levels in sensitive cancer cells. (a) Structure of Aminoflavone (5-amino-2-(4-amino-3-fluorophenyl)-6,8-difluoro-7-methylchromen-4-one; AF; NSC 686288). (b) Exponentially growing malignant MDA-MB-468 and immortalized MCF-10A nonmalignant cells were treated with varying concentrations of AF or vehicle control (0.1% DMSO) continuously for 12 or 72 hr before Alamar Blue™ dye reagent was added and absorbance or fluorescence was measured to determine the anticancer activity of AF as determined in Materials and Methods. Data represent the mean of at least 3 independent experiments performed in quadruplicate; bars, SEM. (c) Cells were treated with negative control (CTL, 0.1% DMSO), 20 mM NAC, positive control (H2O2, 500 μM), AF (1.0 μM) or AF combined with NAC for 3 hr prior to analysis of ROS levels. Data represent the mean of at least 2 independent experiments performed in triplicate; bars, SEM. *p < 0.05 when comparing the 2 treatment groups. (d and e) Cells were treated with vehicle control (0.1% DMSO), 100 μM α-NF, 100 μM Z-VAD-fmk, AF (at the indicated concentrations in D or 1.0 μM in E) or AF following α-NF (1 hr) or Z-VAD-fmk (2 hr) pretreatment. Accumulation of intracellular ROS was detected by flow cytometry as described in Materials and Methods. Data represent the mean of at least 3 independent experiments performed in duplicate; bars, SEM. ***p < 0.001 or **p < 0.01 when comparing the indicated treatment groups. (f) Sensitive and insensitive breast cell lines were treated with vehicle control (0.1% DMSO) or 1 μM AF for 6 hr followed by measurement of increases in intracellular ROS levels as described above. Data represent the mean of at least 2 independent experiments performed in duplicate; bars, SEM. *p < 0.05 or **p < 0.01 when comparing ROS levels in sensitive cells vs. resistant cells exposed to 1 μM AF.
Previous studies indicate AF induces cytochromes P450 1A1 and 1A2 (CYP1A1/1A2) expression, DNA damage, cell cycle arrest and apoptosis in ER+ MCF-7 breast cancer cells.7–9 AF activates the aryl hydrocarbon receptor (AhR) signaling pathway, which in turn leads to the transcriptional activation of genes such as CYP1A1 and CYP1A2 in MCF-7 cells which promote its metabolism.6 AF presumably binds to AhR in the cytosol forming a complex with molecular chaperones Hsp90, ARA9 and p23 which translocates to the nucleus. In the nucleus the AhR binds to the aryl hydrocarbon nuclear translocator (ARNT) which converts AhR into a high affinity DNA binding form following the dissociation of the molecular chaperones. This AhR-ligand-ARNT complex can then bind to the xenobiotic response element leading to gene transcription.
Recent studies demonstrate the ability of sulfotransferases within cancer cells to also metabolize AF which may play at least as pivotal a role in its anticancer activity as cytochrome P450s.10,11 The ability of AF to induce its own metabolism reveals a unique aspect of its mechanism of anticancer action, a feature not found among clinically available anticancer agents. Sensitive cells possess constitutively high levels of sulfotransferases which can convert AF into active species and depend upon AhR signaling pathway activation resulting in CYP1A1 or CYP1A2 induction in response to the apoptotic and DNA damaging effects of AF.10,12 Certain ER− breast cancer cells (i.e., MDA-MB-435) demonstrate resistance to AF6,7 since they contain low sulfotranferase expression levels and are unresponsive to AhR signaling activation.
The correlation between sulfotransferase expression and relative sensitivity to AF was determined among cells within the NCI 60 cell line panel. The MDA-MB-468 breast cancer cell line outlined in this report is not a part of this panel. This cell line though ER−, displays aryl hydrocarbon responsiveness and expresses elevated levels of sulfotransferases.13 Thus, we reasoned AF would demonstrate anticancer activity in these cells. Substances that activate the AhR signaling pathway often induce the expression of cytochrome P450s and phase II drug metabolizing enzymes such as sulfotransferases. These substances often increase reactive oxygen species (ROS) formation within susceptible cells presumably following metabolic activation.
MDA-MB-468 cells do not express the progesterone receptor and contain exceptionally low HER2/neu expression levels, characteristic of a breast cancer type that often has an exceptionally poor prognosis with few therapeutic options. Besides its estrogen receptor status, MDA-MB-468 cells differ from MCF-7 cells in possessing a mutated form of p53 while MCF-7 cells possess wild type p53.14–16 We anticipated that differences may occur in the ability of AF to induce p21(waf1/cip1) expression,12 a protein that halts cell cycle progression to prevent the replication of damaged DNA.17,18 The induction of p21(waf1/cip1) often occurs in response to its primary transcriptional activator and tumor suppressor p53.19 If p53 is mutated then p21(waf1/cip1) can become activated by other mechanisms.17,20–23 Activation of the mitogen-activated protein kinase (MAPK) pathway commonly involved in ROS-induced cell cycle arrest represents a facet of one such mechanism. The MAPK pathway is subject to redox control and can transactivate the p21(waf1/cip1) promoter.24 This can result in ROS-induced, p53-independent activation of p21(waf1/cip1).
Thus far, our study to date is the first to outline the ability of AF to modulate oxidative stress in cancer cells. Flavonoids have been shown to demonstrate their anticancer effects by influencing oxidative stress in cancer cells.25,26 Since AF is a flavonoid small molecule, we hypothesized that this agent would modulate oxidative stress as part of its mechanism of anticancer activity in sensitive cancer cells. To examine this hypothesis, we evaluated the ability of AF to induce intracellular ROS production in several different breast cancer cell lines including T47 D cells which are ER+ cell line yet possesses mutant p53 expression.
Because no studies to date have demonstrated the ability of AF to inhibit the growth of ER− breast cancer cells, we evaluated its ability to induce cytotoxicity, oxidative DNA damage and apoptosis in ER− MDA-MB-468 cells. We examined whether oxidative stress or caspases participate in mediating AF-induced growth inhibition, reactive oxygen species formation, DNA damage and apoptosis in these cells. In addition, we examined the role CYP1A1 and CYP1A2 play in AF-induced ROS generation. Our studies provide additional insight into the mechanism of anticancer activity for this candidate agent which is expected to ultimately benefit breast cancer patients including those with exceptionally limited therapeutic options.
Material and methods
Cell culture, reagents and drugs
Human MDA-MB-468 and MCF-7 breast cancer cell lines were obtained from the American Type Culture Collection (ATCC) while MDA-MB-231, MDA-MB-435 and T47D cells were obtained from NCI-Frederick Cancer DCTD tumor/cell line repository. Cells were cultured in RPMI-1640 medium containing 10% FBS (Hyclone, Logan, UT), 2 mM glutamine and penicillin–streptomycin antibiotic (Mediatech, Herndon, VA). Additionally, human breast epithelial MCF10A cells were a kind gift from Dr. Daisy DeLeon (Loma Linda University, Loma Linda, CA). The MCF10A cells were cultured in Dulbecco’s Modified Eagle’s Medium/nutrient mixture F-12 (Mediatech, Herndon, VA) supplemented with hydrocortisone (Sigma-Aldrich, St. Louis, MO), human recombinant EGF (Sigma-Aldrich, St. Louis, MO), 5% (v/v) horse serum (Invitrogen, Carlsbad, CA), cholera toxin (Calbiochem, BD Biosciences, La Jolla, CA) and penicillin–streptomycin antibiotic (Mediatech). A monoclonal mouse antibody for PARP was purchased from R&D Systems (Minneapolis, MN). The Annexin V-PI kit, the mouse monoclonal antibodies against p21WAF1/CIP1 and GAPDH as well as the goat anti-mouse IgG-HRP secondary antibody were purchased from Santa Cruz Biotechnology (Santa Cruz, California). AF was obtained from the Developmental Therapeutics Program Repository of the National Cancer Institute at Frederick (Frederick, MD). Drug stock solutions of 10 mM dissolved in dimethyl sulfoxide (DMSO, Sigma) were stored protected from light at − 20°C until use. Before use, the stock solution was diluted to the desired concentrations in complete RPMI medium such that the final DMSO concentration did not exceed 0.1%. This low concentration had no appreciable affect on cells. Alamar Blue™ dye was purchased from BioSource International, (Camarillo, CA). RNase was obtained from Calbiochem. Staurosporine (STS) and Z-VAD-fmk were purchased from Biomol International, LP (Plymouth Meeting, PA). SuperSignal West Pico chemiluminescent substrate was purchased from Pierce Biotechnology (Rockford, IL). All other reagents were purchased from Sigma Aldrich.
Alamar blue™ assay
The cytotoxicity of AF in MDA-MB-468 and MCF-10A cells was determined using the Alamar Blue™ assay as previously described.27 Briefly, cells were plated in 96-well plates at their appropriate densities (5,000–20,000 cells/well) in a total volume of 200 μL. After 24–48 hr of incubation, cells were treated with 0.1% DMSO (vehicle) or AF (0.1 nM–100 μM) for 12 or 72 hr before the addition of 20 μL of Alamar Blue™ dye. After 4 hr of dye incubation, fluorescence was read using an FLx800 microplate fluorescence reader (excitation and emission = 530 and 590 nm respectively). In some experiments, cells were treated with varying concentrations of AF or with 0.1% DMSO, 1 μM AF, 100 μM Z-VAD-fmk or 25 mM NAC for 12 hr. Alternatively, cells were pretreated with benzyloxycarbonyl-Val-Ala-DL-Asp(OMe)-fluoromethylketone (Z-VAD-fmk) or N-acetyl-L-cysteine (NAC) followed by treatment with AF before cytotoxicity was evaluated.
Hoffman modulation phase contrast microscopy
Apoptosis was also visualized using an Olympus IX70 inverted microscope equipped with Hoffman modulation phase contrast and images were acquired using a SPOT digital camera system. Briefly, MDA-MB-468 cells were plated overnight, and then treated with 0.1% DMSO (negative control), 0.1–10.0 μM AF for 24 hr and visualized under the microscope. In some experiments, cells were treated with Staurosporine (STS; positive control) or pretreated with 100 μM Z-VAD-fmk for 2 hr or 25 mM NAC for 1 hr followed by incubation with AF (12 hr) prior to examining cells for apoptotic body formation.
Annexin V-PI staining
The ability of AF to induce apoptosis in MDA-MB468 cells was evaluated using the Annexin V-FITC and propidium iodide (PI) assay according to the manufacturer’s protocol (Santa Cruz Biotechnology). Briefly, MDA-MB-468 cells were treated with 0.1% DMSO (vehicle control) or AF (0.1–10.0 μM) for 24 hr. The cells were then harvested, washed twice with PBS then resuspended in 1X Assay Buffer before the addition of Annexin V-FITC (10 min at room temperature) and PI (15 min on ice) to the samples protected from light. Samples were then analyzed by a FACScalibur instrument (Becton and Dickinson). Annexin +/PI + cells were defined as late apoptotic, while Annexin +/PI− cells were defined as early apoptotic. In some experiments, cells were treated with STS (positive control), or pretreated with Z-VAD-fmk for 2 hr followed by AF treatment.
Caspase activity assay
MDA-MB-468 cells were plated at a density of 2 × 10⁴ cells/well, in 96-well Nunc black plates and cultured overnight in the presence of 5% CO2 at 37°C. Cells were treated 24 hr later with 1 μM AF for various times (0–6 hr) to induce apoptosis, each in triplicate. At the end of each time point, a one-step cellular caspases activity assay was performed using the substrates (EMD Biosciences, La Jolla, CA) as follows: DEVD-AMC for caspase 3, IETD-AMC for caspase 8 or LEHD-AMC for caspase 9 as described previously.28 Briefly, after AF treatment, cells were incubated for 1 hr at 37°C with 50 μL/well of filtered 3X one-step caspase assay buffer (150 mM HEPES, pH 7.4, 450 mM NaCl, 150 mM KCl, 30 mM MgCl2, 1.2 mM EGTA, 1.5% Nonidet P40, 0.3% CHAPS, 30% sucrose) supplemented with 150 μM of the appropriate caspase substrates, 30 mM DTT and 3 mM phenylmethanesulphonyl-fluoride. Caspase activity was measured (excitation at 360 nm and emission at 460 nm) using an FLx800 microplate fluorescence reader. The caspase activity for each time point was expressed as percent caspase activation relative to untreated control. In some experiments, cells were pretreated with 25 mM NAC or 100 μM Z-VAD-fmk for 1 hr prior to treatment with AF before measuring caspase activity.
Measurement of intracellular reactive oxygen species levels
Intracellular ROS levels were measured using the fluorescent dye 2′,7′-dichlorodihydrofluorescein diacetate (H2DCF-DA; Sigma). H2DCF-DA is a nonpolar compound which upon incorporation into cells is converted into a membrane-impermeable, nonfluorescent polar compound, H2DCF, by the action of cellular esterases. In the presence of intracellular ROS, H2DCF is oxidized to the fluorescent 2′,7′-dichlorofluorescein (DCF), which is readily detected by flow cytometry. Various cancer cells as well as the nonmalignant cell line (MCF10A) were treated with 0.1% DMSO (negative control), or AF. The DCF fluorescence intensity is proportional to the amount of intracellularly formed ROS. In some experiments, MDA-MB-468 cells were treated with NAC29 (20 mM), αNF (100 μM) or with Z-VAD-fmk (100 μM) for 1–2 hr prior to AF treatment. As a positive control 500 μM H2O2 was used.
Cell cycle analysis
Cell samples were prepared for cell cycle analysis as previously described.30 In brief, ~2 × 10⁵ MDA-MB-468 cells plated in 25-cm2 flasks were treated with 0.1% DMSO (vehicle control) or AF (1.0 μM, 12 hr), harvested in ice-cold PBS (pH 7.4) and fixed in 70% ethanol for at least 30 min. Prior to analysis, cells were washed once with PBS and stained with PBS containing propidium iodide (50 μg/mL) and RNase (50 μg/mL) at 37°C for 30 min. Cellular DNA content was analyzed with a FACScan flow cytometer (Becton Dickinson, Franklin Lakes, New Jersey). Cell cycle distributions were calculated on DNA plots using the Modfit LT Software (Franklin Lakes, New Jersey).
DNA isolation and hydrolysis
MDA-MB-468 cells were treated for 12 hr with 0.1% DMSO (negative control), 1 μM AF, 100 μM Z-VAD-fmk or AF following 2 hr Z-VAD-fmk pretreatment or with 100 μM Buthionine sulfoximine (BSO, positive control) for 18 hr followed by 500 μM H2O2 for 30 min. DNA isolation was done as previously described.31 Briefly, 100–500 μg of DNA was dissolved in 200 μL of 1 mM deferoxamine mesylate (DFAM)/20 mM sodium acetate, pH 5.0. DNA was hydrolyzed to nucleotides by incubation for 10 min at 65°C with 4 μL of a 3.3 mg/mL suspension of nuclease P1 (US Biological, Swampscott, Massachusetts) prepared in 20 mM sodium acetate, pH 5.0. The resulting mixture was adjusted to pH 8.5 by adding 20 μL of 1 M Tris-HCl buffer, pH 8.5 and hydrolyzed to the corresponding nucleosides by incubation with 4 μL of 1U/μL calf intestine alkaline phosphatase (Roche, Indianapolis, Indiana), for 2 hr at 37°C. After alkaline phosphatase digestion, the pH of the hydrolyzed solution of DNA was once again lowered by adding 20 μL of 3 M sodium acetate buffer, pH 5.0, followed by the addition of 20 μL of 50 mM EDTA/10 mM DFAM solution prepared in water. Finally, the solution of DNA was filtered using an Ultra-Free Eppendorf filtration system with centrifugation at 10, 000g for 15–30 min at 4°C.
Measurement of oxidative DNA damage
8-Oxo-7,8-dihydroguanine (8-oxodG) and 2′-deoxyguanosine (dG) were resolved by HPLC and quantified by electrochemical detection. A CoulArray electrochemical detection system (ESA Model 5600A) was employed using a 3 μM, 150 × 4.6 C-18 column (YMC Basic). The nucleosides were eluted from the column with an isocratic mobile phase consisting of 100 mM sodium acetate pH 5.2, 5.0% methanol. The mobile phase was filtered and degassed prior to application followed by filtration using a 0.22 μM, HV Durapore filter. Two coulometric cells (Four Channel; ESA) were placed in series and set to the following potentials: 100, 200, 300, 350, 400, 450, 500 and 550 mV. The identity of dG and 8-oxodG on the chromatograms were determined by coinjection of standards. Standards were run before and after the samples with some samples containing 8-oxodG standard. Standard curves were used to quantify 8-oxodG and dG. The data are expressed as the ratio of 8-oxodG adducts per 105 dG.
Alkaline elution assay
DNA damage was detected using alkaline elution assays as described previously.32 Briefly, MDA-MB-468 cells were radiolabeled with [3H] thymidine (1.0 μCi/mL) for 72 hr. Cells were chased overnight (16 hr) with radioisotope-free medium before receiving treatment. Cells were then treated with 0.1% DMSO or AF (0.1–10 μM) for 18 hr. The cells were harvested following specified incubations with AF by scraping them into ice-cold HBSS. Following alkaline elution, filters were incubated at 65°C with 1 M HCl for 45 min and 0.04 M NaCl added for an additional 45 min of incubation. Radioactivity in each fraction was measured by liquid scintillation (Packard Instruments, Meridien, CT). DPCs were analyzed under nondeproteinizing, DNA-denaturing conditions using protein-adsorbing filters.
Western blot analysis
MDA-MB-468 cells were seeded at 3–4 × 10⁶ per plate (100 mm) 24 hr before treatment with 1 μM AF or 0.1% DMSO for 0, 2, 4, 6, 8, 12, 18 hr. Following treatment, the cells were harvested, washed twice with cold PBS before adding cold lysis buffer (100 mM Tris-HCl [pH 6.8], 4% SDS, 10% glycerol [v/v] and complete protease inhibitor cocktail) for 30 min at 4°C. Protein concentration was determined using the DC protein assay kit according to the manufacturer’s instructions (Bio-Rad, Hercules, CA). For Western blot analysis, proteins were resolved on 8–12% SDS-polyacrylamide gel and transferred electrophoretically onto nitrocellulose membrane for 120–140 min at 30 V. The membranes were blocked with blocking buffer consisting of 5% nonfat dry milk in 1% Tween 20 in 20 mM TBS (pH 7.5) for 1 hr at room temperature then incubated for 1 hr at room temperature with mouse primary antibodies against PARP (1:1,000 dilution) and p21WAF1 (1:1,000 dilution). Membranes were then incubated with goat anti-mouse IgG-HRP secondary antibody (Santa Cruz) for 30 min at room temperature and visualized using the enhanced chemiluminescence detection system.
Statistical analysis
Statistical significance between 3 or more groups was calculated from one-way analysis of variance (ANOVA) followed by Tukey’s test. To compare 2 groups, the unpaired Student’s t test with Welch correction was used. Statistical analysis was performed using GraphPad InStat version 3.06 for Windows 95, GraphPad software, San Diego, California, USA, www.graphpad.com. Designations for statistical significance are *p < 0.05, **p < 0.01 and ***p < 0.001.
Results
AF inhibits the growth of malignant MDA-MB-468 but not nonmalignant MCF-10A cells
To investigate the anticancer effects of AF in MDA-MB-468 cancer cells, we performed the Alamar Blue™ assay which estimates cell number, following 12 and 72 hr of AF exposure. MDA-MB-468 cells were sensitive to AF even after 12 hr of treatment (GI50 < 1 μM). As anticipated, this cytotoxic effect was more pronounced following 72 hr of treatment (GI50 < 100 nM) (Fig. 1b). To determine whether the cytotoxic effects of AF were selective for malignant cells, nonmalignant MCF-10A cells were treated with AF in a similar fashion as the MDA-MB-468 cells. These cells showed resistance to AF treatment (GI50 >100 μM, 72 hr treatment).
Aminoflavone increases intracellular reactive oxygen species levels in sensitive cancer cells in a caspase- and CYP1A1/1A2-dependent manner
Oxidative stress is implicated in various biological processes including proliferation, differentiation and apoptosis. Reactive oxygen species may trigger apoptosis signaling pathways mediated by mitochondria, death receptors or p53.33 Therefore, we investigated the effect of AF on ROS production in MDA-MB-468 cells. To determine whether AF altered intracellular reactive oxygen species levels, we treated cells with AF at varying time points and exposed them to H2DCF-DA before evaluating ROS levels using flow cytometry. AF increased intracellular ROS levels in MDA-MB-468 cells. This effect was distinct and detectable following 3 hr of treatment using 1 μM AF and reversed with 1 hr NAC pre-treatment (Fig. 1c). Previous studies demonstrated CYP1A2 induction by AF and its subsequent metabolism in cells sensitive to its growth suppressive effects.6,7 Cytochrome P450 induction can contribute to increases in intracellular ROS levels. To determine the primary source of this ROS production and whether AF may be converted to a species resulting from CYP1A1/1A2 metabolism that contributes to its ROS-inducing effects, we pretreated cells with the CYP1A1 and CYP1A2 inhibitor, α-Naphthoflavone (α-NF) before AF treatment (6 hr). Our data indicate α-NF inhibited AF-induced production of ROS (Fig. 1d). This suggests AF-induced ROS production occurs predominantly via a CYP1A-dependent pathway. To determine whether caspases are involved in ROS production, cells were pretreated with Z-VAD-fmk for 2 hr prior to analysis of ROS. AF-induced increase in ROS formation was partially inhibited in the presence of Z-VAD-fmk pretreatment suggesting caspase activation contributes to sustaining ROS levels (Fig. 1e). To illustrate a correlation between breast cancer cell sensitivity to AF and ROS generation, we treated a panel of breast cancer cells and nonmalignant MCF10A cells with AF and measured ROS levels. Increases in ROS occurred in MCF-7, T47D and MDA-MB-468 cells and all of these cell lines are sensitive to AF. MDA-MB-435 and MDA-MB-231 breast cancer cells as well as the MCF10A breast epithelial cell line are resistant to the cytotoxic effects of AF and consequently showed no appreciable increases in reactive oxygen species following AF treatment (Fig. 1f).
AF induces oxidative DNA damage in MDA-MB-468 cells
Reactive oxygen species can directly damage DNA.34,35 Some common oxidative DNA damage lesions include 8-oxo-7,8-dihydroguanine (8-oxodG), thymine glycol and 5-hydroxymethyluracil. 8-OxodG, however, has been the most extensively studied and has been found to play a major role in the induction of spontaneous mutations which can lead to apoptosis.34 We therefore measured 8-oxodG/dG levels in MDA-MB-468 cells after treatment with 1 μM AF. AF significantly increased 8-oxodG formation in MDA-MB-468 cells as compared to the negative control (0.1% DMSO) (Fig. 2a). An ~2-fold increase in 8-oxodG/dG levels was detected in cells treated with AF (1 μM, 12 hr) which was comparable to that seen in cells treated with 100 μM BSO/500 μM H2O2 (positive control). This increase in oxidative DNA damage was partially inhibited in the presence of Z-VAD-fmk which suggests caspase activation contributes to DNA damage within susceptible cells. DNA damage often occurs when cells are treated with many anticancer agents and can be in the form of single strand breaks, DNA protein cross-links or double strand breaks. These adducts can also arise from oxidative stress.34 DNA protein cross-links were detected in MDA-MB-468 cells following AF treatment (0.1–10 μM) for 18 hr. The degree of DPC formation occurred in a biphasic fashion with the maximal effect seen at 1.0 μM (Fig. 2b).
Figure 2.

AF induces DNA damage in the form of 8-oxodG and DNA-protein cross-links and cell cycle arrest in MDA-MB-468 cells. (a) Oxidative DNA damage was determined by measuring the levels of 8-oxodG/105dG. MDA-MB-468 cells were treated with 1 μM AF in the presence or absence of 2 hr pretreatment with Z-VAD-fmk for 12 hr or pretreated for 18 hr with 100 μM BSO followed by the addition of 500 μM H2O2 in the media for 30 min. Data represent the mean of at least 3 independent experiments performed in duplicate; bars, SEM. **p < 0.01 or ***p < 0.001 when comparing the indicated treatment groups. (b) MDA-MB-468 cells were treated with varying concentrations of AF for 18 hr or with 0.1% DMSO (control) at 37°C before resultant DPCs were assayed by alkaline elution. Data represent the mean of 2 independent experiments. (c) Exponentially growing MDA-MB-468 cells were exposed to either 0.1% DMSO (control) or 1 μM AF for 12 hr. Cells were then harvested, washed in PBS and fixed in 70% ethanol. DNA content was evaluated with propidium iodide staining and fluorescence measured and analyzed as described in Materials and Methods. Numerical values indicate percentage of cells in S phase. Data is representative of at least 3 independent experiments. (d) Western blot analysis was performed for p21(waf1/cip1) protein expression in MDA-MB-468 cells treated with 1 μM AF for the indicated times. GAPDH was used as a loading control. Data shown is a representative study of at least 3 independent experiments with similar results.
Aminoflavone induces S phase arrest in MDA-MB-468 cells
In response to DNA damage, checkpoint proteins participate in arresting cell cycle progression to enable DNA repair. Cell cycle arrest was determined by flow cytometry. MDA-MB-468 cells were exposed to 0.1% DMSO (control) or 1.0 μM AF for 12 hr and prepared for cell cycle analysis. AF caused a significant increase in the percentage of cells in S phase (Fig. 2c). There was also an accumulation of cells in sub-G1 for cells treated with AF when compared to untreated control cells indicating AF induces apoptosis in these cells. These data show that AF induces S-phase arrest due to its DNA damaging effect. During the cell cycle, CDK activity can be inhibited by cell cycle inhibitory proteins. There are 2 distinct families of these CDK inhibitors, the INK4 family and the Cip/Kip family. The Cip/Kip family includes p21, p27 and p57. The expression of p21 is under transcriptional control of the p53 tumor suppressor gene. The induction of p21 results in CDK inhibition and cell cycle arrest, which prevents the replication of damaged DNA.36 Previous studies demonstrate the ability of AF to induce p21 expression in MCF-7 cells.8,12 To determine whether p21 expression levels are altered in MDA-MB-468 cells following AF treatment, we exposed these cells at varying time points (2–18 hr) to AF (1 μM) and measured p21 protein expression using Western blotting. Data demonstrate that AF induces an increase in p21 expression within 2 hr and sustains this effect for the duration of treatment (Fig. 2d).
Aminoflavone induces apoptosis in MDA-MB-468 cells
To evaluate the apoptotic inducing effects of AF, MDA-MB-468 cells were treated with varying concentrations of AF (0.1–10.0 μM) for 24 hr and then examined for formation of apoptotic bodies using Hoffman modulation phase contrast microscopy (Fig. 3a). To determine the percentage of cells in early apoptosis, cells were harvested following treatment, received Annexin V-PI staining before being analyzed by flow cytometry. The percentage of cells staining positive for Annexin V only (early apoptosis) are illustrated (Fig. 3b). The greatest extent of apoptosis in MDA-MB-468 cells was achieved at 1 μM AF. Apoptosis is significantly greater than untreated controls following treatment with 10 μM AF though less than that seen following treatment with 1 μM AF. Incidentally, although apoptosis is apparent at 0.1 μM AF, it is not statistically greater than that seen in untreated cells. This is consistent with what was determined in a recent publication reporting apoptosis induction by AF in other sensitive cancer cells.12 The biphasic apoptotic response correlates with the biphasic response seen for DNA damage induced by AF in MDA-MB-468 cells.
Figure 3.

AF induces cell death in MDA-MB-468 cells. (a) Cells were treated with AF for 12 hr and visualized by Hoffman modulation phase contrast microscopy (×40 magnification). Data is representative of at least 3 independent experiments. (b) MDA-MB-468 cells treated with DMSO (control) and indicated AF concentrations for 24 hr were exposed to Annexin-V-FITC and propidium iodide staining prior to FACS-can analysis. Data represent the mean of at least 3 independent experiments; bars, SEM. **p < 0.01 or ***p < 0.001 when comparing treatment groups with untreated controls. (c) MDA-MB-468 cells were treated with 1 μM AF in the presence or absence of Z-VAD-fmk. Z-VAD-fmk was added to one set of cells 2 hr before adding AF at 0, 2, 4, and 6 hr. The percent caspase activation was determined by a fluorescent spectrophotometer. Data represent the mean of 3 independent experiments performed in duplicate. (d) Western blot analysis was done for cleaved PARP in MDA-MB-468 cells treated with 1 μM AF for the indicated times. GAPDH was used as a loading control. PARP was shown to be cleaved as early as 8 hr. Data shown is a representative study of at least 3 independent experiments with similar results.
Aminoflavone induces caspase activation and PARP cleavage in MDA-MB-468 cells
We examined the effect of AF on the activation of caspases 3, 8 and 9 and PARP cleavage. AF induced caspase 3, 8 and 9 activation in a time-dependent manner in MDA-MB-468 cells (Fig. 3c). This effect was inhibited when cells were pretreated with Z-VAD-fmk. We also detected a time-dependent induction of PARP cleavage in cells treated with AF (Fig. 3d). Caspase activation and PARP cleavage suggests that the induction of apoptosis in MDA-MB-468 cells by AF is mediated through caspase 3 activation and disruption of the mitochondrial membrane. Caspase 8 activation was also observed which suggests that both the intrinsic and extrinsic apoptotic pathways are involved. Pretreatment with Z-VAD-fmk (100 μM) followed by AF treatment (1 μM, 12 hr) further established that caspases are required to produce the anti-cancer and apoptotic activity of AF in MDA-MB-468 cells (Fig. 4a). We studied cells for apoptotic body formation and examined the percentage of cells in early apoptosis following their treatment with AF in comparison to those receiving Z-VAD-fmk pretreatment using the Annexin/PI study and phase contrast microscopy. Our results show Z-VAD-fmk appeared to protect cells from the apoptosis-inducing effects of AF indicating AF-induced apoptosis occurs in a caspase-dependent manner (Figs. 4a and 4b). Using the Alamar Blue™ assay, we determined that caspase inhibition diminishes the capacity for AF to inhibit cell growth (Fig. 4c). These results confirm that the growth inhibition and cell death of MDA-MB-468 cells induced by AF is mediated primarily by caspase-dependent pathways.
Figure 4.
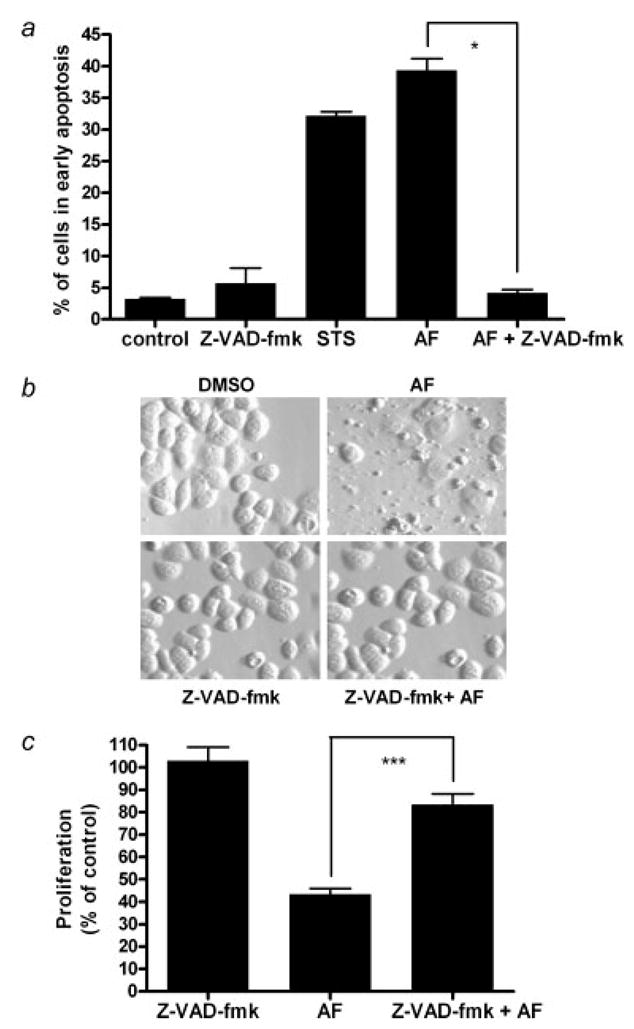
Caspases are involved in AF-induced growth inhibition and apoptosis. (a) In the Alamar Blue assay, cells were seeded in 96-well plates and allowed to attach overnight followed by treatment with AF alone or in combination with Z-VAD-fmk for 12 hr. Certain cells were pretreated with 100 μM Z-VAD-fmk for 1 hr prior to 1 μM AF treatment. Growth inhibition was analyzed using a microplate reader. Data are shown as mean of at least 3 independent experiments; bars, SEM where *p < 0.05 when comparing the indicated treatment groups. (b) Hoffman Modulation phase contrast microscopy (×40 magnification) was used to visualize the formation apoptotic bodies. Data for the microscopy studies are representative of at least 3 independent experiments producing similar results. (c) Annexin V-PI staining of cells was used to evaluate apoptosis and determine whether AF-induced apoptosis is caspase dependent. Data is reported as the mean of at least 3 independent experiments; bars, SEM. ***p < 0.001 when comparing the indicated treatment groups.
Effect of NAC on aminoflavone induced growth inhibition and apoptosis
NAC is an antioxidant and a reactive oxygen species scavenger which has been used extensively in experiments to help define the role of ROS in many in vitro and in vivo systems.37 To examine the relationship between AF-induced intracellular ROS production and cell growth inhibition, we pretreated the cells with NAC to investigate the effects of intracellular ROS depletion on AF-induced cell growth inhibition. MDA-MB-468 and T47D cells were exposed to AF (1 μM; 12 and 24 hr, respectively) following pretreatment with 25 mM NAC for 1 hr. NAC significantly inhibited the ability of AF to induce cytotoxicity and apoptosis in both breast cancer cell lines (Fig. 5a). The formation of apoptotic bodies increased following AF exposure in MDA-MB-468 cells and this effect was attenuated with NAC pretreatment (Fig. 5b). MDA-MB-468 cells were also pretreated with 25 mM NAC for 1 hr prior to 1 μM AF exposure and analyzed for caspase 3 activation. NAC partially inhibited AF-induced caspase 3 activation suggesting reactive oxygen species contribute to the ability of AF to induce caspase-dependent apoptosis (Fig. 5c). These results reveal a link between ROS formation and AF-induced growth inhibition and apoptosis in sensitive breast cancer cells.
Figure 5.

Growth inhibition, apoptosis and caspase activation by AF is attenuated by NAC. (a) In an Alamar Blue assay, MDA-MB-468 or T47D cells were seeded in 96-well or 6-cm2 tissue culture plates overnight followed by treatment with AF alone or following 1 hr pretreatment with NAC for 12 hr and 24 hr, respectively. Cells were pretreated with 20 mM NAC for 1 hr prior to AF (1 μM) treatment. Data are represented as mean of at least 3 independent experiments; bars, SEM where *p < 0.05 or **p < 0.01 when comparing the indicated treatment groups, (b) Hoffman Modulation phase contrast microscopy (×40 magnification) was used to determine whether reactive oxygen species might play a role in AF-induced apoptosis. MDA-MB-468 cells received vehicle, AF, NAC or NAC pretreatment followed by AF treatment as described in Materials and Methods. Data shown is representative of at least 3 independent experiments producing similar results. (c) A caspase 3 activity assay was performed to determine whether AF-induced caspase activation leading to apoptosis is dependent on reactive oxygen species formation. Data represent the mean of at least 3 independent experiments; bars, SEM where ***p < 0.001 when comparing the indicated treatment groups. (d) This schematic diagram represents the proposed mechanism by which AF mediates anticancer effects by modulating reactive oxygen species and inducing DNA damage and apoptosis in sensitive cancer cells. AF is converted into a metabolite, likely 3-OH AF which can induce ROS which results in caspase activation and apoptosis. Via a positive feedback loop, caspases can sustain ROS induction leading to DNA damage. Alternatively, ROS can themselves be produced from CYP which can damage DNA and lead to apoptotic responses.
Discussion
Aminoflavone is a novel anticancer agent that has been previously shown to display potent in vitro and in vivo antiproliferative activity against select human tumor cell lines. AF induces DNA single-strand break formation, DNA-protein cross-link formation, cell cycle arrest, histone γ-H2AX phosphorylation, CYP1A1 and CYP1A2 expression and its own metabolism in sensitive ER+ MCF-7 human breast cancer cells.3–6,8 Stabilization of p53 and increased expression of p21 have also been shown to occur in MCF-7 cells treated with AF.8,12 AF activates AhR signaling and induces apoptosis in MCF-7 cells.6,12 However, the exact mechanism by which AF displays its anticancer activity has not yet been fully elucidated. In this investigation, we provide additional information on the mechanism of anticancer activity for AF in an ER− breast cancer cell line, the first such study to date.
We demonstrate that AF induces growth inhibition and apoptosis in MDA-MB-468 cells in part by elevating ROS levels and caspase-3 activation resulting in oxidative DNA damage and cell death. These results indicate AF may serve as a plausible treatment option for some patients with ER− breast cancer. We determined that AF induced caspase-dependent growth inhibition and apoptosis. Caspases are often activated in response to oxidative stress.38
Oxidative stress is implicated in a number of cellular processes including apoptosis, and many chemotherapeutic agents are known to induce their cytotoxic effects to tumor cells by an ROS-mediated mechanism. Flavonoids are known to modulate oxidative stress as part of their mechanism of anticancer action, and thus we examined ROS production by AF, a synthetic flavonoid. We report in (Fig. 1c) that AF (3 hr, 1 μM) increases intracellular ROS levels and pretreatment of MDA-MB-468 cells with 20 mM NAC inhibited this effect. A decrease in intracellular ROS levels suggestive of an antioxidant effect occurred when MDA-MB-468 cells were treated with AF (10 μM, 6 hr) as compared with untreated controls which may indicate why DNA damage and apoptosis is less apparent at 10 μM as compared with 1 μM (data not shown). Flavonoids frequently exhibit both anti- and pro-oxidant characteristics depending on cell context.
There is evidence which suggests that ROS may act as signaling molecules for the initiation and execution of the apoptotic cell death program.33 In this investigation, we studied the role of ROS formation in AF-induced apoptosis of MDA-MB-468 cells. NAC was shown to inhibit AF-induced cytotoxicity and apoptosis (Figs. 5a–5c). ROS production, oxidation of cellular macromolecules and reduced glutathione, superoxide dismutase and catalase levels have all been observed in apoptotic processes.39 Therefore, AF induced-apoptosis in MDA-MB-468 cells appears to occur at least in part due to increased intracellular ROS.
The ability of the CYP1A1/CYP1A2 inhibitor α-NF to completely abolish AF-mediated ROS production (Fig. 1d) suggests CYP1A1 and CYP1A2 induced by AF serve as a major source of ROS formation and disrupt the redox state within sensitive cancer cells. It is also quite probable that AF is converted into an electrophilic species which increases ROS levels within these cells. Previous reports indicate that CYP1A2 metabolizes AF into a number of different species that have been characterized including a hydroxylated metabolite.11 A recent study suggests that flavonoid small molecules with hydroxylation in the 3 position have a greater propensity to demonstrate prooxidant characteristics than those lacking this substitution.40 We postulate that CYP1A2 promotes the metabolism of AF to a 3-hydroxylated derivative which may contribute to the prooxidant characteristics of AF as modeled in Figure 5d.
To determine whether a probable role exists for sulfotransferases in AF-induced ROS, MDA-MB-468 cells were pretreated cells with Nimesulide, a cyclooxygenase 2 inhibitor recently found to inhibit sulfotransferases41 with selectivity toward sulfotransferase 1A1 (one of the predominant sulfotransferases found to metabolize AF). Nimesulide lacks CYP inhibitory activity and showed negligible effects on AF-induced ROS in these cells (data not shown). This suggests that metabolites resulting directly from CYP1A-mediated AF activation contribute predominantly to AF-induced ROS formation. It is also possible that CYP1A1 and CYP1A2 convert AF into substrates for the sulfotransferases which form products that readily convert into a highly reactive nitrenium ion that contributes to the increase in ROS levels, an effect prevented by a CYP1A-specific inhibitor. Alternatively, sulfotransferases may play a more prominent role in AF-induced oxidative DNA damage and DPC formation in MDA-MB-468 cancer cells as a previous investigation has linked sulfotransferase expression in other sensitive cancer cells with this candidate agent’s ability to induce covalent DNA binding and DNA damage.10
In response to DNA damage, cyclin dependent kinase inhibitors arrest cell cycle progression, to provide sufficient time for DNA repair serving in checkpoint control. There are DNA damage checkpoints throughout the cell cycle.36 When MDA-MB-468 cells were treated with AF (1 μM; 12 hr), a substantial number of cells accumulated in the S phase of the cell cycle (Fig. 2c). This S phase arrest correlated with a time-dependent increase in p21 protein expression (Fig. 2d), which indicates DNA damage checkpoint activation.36 The induction of p21, a cyclin dependent kinase inhibitor (CKI), prevented the replication of damaged DNA.18 S phase arrest occurred due to the presence of DNA damage including oxidative DNA damage. The p21 induction observed may be independent of p53 activation because MDA-MB-468 cells have a mutated form of p53. It is possible p21 induction occurred through the MAPK pathway following ROS-induced cell cycle arrest. It is known that the MAPK pathway is subject to redox control and can transactivate the promoter of p21(waf1/cip1).24 The mechanisms governing DNA damage checkpoint in S phase are poorly understood, but previous studies have shown that suppression of the initiation and elongation stages of DNA replication may be involved.42,43
Cell cycle arrest can follow DNA damage. We show that AF induces DNA protein cross-link formation and S phase arrest in MDA-MB-468 cells similarly to what has been observed in MCF-7 cells. Since we discovered AF can increase intracellular ROS levels, we sought to determine whether it induced oxidative DNA damage by measuring 8-oxodG levels in MDA-MB-468 cells. The use of 8-oxodG as a DNA damage marker for oxidative stress is well documented.34 Our results show that AF caused an ~2-fold increase in 8-oxodG formation in MDA-MB-468 cells (Fig. 2a). This is significant since a 2-fold increase in 8-oxodG/dG formation is the maximal extent observed in mammalian cells when treated with prooxidant molecules.44 The increase in 8-oxodG/dG formation was readily attenuated in the presence of Z-VAD-fmk indicating caspase activation contributes to the induction of oxidative DNA damage. Previously AF was found to induce DPCs in MCF-7 cells.7,8 We demonstrate the ability of AF to induce DPC formation up to 6-fold as compared to untreated controls in MDA-MB-468 cells. Proteins can become cross-linked to DNA directly through oxidative free radical mechanisms.45 DPCs can be formed by topoisomerase inhibitors; yet, previous studies have shown that DPCs induced by AF are unrelated to topoisomerase cleavage complexes.8 Previous studies have characterized and identified covalent drug adducts which indicates that AF metabolite(s) alkylate DNA.8,11 Though AF may alkylate DNA, it likely possesses a mechanism of anticancer activity distinct from most alkylating agents also known to induce DPC formation. Studies are underway to identify the proteins involved in DPC formation following AF treatment which could shed additional light into its unique mechanism of action.
In conclusion, AF increases intracellular ROS resulting in oxidative DNA damage and induces S phase arrest and caspase-dependent apoptosis in MDA-MB-468 cells. NAC attenuates the antiproliferative effect of AF, suggesting that ROS production is also involved in the anticancer activity of AF. We found AF induced an increase in intracellular ROS levels in sensitive MCF-7, MDA-MB-468 and T-47D breast cancer cells, an effect that was absent in intrinsically resistant MDA-MB-435, MDA-MB-231 breast cancer cells and nonmalignant MCF10A cells (Fig. 1f). We have also shown that the antioxidant, NAC, can attenuate the cytotoxic effect of AF in both ER+ and ER− breast cancer cells (Fig. 5a). Thus, we can conclude that differential sensitivity to AF is at least in part ROS-linked. AF mediates ROS production in a CYP1A-dependent fashion. Based on findings in this study, cell susceptibility to oxidative stress induced by AF appears to correlate with cell responsiveness to the anticancer effects of this candidate agent. The involvement of ROS in AF-mediated anticancer activity represents an additional facet of its intriguing mechanism of action which includes its covalent binding to DNA resulting in DNA adduct and DNA protein cross-link formation following its bioactivation. It is anticipated that the extent AF can induce stress response genes in cells correlates with this candidate agent’s ability to exhibit anticancer activity in these cells. These stress response genes may serve as critical biomarkers for predicting patient responsiveness similar to sulfotransferase 1A1 and γ-H2AX as suggested in a previous investigation.10
Acknowledgments
We acknowledge the critical evaluation of this manuscript and helpful suggestions from Drs. Willie Davis, Carlos Casiano, Terry Brown-Bryan and Agus Darwanto. We also thank Louisa Amis, Judith Holbeck and Yayesh Asmeron for their technical assistance. We also thank M. Louisa Amis, Ms. Judith Holbeck and Ms. Yayesh Asmeron for their technical assistance.
Grant sponsor: National Institutes for General Medical Sciences; Grant number: 5R01GM41336; Grant sponsor: Center for Health Disparities; Grant number: 5P20 MD001632; Grant sponsor: NIH (Intramural Program of the Center for Cancer Research, National Cancer Institute).
Abbreviations
- 8-oxodG
8-oxo-7,8-dihydroguanine
- α-NF
α-Naphthoflavone
- AhR
aryl hydrocarbon receptor
- Aminoflavone (AF)
5-amino-2-(4-amino-3-fluorophenyl)-6,8-difluoro-7-methylchromen-4-one
- ANOVA
analysis of variance
- ARNT
aryl hydrocarbon nuclear translocator
- CYP1A1
cytochrome P450 1A1
- CYP1A2
cytochrome P450 1A2
- DCF
2′,7′-dichlorofluorescein
- DFAM
deferoxamine mesylate
- dG
2′-deoxyguanosine
- DMSO
dimethyl sulfoxide
- DPC
DNA-protein cross-links
- ER−
estrogen receptor negative
- ER+
estrogen receptor positive
- H2DCF-DA
2′,7′-dichlorodihydrofluorescein diacetate
- MAPK
mitogen-activated protein kinase
- NAC
N-acetyl-L-cysteine
- PARP
Poly [ADP-ribose] polymerase
- ROS
reactive oxygen species
- STS
Staurosporine
- Z-VAD-fmk
benzyloxycarbonyl-Val-Ala-DL-Asp(OMe)-fluoromethylketone
Footnotes
Portions of this work were presented at the 97th Annual American Association for Cancer Research meeting in Washington, DC, April 1–5, 2006.
References
- 1.Goetz MP, Rae JM, Suman VJ, Safgren SL, Ames MM, Visscher DW, Reynolds C, Couch FJ, Lingle WL, Flockhart DA, Desta Z, Perez EA, et al. Pharmacogenetics of tamoxifen biotransformation is associated with clinical outcomes of efficacy and hot flashes. J Clin Oncol. 2005;23:9312–18. doi: 10.1200/JCO.2005.03.3266. [DOI] [PubMed] [Google Scholar]
- 2.Stearns V, Davidson NE, Flockhart DA. Pharmacogenetics in the treatment of breast cancer. Pharmacogenomics J. 2004;4:143–53. doi: 10.1038/sj.tpj.6500242. [DOI] [PubMed] [Google Scholar]
- 3.Akama T, Shida Y, Sugaya T, Ishida H, Gomi K, Kasai M. Novel 5-aminoflavone derivatives as specific antitumor agents in breast cancer. J Med Chem. 1996;39:3461–9. doi: 10.1021/jm950938g. [DOI] [PubMed] [Google Scholar]
- 4.Akama T, Ishida H, Shida Y, Kimura U, Gomi K, Saito H, Fuse E, Kobayashi S, Yoda N, Kasai M. Design and synthesis of potent antitumor 5,4′-diaminoflavone derivatives based on metabolic considerations. J Med Chem. 1997;40:1894–900. doi: 10.1021/jm9700326. [DOI] [PubMed] [Google Scholar]
- 5.Akama T, Ishida H, Kimura U, Gomi K, Saito H. Structure-activity relationships of the 7-substituents of 5,4′-diamino-6,8,3′-trifluoroflavone, a potent antitumor agent. J Med Chem. 1998;41:2056–67. doi: 10.1021/jm970728z. [DOI] [PubMed] [Google Scholar]
- 6.Loaiza-Perez AI, Kenney S, Boswell J, Hollingshead M, Alley MC, Hose C, Ciolino HP, Yeh GC, Trepel JB, Vistica DT, Sausville EA. Aryl hydrocarbon receptor activation of an antitumor aminoflavone: basis of selective toxicity for MCF-7 breast tumor cells. Mol Cancer Ther. 2004;3:715–25. [PubMed] [Google Scholar]
- 7.Kuffel MJ, Schroeder JC, Pobst LJ, Naylor S, Reid JM, Kaufmann SH, Ames MM. Activation of the antitumor agent aminoflavone (NSC 686288) is mediated by induction of tumor cell cytochrome P450 1A1/1A2. Mol Pharmacol. 2002;62:143–53. doi: 10.1124/mol.62.1.143. [DOI] [PubMed] [Google Scholar]
- 8.Meng LH, Kohlhagen G, Liao ZY, Antony S, Sausville E, Pommier Y. DNA-protein cross-links and replication-dependent histone H2AX phosphorylation induced by aminoflavone (NSC 686288), a novel anticancer agent active against human breast cancer cells. Cancer Res. 2005;65:5337–43. doi: 10.1158/0008-5472.CAN-05-0003. [DOI] [PubMed] [Google Scholar]
- 9.Pobst LJ, Ames MM. CYP1A1 activation of aminoflavone leads to DNA damage in human tumor cell lines. Cancer Chemother Pharmacol. 2006;57:569–76. doi: 10.1007/s00280-005-0075-7. [DOI] [PubMed] [Google Scholar]
- 10.Meng LH, Shankavaram U, Chen C, Agama K, Fu HQ, Gonzalez FJ, Weinstein J, Pommier Y. Activation of aminoflavone (NSC 686288) by a sulfotransferase is required for the antiproliferative effect of the drug and for induction of histone γ-H2AX. Cancer Res. 2006;66:9656–64. doi: 10.1158/0008-5472.CAN-06-0796. [DOI] [PubMed] [Google Scholar]
- 11.Chen C, Meng L, Ma X, Krausz KW, Pommier Y, Idle JR, Gonzalez FJ. Urinary metabolite profiling reveals CYP1A2-mediated metabolism of NSC686288 (aminoflavone) J Pharmacol Exp Ther. 2006;318:1330–42. doi: 10.1124/jpet.106.105213. [DOI] [PMC free article] [PubMed] [Google Scholar]
- 12.Meng LH, Kohn KW, Pommier Y. Dose-response transition from cell cycle arrest to apoptosis with selective degradation of Mdm2 and p21(WAF1/CIP1) in response to the novel anticancer agent, aminoflavone (NSC 686288) Oncogene. 2007;26:4806–16. doi: 10.1038/sj.onc.1210283. [DOI] [PubMed] [Google Scholar]
- 13.Pasqualini JR. Steroid sulphotransferase activity in human hormone-independent MDA-MB-468 mammary cancer cells. Eur J Cancer. 1992;28A:758–62. doi: 10.1016/0959-8049(92)90110-n. [DOI] [PubMed] [Google Scholar]
- 14.Lin J, Jin X, Rothman K, Lin HJ, Tang H, Burke W. Modulation of signal transducer and activator of transcription 3 activities by p53 tumor suppressor in breast cancer cells. Cancer Res. 2002;62:376–80. [PubMed] [Google Scholar]
- 15.Bartek J, Iggo R, Gannon J, Lane DP. Genetic and immunochemical analysis of mutant p53 in human breast cancer cell lines. Oncogene. 1990;5:893–9. [PubMed] [Google Scholar]
- 16.Yaginuma Y, Westphal H. Abnormal structure and expression of the p53 gene in human ovarian carcinoma cell lines. Cancer Res. 1992;52:4196–9. [PubMed] [Google Scholar]
- 17.Dotto GP. p21(WAF1/Cip1): more than a break to the cell cycle? Biochim Biophys Acta. 2000;1471:M43–M56. doi: 10.1016/s0304-419x(00)00019-6. [DOI] [PubMed] [Google Scholar]
- 18.Vermeulen K, Van Bockstaele DR, Berneman ZN. The cell cycle: a review of regulation, deregulation and therapeutic targets in cancer. Cell Prolif. 2003;36:131–49. doi: 10.1046/j.1365-2184.2003.00266.x. [DOI] [PMC free article] [PubMed] [Google Scholar]
- 19.el-Deiry WS, Tokino T, Velculescu VE, Levy DB, Parsons R, Trent JM, Lin D, Mercer WE, Kinzler KW, Vogelstein B. WAF1, a potential mediator of p53 tumor suppression. Cell. 1993;75:817–25. doi: 10.1016/0092-8674(93)90500-p. [DOI] [PubMed] [Google Scholar]
- 20.Akashi M, Osawa Y, Koeffler HP, Hachiya M. p21WAF1 expression by an activator of protein kinase C is regulated mainly at the post-transcriptional level in cells lacking p53: important role of RNA stabilization. Biochem J. 1999;337 (Part 3):607–16. [PMC free article] [PubMed] [Google Scholar]
- 21.Gartel AL, Tyner AL. Transcriptional regulation of the p21((WAF1/CIP1)) gene. Exp Cell Res. 1999;246:280–9. doi: 10.1006/excr.1998.4319. [DOI] [PubMed] [Google Scholar]
- 22.Zeng YX, el-Deiry WS. Regulation of p21WAF1/CIP1 expression by p53-independent pathways. Oncogene. 1996;12:1557–64. [PubMed] [Google Scholar]
- 23.Kivinen L, Tsubari M, Haapajarvi T, Datto MB, Wang XF, Laiho M. Ras induces p21Cip1/Waf1 cyclin kinase inhibitor transcriptionally through Sp1-binding sites. Oncogene. 1999;18:6252–61. doi: 10.1038/sj.onc.1203000. [DOI] [PubMed] [Google Scholar]
- 24.Esposito F, Russo L, Chirico G, Ammendola R, Russo T, Cimino F. Regulation of p21waf1/cip1 expression by intracellular redox conditions. IUBMB Life. 2001;52:67–70. doi: 10.1080/15216540252774793. [DOI] [PubMed] [Google Scholar]
- 25.Azam S, Hadi N, Khan NU, Hadi SM. Prooxidant property of green tea polyphenols epicatechin and epigallocatechin-3-gallate: implications for anticancer properties. Toxicol In Vitro. 2004;18:555–61. doi: 10.1016/j.tiv.2003.12.012. [DOI] [PubMed] [Google Scholar]
- 26.Bhat SH, Azmi AS, Hadi SM. Prooxidant DNA breakage induced by caffeic acid in human peripheral lymphocytes: involvement of endogenous copper and a putative mechanism for anticancer properties. Toxicol Appl Pharmacol. 2007;218:249–55. doi: 10.1016/j.taap.2006.11.022. [DOI] [PubMed] [Google Scholar]
- 27.Johnson DE, Ochieng J, Evans SL. Phenylacetic acid halides inhibit estrogen receptor (ER)-positive MCF-7 cells, but not ER-negative human breast cancer cells or normal breast epithelial cells. Anticancer Drugs. 1996;7:288–92. doi: 10.1097/00001813-199605000-00008. [DOI] [PubMed] [Google Scholar]
- 28.Carrasco RA, Stamm NB, Patel BK. One-step cellular caspase-3/7 assay. Biotechniques. 2003;34:1064–7. doi: 10.2144/03345dd02. [DOI] [PubMed] [Google Scholar]
- 29.Weinstein JN, Myers TG, O’Connor PM, Friend SH, Fornace AJ, Jr, Kohn KW, Fojo T, Bates SE, Rubinstein LV, Anderson NL, Buolamwini JK, van Osdol WW, et al. An information-intensive approach to the molecular pharmacology of cancer. Science. 1997;275:343–9. doi: 10.1126/science.275.5298.343. [DOI] [PubMed] [Google Scholar]
- 30.Shao RG, Cao CX, Shimizu T, O’Connor PM, Kohn KW, Pommier Y. Abrogation of an S-phase checkpoint and potentiation of camptothecin cytotoxicity by 7-hydroxystaurosporine (UCN-01) in human cancer cell lines, possibly influenced by p53 function. Cancer Res. 1997;57:4029–35. [PubMed] [Google Scholar]
- 31.Shigenaga MK, Aboujaoude EN, Chen Q, Ames BN. Assays of oxidative DNA damage biomarkers 8-oxo-2′-deoxyguanosine and 8-oxoguanine in nuclear DNA and biological fluids by high-performance liquid chromatography with electrochemical detection. Methods Enzymol. 1994;234:16–33. doi: 10.1016/0076-6879(94)34073-0. [DOI] [PubMed] [Google Scholar]
- 32.Kohn KW. DNA filter elution: a window on DNA damage in mammalian cells. Bioessays. 1996;18:505–13. doi: 10.1002/bies.950180613. [DOI] [PubMed] [Google Scholar]
- 33.Carmody RJ, Cotter TG. Signalling apoptosis: a radical approach. Redox Rep. 2001;6:77–90. doi: 10.1179/135100001101536085. [DOI] [PubMed] [Google Scholar]
- 34.Evans MD, Dizdaroglu M, Cooke MS. Oxidative DNA damage and disease: induction, repair and significance. Mutat Res. 2004;567:1–61. doi: 10.1016/j.mrrev.2003.11.001. [DOI] [PubMed] [Google Scholar]
- 35.Klungland A, Bjelland S. Oxidative damage to purines in DNA: Role of mammalian Ogg1. DNA Repair (Amst) 2007;6:481–8. doi: 10.1016/j.dnarep.2006.10.012. [DOI] [PubMed] [Google Scholar]
- 36.Caldon CE, Daly RJ, Sutherland RL, Musgrove EA. Cell cycle control in breast cancer cells. J Cell Biochem. 2006;97:261–74. doi: 10.1002/jcb.20690. [DOI] [PubMed] [Google Scholar]
- 37.Zafarullah M, Li WQ, Sylvester J, Ahmad M. Molecular mechanisms of N-acetylcysteine actions. Cell Mol Life Sci. 2003;60:6–20. doi: 10.1007/s000180300001. [DOI] [PMC free article] [PubMed] [Google Scholar]
- 38.Ueda S, Masutani H, Nakamura H, Tanaka T, Ueno M, Yodoi J. Redox control of cell death. Antioxid Redox Signal. 2002;4:405–14. doi: 10.1089/15230860260196209. [DOI] [PubMed] [Google Scholar]
- 39.Kang DH. Oxidative stress, DNA damage, and breast cancer. AACN Clin Issues. 2002;13:540–9. doi: 10.1097/00044067-200211000-00007. [DOI] [PubMed] [Google Scholar]
- 40.Lee-Hilz YY, Boerboom AM, Westphal AH, Berkel WJ, Aarts JM, Rietjens IM. Pro-oxidant activity of flavonoids induces EpRE-mediated gene expression. Chem Res Toxicol. 2006;19:1499–505. doi: 10.1021/tx060157q. [DOI] [PubMed] [Google Scholar]
- 41.King RS, Ghosh AA, Wu J. Inhibition of human phenol and estrogen sulfotransferase by certain non-steroidal anti-inflammatory agents. Curr Drug Metab. 2006;7:745–53. doi: 10.2174/138920006778520615. [DOI] [PMC free article] [PubMed] [Google Scholar]
- 42.Painter RB. Inhibition of mammalian cell DNA synthesis by ionizing radiation. Int J Radiat Biol Relat Stud Phys Chem Med. 1986;49:771–81. doi: 10.1080/09553008514552981. [DOI] [PubMed] [Google Scholar]
- 43.Paulovich AG, Hartwell LH. A checkpoint regulates the rate of progression through S phase in S. cerevisiae in response to DNA damage Cell. 1995;82:841–7. doi: 10.1016/0092-8674(95)90481-6. [DOI] [PubMed] [Google Scholar]
- 44.Mobley JA, Brueggemeier RW. Increasing the DNA damage threshold in breast cancer cells. Toxicol Appl Pharmacol. 2002;180:219–26. doi: 10.1006/taap.2002.9391. [DOI] [PubMed] [Google Scholar]
- 45.Barker S, Weinfeld M, Murray D. DNA-protein crosslinks: their induction, repair, and biological consequences. Mutat Res. 2005;589:111–35. doi: 10.1016/j.mrrev.2004.11.003. [DOI] [PubMed] [Google Scholar]