Abstract
Neural activity generates increases in extracellular K+ concentration, [K+]0, which must be regulated in order to maintain normal brain function1. Glial cells are thought to play an important part in this regulation through the process of K+ spatial buffering2–4: K+-mediated current flow through glial cells redistributes extracellular K+ following localized [K+]0 increases. As is the case in other glia, the retinal Müller cell is permeable almost exclusively to K+ (ref. 5). Recent experiments6–8 have suggested that this K+ conductance may not be distributed uniformly over the cell surface. In the present study, two novel techniques have been used to assess the Müller cell K+ conductance distribution. The results demonstrate that 94% of all membrane conductance lies in the endfoot process of the cell. This strikingly asymmetric distribution has important consequences for theories concerning K+ buffering and should help to explain the generation of the electroretinogram.
Müller cell impedance was measured in enzymatically dissociated cells of the salamander (Ambystoma tigrinum), prepared as described in Fig. 1 legend. Cells were used within 2 h of isolation. Fine cellular processes, extending from the trunks of freshly dissociated cells, were resorbed within minutes of isolation and are not visible in Fig. 1. Depolarizing current pulses of 0.1–1.0 nA were passed through 3M potassium citrate pipettes (80–120 MΩ) and a bridge circuit, which was balanced before cell penetration. Any residual voltage drop across the pipette (measured following electrode withdrawal) was subtracted electronically from intracellular records. Results are summarized in Table 1.
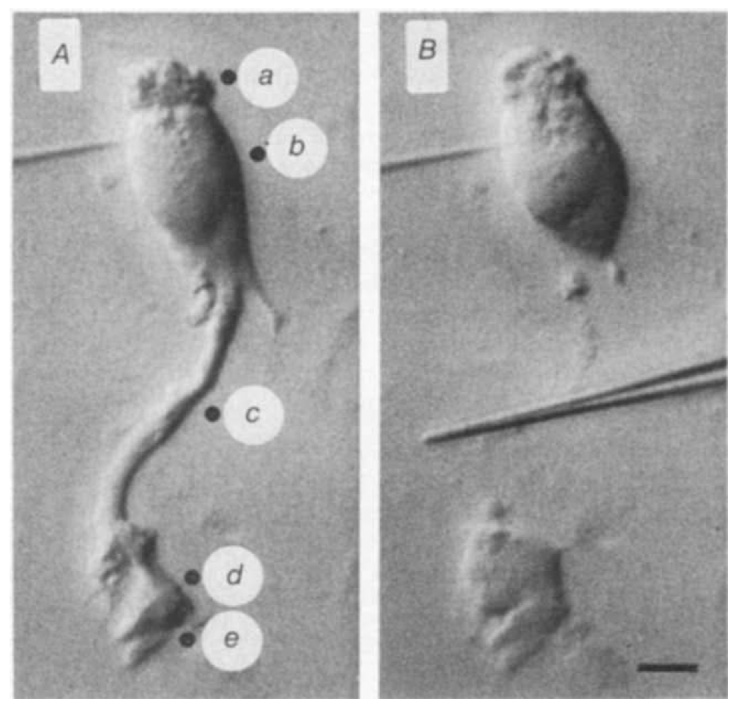
Fig. 1. Photomicrographs of a dissociated salamander Müiller cell viewed with Nomarski optics.
A, Intact cell penetrated in the nuclear region. Solid circles indicate locations of the K+-ejection pipette used in K+-ejection experiments. a, Distal end; b, nuclear region; c, stalk; d, lateral face of endfoot; e, proximal face of endfoot. B, Same cell after stalk has been cut by glass needle (shown in the centre of the photograph). Scale bar, 10 µm. Dissociated cells were prepared by incubating isolated retinae in Ringer’s solution containing papain (Sigma P-3125; 0.75 mg ml−1) for 30 min followed by gentle mechanical separation, as described previously16. The Ringer’s contained (in mM): 82.5 NaCl, 27.5 NaHCO3, 2.5 KC1, 1.8 CaCl2, 1.0 MgCl2, 10.0 dextrose, equilibrated with 5 % CO2 in O2. Dissociated cells adhered to the bottom of the recording chamber, a glass slide coated with gelatin and concanavalin A (Sigma C-2010).
Table 1.
Summary of impedance measurements in dissociated Müller cells
| Recording site | Condition of cell | Resistance (MΩ) |
Time constant (ms) |
Capacitance (pF) |
|---|---|---|---|---|
| Nuclear region | Intact | 8.8 ± 0.7 (55) | 0.95 ± 0.07 (40) | 149 ± 17 (40) |
| Cut | 140 ± 16 (30) | 12.5 ± 1.8 (29) | 94 ± 7 (29) | |
| Ratio cut/intact | 15.9 | 13.2 | 0.63 | |
| Endfoot | Intact | 12.5 ± 2.5 (14) | ||
| Cut | 15.8 ± 2.9 (8) | |||
| Ratio cut/intact | 1.26 |
Values ± s.e. are given. The sample size is indicated in parentheses. Capacitance values are calculated from the relation: capacitance = τ/resistance. Time constants were not measured for endfoot penetrations.
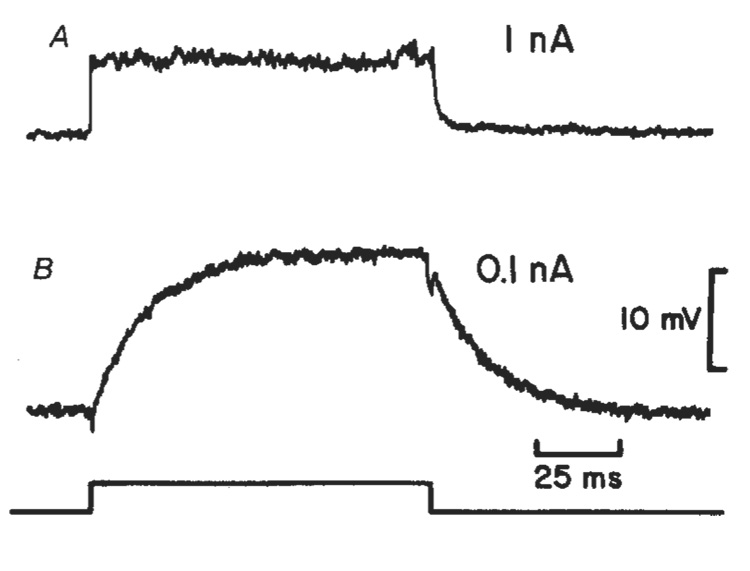
When Müller cells were penetrated near the nucleus (Fig. 1A) an average resistance of 8.8 MΩ and a membrane time constant (τ) of 0.95 ms were measured. If a large fraction of Müller cell conductance lies in the endfoot region, then cell resistance should increase markedly if the endfoot process is removed. To test this, the stalk of individual cells was compressed with a glass needle (Fig. 1B) while the cell impedance was monitored. The membrane potential dropped to near zero as the stalk was cut and then, in many cases, repolarized as the cut stalk re-sealed. When membrane impedance was measured again in these endfoot-shorn cells, the mean cell resistance had increased 16-fold to 140 MΩ. The mean value of τ had increased 13-fold to 12.5 ms. The impedance records from one cell are shown in Fig. 2. In this example, cell resistance increased 21-fold and τ increased 19-fold following removal of the endfoot process. The 16-fold increase in the mean cell resistance following endfoot removal indicates that 94% of the total conductance of an average cell lies at the proximal end of the cell, in or near the endfoot region.
Fig. 2. Müller cell depolarizations evoked by current pulses applied through an intracellular pipette in the nuclear region of the cell.
A, Response from an intact cell. Resistance = 7.4 MΩ; τ = 0.86 ms (1 nA current pulse). B, Response from the same cell after the endfoot process was severed. Resistance = 156 MΩ; τ = 16.7 ms (0.1 nA current pulse). The time course of the current pulse is indicated at the bottom.
In a parallel series of experiments, dissociated Müller cells were penetrated in the endfoot process. When the distal portion of the cell was severed, the mean cell resistance increased by only 26%. This small increase demonstrates that cutting the stalk does not, in itself, lead to a large resistance increase.
The high conductance of the endfoot membrane was susceptible to damage produced by microelectrode penetrations. When cells were impaled in the endfoot, measured cell impedance often rose during the penetration, particularly when the endfoot membrane was stressed mechanically. No similar rise in impedance occurred when other regions of the cell were penetrated. This lability of endfoot conductance presumably accounts for the larger impedance measured in endfoot penetrations of intact cells compared with that measured in penetrations near the nucleus (see Table 1). In addition, the conductance instability probably accounts for most of the 26% rise in impedance measured in endfoot penetrations when the distal portion of the cell was severed; following stalk bisection the isolated endfoot often appeared distorted (see Fig. 1B).
A second series of experiments was done to localize the region of high membrane conductance more accurately. Responses to local increases in [K+]0 were recorded from dissociated cells that were penetrated near the nucleus. [K+]0 increases were generated by pressure-ejecting an 85 mM KCl-Ringer's solution from an extracellular pipette positioned within a few micrometres of the cell surface. Results from one series of K+ ejections are shown in Fig. 3. A K+ ejection directed dt the proximal surface of the endfoot produced a response (Fig. 3e) whose peak amplitude was 16–29 times greater than responses evoked by ejections directed towards other regions of the cell (Fig. 3a–c). Furthermore, when the ejection pipette was moved only 11 µm, from the proximal (e) to the lateral (d) surface of the endfoot, the K+ response amplitude dropped by 79%.
Fig. 3. Responses of a dissociated Müller cell (penetrated near the nucleus) to K+ ejections from an extracellular pipette.
The labels correspond to ejection locations, shown in Fig. 1A. Each trace is an average of eight sweeps. Onset and duration of a 5-ms pressure pulse is indicated at the bottom. Traces a–c are expanded vertically fivefold relative to traces d and e.
Mean values of the peak amplitude of the K+ response (with the proximal endfoot response normalized to 100%) are as follows (n = 10): lateral endfoot surface (d), 26.3±3.7% (± s.e.); stalk (c) 5.7± 1.0%; nuclear region (b), 4.6±0.7%; distal end (a), 4.0±0.7%. Similar results were obtained from dissociated cells of frog (Rana pipiens) and turtle (Pseudemys scripta).
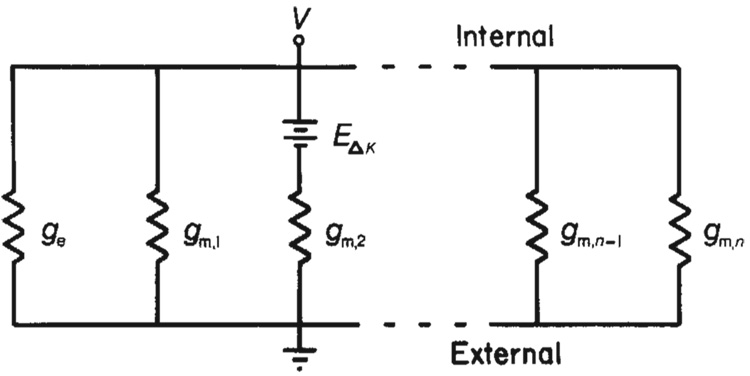
The amplitude of the response to a K+ ejection is directly proportional to the conductance of that portion of the membrane experiencing the [K+]0 increase (assuming equal areas of membrane exposed; see Fig. 4). Thus, the K+ ejection results confirm that Müller cell conductance is significantly greater in the endfoot process than in other regions of the cell. The results indicate further that the high membrane conductance is restricted largely to that portion of the endfoot surface facing the vitreous humour.
Fig. 4. Ohmic model of Müller cell simulates K+ ejection results.
The idealized cell is divided into n membrane segments each having conductance gm and one membrane segment having conductance ge, representing the high conductance endfoot. If we assume that a K+ ejection depolarizes a single membrane segment, the amplitude of a K+ ejection response can be calculated by interposing a voltage source in series with that membrane segment. This depolarization is represented by EΔK in the model. If the endfoot membrane segment is depolarized, the entire cell response, Ve, will equal EΔK ge/(ngm + ge). If a membrane segment in some other cell region is depolarized, the cell response, Vm, will equal EΔKgm/(ngm + ge). The ratio of responses, Ve/Vm, equals ge/gm. If more than one membrane segment is depolarized by a K+ ejection, the ratio of responses will be reduced. If five segments are depolarized equally by a K+ ejection, for example, the ratio of responses (endfoot to low conductance region) equals (ge + 4gm)/5gm, or roughly 1/5 of ge/gm when ge ≫ gm. During experimental K+ ejections directed towards the endfoot, an area significantly larger than the endfoot region was depolarized (unpublished observations). Consequently, the amplitude ratios of the responses shown in Fig. 3 lead to an underestimation of the value of the specific membrane conductance of the endfoot compared with the conductance of other cell regions. This analysis does not incorporate the effects of internal cell resistance on K+ responses. Internal resistance will, in fact, reduce the amplitude of the endfoot K+ response relative to the amplitudes of responses of cell segments nearer the recording site.
In summary, the results demonstrate that 94% of total Müller cell conductance is located within or adjacent to the proximally facing surface of the endfoot process. It appears that this membrane specialization will have an important effect on K+ regulation in the retina, functioning as a key component of a Müller cell K+ buffering system. Ninety-four per cent of all K+ flowing into Müller cells from regions of increased [K+]0 within the retina will exit through the endfoot process, directly into the vitreous humour. The vitreous, in turn, will function as a nearly infinite K+ sink. K+ will accumulate there until retinal [K+]o returns to normal. The spatial buffering system will then work in reverse, returning K+ to the retina from the vitreous.
Müller cells are believed to generate several components of the electroretinogram (ERG) 9–13 High endfoot conductance will have an important effect on the magnitude of these potentials. Theoretical calculations13 show, for instance, that the Müller cell produces an ERG b-wave potential five times larger than would be generated if K+ conductance were distributed uniformly throughout the cell.
Astrocytic glia in the central nervous system possess endfeet that lie adjacent to capillaries and the surface of the brain. If astrocyte endfeet have high K+ conductance as do Müller cells (a type of astrocyte) then K+ spatial buffering by astrocytes2–4 would be enhanced. High astrocytic endfoot conductance would direct excess extracellular K+ directly into capillaries and the cerebrospinal fluid. The magnitude and orientation of field potentials generated by these cells14,15, including components of the electroencephalogram, would also be altered by high endfoot conductance.
Acknowledgments
I thank P. H. Hartline for his valuable assistance during this work and P. H. Hartline and J. I. Gepner for their comments on the manuscript. This work was supported by NIH grant EY04077.
References
- 1.Gardner-Medwin AR. J. exp. Biol. 1981;95:111–127. doi: 10.1242/jeb.95.1.111. [DOI] [PubMed] [Google Scholar]
- 2.Orkand RK, Nicholls JG, Kuffler SW. J. Neurophysiol. 1966;29:788–806. doi: 10.1152/jn.1966.29.4.788. [DOI] [PubMed] [Google Scholar]
- 3.Trachtenberg MC, Pollen DA. Science. 1969;167:1248–1252. doi: 10.1126/science.167.3922.1248. [DOI] [PubMed] [Google Scholar]
- 4.Gardner-Medwin AR. J. Physiol, Lond. 1983;335:393–426. doi: 10.1113/jphysiol.1983.sp014541. [DOI] [PMC free article] [PubMed] [Google Scholar]
- 5.Newman EA. Soc. Neurosci. abstr. 1981;7:275. [Google Scholar]
- 6.Newman EA. Vision Res. 1979;19:227–234. doi: 10.1016/0042-6989(79)90167-6. [DOI] [PubMed] [Google Scholar]
- 7.Fujimoto M, Tomita T. Brain Res. 1981;204:51–64. doi: 10.1016/0006-8993(81)90651-x. [DOI] [PubMed] [Google Scholar]
- 8.Newman EA. Soc. Neurosci. abstr. 1983;9:807. [Google Scholar]
- 9.Faber DS. thesis. Buffalo: Univ. New York; 1969. [Google Scholar]
- 10.Miller RF, Dowling JE. J Neurophysiol. 1970;33:323–341. doi: 10.1152/jn.1970.33.3.323. [DOI] [PubMed] [Google Scholar]
- 11.Karwoski CJ, Proenza LM. J. Neurophysiol. 1977;40:244–259. doi: 10.1152/jn.1977.40.2.244. [DOI] [PubMed] [Google Scholar]
- 12.Newman EA. J. Neurophysiol. 1980;43:1355–1366. doi: 10.1152/jn.1980.43.5.1355. [DOI] [PubMed] [Google Scholar]
- 13.Newman EA, Odette LL. J Neurophysiol. 1984;51:164–182. doi: 10.1152/jn.1984.51.1.164. [DOI] [PubMed] [Google Scholar]
- 14.Cohen MW. J. Physiol, Lond. 1970;210:565–580. doi: 10.1113/jphysiol.1970.sp009227. [DOI] [PMC free article] [PubMed] [Google Scholar]
- 15.Castellucci VF, Goldring S. Electroenceph. clin. Neurophysiol. 1970;28:109–118. doi: 10.1016/0013-4694(70)90178-1. [DOI] [PubMed] [Google Scholar]
- 16.Bader CR, Macleish, Schwartz EA. J. Physiol, Lond. 1979;296:1–26. doi: 10.1113/jphysiol.1979.sp012988. [DOI] [PMC free article] [PubMed] [Google Scholar]


