

Abstract
Orbitofrontal cortex (OFC) neurons encode rewards and the cues that predict them, providing a neural substrate for outcome expectancy, an important component of goal-directed behavior in animals and humans. Here, we recorded and analyzed single units from rat lateral OFC during performance of a task in which the encoding of an expected rewarding outcome could be isolated from the response made in obtaining it. We found concurrent encoding of the expected outcome and the behavioral response in mostly separate populations of OFC units, in each phase of task performance: odor sampling, behavioral response, and waiting during the delay before reward delivery. Population analyses showed that outcome encoding broadly spanned across each behavioral phase, whereas response-selective firings were time-locked to the behavioral events, especially the completion of the behavioral response. A significant subset of outcome-selective units maintained selective firings from either odor sampling or response initiation until reward delivery. In contrast, response-selective units typically showed transient activation time locked to the behavioral events and were less likely to maintain selective firings across behavioral phases than outcome-selective units. These data demonstrate a broader role of OFC information processing in goal-directed behavior, beyond its widely recognized role in outcome expectancy.
Keywords: orbitofrontal cortex, orbital cortex, expected reward, behavioral response, associative learning, goal-directed behavior
Introduction
A need for behavioral control occurs in settings with multiple response options. Flexibility in choosing among options is also needed according to the prevailing conditions at the time a choice is made. Much research in recent years has forged a broad consensus on the important role of orbitofrontal cortex (OFC) in goal-directed behavior. Specifically, studies of patients, as well as studies of laboratory animals with selective brain damage, have indicated that the OFC is critical for behavioral guidance based on the representation of rewards (Bechara et al., 2000; Baxter and Murray, 2002; Holland and Gallagher, 2004).
In single-unit recordings in monkeys and rodents, the encoding characteristics of OFC neurons have consistently shown the presence of neuronal correlates of rewards, such as foods or liquids, and of the sensory cues that predict them (Thorpe et al., 1983; Schoenbaum et al., 1998, 2003a; Tremblay and Schultz, 1999). Moreover, manipulations of reward value, including reversal training (Rolls et al., 1996; Schoenbaum et al., 1999), sensory-specific satiation of primary rewards (Critchley and Rolls, 1996), or substitution of rewards with a larger or smaller value (Tremblay and Schultz, 1999), are shown to alter neuronal firing to the rewards themselves and to predictive cues. Functional neuroimaging studies have substantially corroborated such findings in humans (for review, see Dolan, 2007).
Given its role in goal-directed behavior, it is notable that single-unit recordings in well controlled tasks have failed to identify neuronal correlates of behavioral responses in monkey OFC during task performance (Tremblay and Schultz, 2000; Wallis and Miller, 2003; Padoa-Schioppa and Assad, 2006). These observations led to the proposal that OFC encodes the value of primary rewards and associated sensory cues independent of responses required to obtain reward (Hollerman et al., 2000; Wallis, 2007). Previous electrophysiological studies of neurons in rat OFC, however, have shown selective activity associated with behavioral responses when such responses are directed to the location of reward (for review, see Furuyashiki and Gallagher, 2007; Feierstein et al., 2006; Roesch et al., 2006). Although such encoding could be driven by anticipation of reward as the outcome of goal-directed action in those investigations, the recording studies in primates have typically used behavioral responses, such as a saccade to a visual cue or manipulation of a lever, not directly associated with the location of reward delivery. At the same time, the experimental designs used to identify response correlates in rodent OFC have not strictly isolated encoding of expected outcomes from the behavioral response itself. To address this issue, we recorded single units from OFC while rats were performing an instrumental odor discrimination task, in which the stimulus–response and stimulus–outcome relationships could be independently analyzed. We found that rodent OFC concurrently encodes the expected outcome and responses directed to reward in mostly distinct populations of neurons. Moreover, encoding of outcome expectancy was typically maintained from either cue sampling or response initiation until reward delivery, whereas response-selective activity was predominantly synchronized to specific behavioral events within the epochs of task performance.
Materials and Methods
All procedures were conducted at Johns Hopkins University in accordance with University and National Institutes of Health guidelines. Five male Long–Evans rats (Charles River Laboratories, Wilmington, MA) weighing 450–550 g at the time of surgery were used in this study. Rats were singly housed and maintained under the regular light/dark cycle (7:00 A.M. to 7:00 P.M. for the light period). Experiments were conducted during the light portion of the cycle.
Odor discrimination instrumental task.
Rats were maintained with restricted access to water during the experiment; access was provided for 15 min after daily recording sessions. Behavioral training and recordings were conducted in behavioral apparatus as described previously (Schoenbaum et al., 1999), except that two fluid wells instead of one were symmetrically located below an odor sampling port. A fixed set of four odors (citrus oil, hexenol, tuberose ollifac, and merion) chosen from odorant samples kindly gifted by International Flavors and Fragrances (New York, NY) were used throughout this study. One of the four odors was selected for each trial pseudorandomly, such that the same two odors were presented in no more than four trials in series. Air flow saturated with a selected odor was diluted with an equal volume of fresh air and used as an odor stimulus. After house lights were turned on to signal the beginning of the trial, a rat was required to make a nose poke at the odor sampling port (“odor poke”) to sample the odor stimulus, which was presented at a variable delay (500–1000 ms) after the odor poke. Depending on the odor identity (see Fig. 1A), rats were required to respond to either left or right fluid wells within 5 s (“response”). If the response was incorrect (“error trials”), the trial was aborted with no behavioral consequence. If a rat responded correctly, the nose poke was maintained during a randomized delay interval between 500 and 1500 ms (“correct trials”) to receive reward. Then, 50 μl of either 5% sucrose or water was delivered at the fluid well (“reward delivery”) (see Fig. 1A). Five critical behavioral phases were defined for single-unit analyses: the “odor presentation” phase, in which odor cues are delivered; the “response” phase, during which a rat is making a behavioral response; the “reward-waiting” phase, in which a rat is waiting for the reward after the correct response is made; the “consumption” phase, during which a rat is consuming reward after its delivery; and the “intertrial interval,” which is defined as 1 s before the trial begins. The response latency was defined as the interval between the odor onset and the odor unpoke. The motion time was measured as the duration between the odor unpoke and the fluid-well poke.
Figure 1.
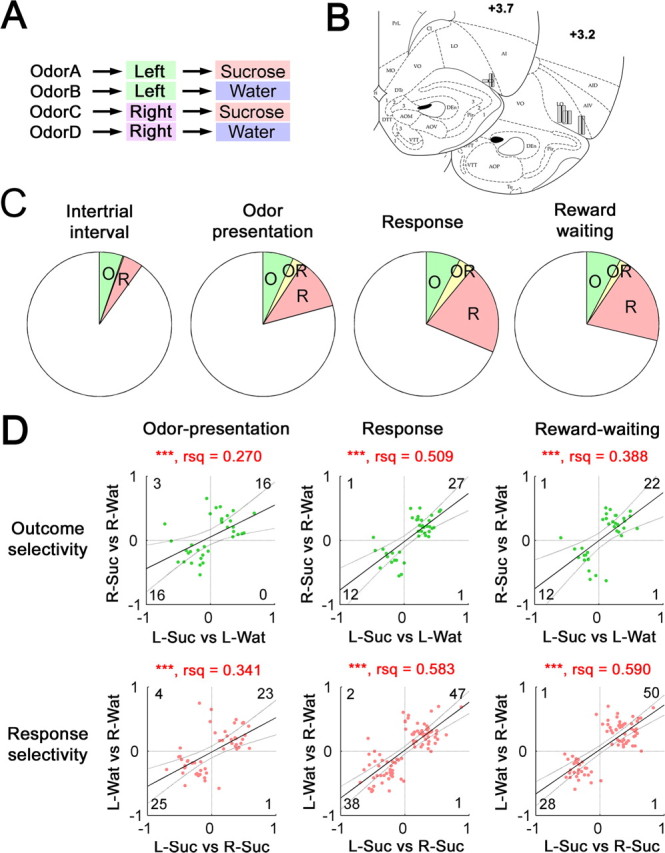
Outcome- and response-selective units in the OFC before reward delivery. A, A diagram of contingencies in the instrumental odor discrimination task. Each of four odors (odors A, B, C, and D) was associated with a distinct combination of a behavioral response (left or right) and an outcome (sucrose or water). B, Recording sites in the OFC mapped onto the rat brain atlas (for abbreviations, see Paxinos and Watson, 1998). C, Proportions of outcome- and response-selective units during the intertrial interval, the odor presentation phase, the response phase, and the reward-waiting phase. Proportions of units selective to the outcome but not to the response (O), units selective to the response but not to the outcome (R), and units selective to both the outcome and the response (OR) are shown. D, Comparisons of two selectivity indices of outcome- or response-selective units from trials with different responses or outcomes, respectively. The top three plots show the outcome-selectivity index in left trials [left sucrose trials (L-Suc) vs left water trials (L-Wat), abscissa] and that in right trials [right sucrose trials (R-Suc) vs right water trials (R-Wat), ordinate], with positive and negative values for higher activities in sucrose and water trials, respectively, than the other trial type. Green dots show individual units selective to the outcome in each behavioral phase. In the bottom three graphs, the response-selectivity index in sucrose trials (L-Suc vs R-Suc, abscissa) and that in water trials (L-Wat vs R-Wat, ordinate) were plotted, with positive and negative values for higher activities in left and right trials, respectively, than the other trial type. Red dots indicate individual units selective to the response in each behavioral phase. Units for which no spikes were obtained in a given comparison group were excluded. Solid and dotted lines indicate the linear fit and its 95% confidence interval. Degree of freedom-adjusted coefficient of determination is also shown (rsq). The number in each quadrant is of units in the corresponding quadrant. Note that two selectivity indices of each type, response or outcome, show significant positive correlations in all behavioral phases. ***p < 0.001.
Single-unit recording.
A driveable microelectrode assembly with 10 nichrome (FeNiCr) wires insulated with formvar at 25 μm (Stablohm 675; California Fine Wire, Grover Beach, CA) or 18 μm (A-M Systems, Carlsborg, WA) thickness was stereotaxically located slightly above lateral OFC according to previous studies (Schoenbaum et al., 2003a) (3.0 mm anterior from the bregma, 3.2 mm lateral from the midline, and 4.0 mm from the brain surface). Electrodes were platinum plated, such that resultant impedances ranged between 250 and 1500 kΩ at 100 Hz. Neuronal spikes were recorded with the Plexon (Dallas, TX) Multiple Acquisition Processor. The gain and threshold were adjusted to obtain signals that exceeded 2.5 times the noise level. Electrodes were advanced by 40 μm after a session to acquire new neurons in the following day. The resultant 422 single units were isolated off-line, using the principal component analysis of waveforms with the Offline Sorter (Plexon). These units were classified into two classes according to the waveform shape: ones with waveforms of a short peak-to-peak duration between 200 and 400 μs and others with waveforms of a relatively long peak-to-peak duration longer than 500 μs. The former class was consistent with properties reported as putative fast-spiking interneurons (Wilson et al., 1994). The arbitrary threshold was set between 400 and 500 μs for unit classification. Putative fast-spiking interneurons (42 units) were excluded from our analyses, and 380 remaining units were analyzed. After the electrodes passed the region of interest and before rats were killed, a small amount of current (15–20 μA) was passed for 10 s through each electrode connected to anode. Then rats were transcardially perfused with 0.1 m sodium phosphate buffer, pH 7.2–7.4, containing 10% formalin, 4% potassium ferrocyanide (Sigma-Aldrich, St. Louis, MO), and 4% glacial acetic acid. The electrode location was identified as a blue iron deposit, or electrolytic damage, or both.
Data analyses.
Time stamps of spikes and behavioral events were analyzed using custom-made Matlab programs (MathWorks, Natick, MA). Sessions in which the accuracy did not exceed 80% in total or 75% for any trial type were not included in our dataset. The average performance in the included sessions was 98.8 ± 0.2% (65 sessions from five rats), and the behavioral performance was highly stable within and across behavioral sessions. Each session included 61.9 ± 3.2 correct trials on average with trial numbers equally distributed across contingencies.
To identify units selective to the response or the outcome, spike rates in individual trials were calculated by dividing numbers of spikes during each behavioral phase by its phase duration. These durations varied across trials according to the behavioral performance, and the variable delays imposed, as described previously. Because OFC units fired at various time points during task performance, even within a single behavioral phase (see Results), spike rates in the entire duration of each behavioral phase were used throughout this study, except in supplemental Figure 5 (available at www.jneurosci.org as supplemental material). The mean ± SD durations of the odor presentation, response, and reward-waiting phases were 628.5 ± 209 ms, 508 ± 235 ms, and 1106 ± 287 ms, respectively. Then spike rates from valid left trials and those from valid right trials were statistically compared by the Mann–Whitney test (α = 0.05) to identify response-selective firings in each behavioral phase. Outcome-selective firings were identified in the same manner except that spike rates from valid sucrose trials and those from valid water trials were compared. To simultaneously examine the potential interactions of outcome and response coding of units within a behavioral phase, we performed two-way ANOVAs on the activity of each outcome or response-selective unit (α = 0.05).
To calculate response- and outcome-selectivity indices, we drew a receiver operating characteristic curve for two groups of spike rates from each unit, and determined the area under the curve, which was rescaled to a range between −1 and 1 to obtain the selectivity index (supplemental Fig. 1, available at www.jneurosci.org as supplemental material), as described previously (Feierstein et al., 2006). Correlations between two selectivity indices as well as confidence intervals and degree of adjusted coefficient of determination (R2) were calculated by the least-squares fitting method using a built-in Matlab function (see Figs. 1D, 6). Because of questions about the normality of the sample distribution obtained, we also performed nonparametric Spearman's rank correlations (supplemental Figs. 2, 3, available at www.jneurosci.org as supplemental material). In this procedure, each measurement of a variable was ranked, and Spearman's correlation coefficients and associated p values were calculated using a built-in Matlab function.
Figure 6.

The relationship of response-selective encoding to the odor stimulus and the behavioral response in the analysis of error trials. The top illustrates a method to discriminate odor cue-related selectivity and response-related selectivity. Opposite relationships between the odor cue and the behavioral response in correct and error trials dissociate these two types of selectivity. Cue-related activity should show higher spike rates (indicated in boxes) with the same odors (OdorA/B in this diagram), but with the opposite responses, in correct and error trials. However, response-related activity should be activated more in trials with the same response (left responses in this diagram), but with the different odor pairs. In the bottom graphs, response selectivity indices in correct and error trials were plotted in each behavioral phase for units that were response-selective in the odor presentation (left), response (center), or reward-waiting (right) phase. Selectivity indices were defined to be positive for units that were more active in trials with two odors instructing left responses than in trials with the other two odors instructing right responses. Thus, positive and negative indices represent higher activity associated with left and right responses, respectively, in correct trials, but right and left responses, respectively, in error trials. The lines, numbers, and markers are the same as in Figure 1D. rsq, Degree of freedom-adjusted coefficient of determination.
The difference between preferred and nonpreferred activities in the population perievent spike histograms (see Fig. 2) was assessed statistically using the “bootstrap” method. Briefly, a distribution of the average difference between preferred and nonpreferred activities was generated by randomly shuffling designation of those activities 2000 times. The 99.744% confidence interval (α = 0.00256) for the simulated differences in the 2000 samples was determined at each time point (bin). This α value was chosen to limit the false-positive rate across the entire 20-bin analysis period within 5% for each graph. If the actual difference at a given time point fell outside this confidence interval, the difference was considered to be statistically significant at that point.
Figure 2.
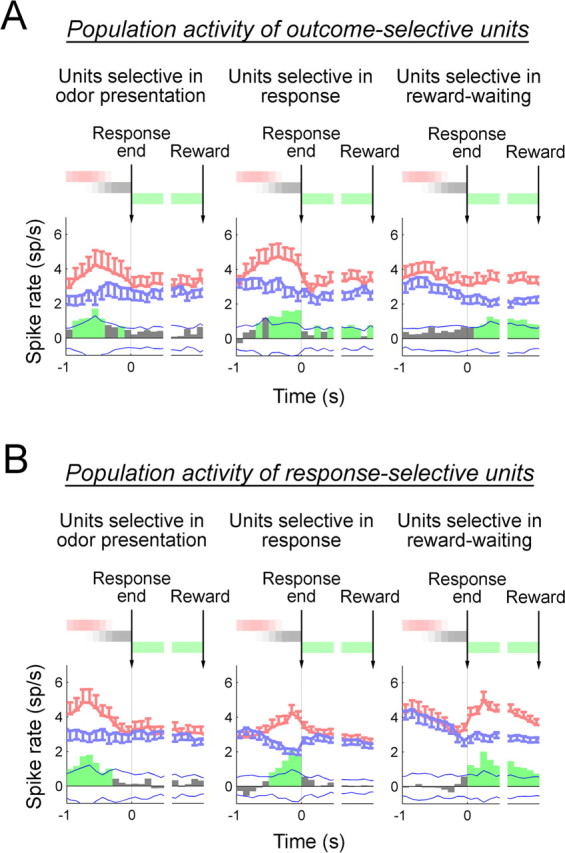
Population analyses of outcome- and response-selective populations. A, B, Perievent spike histograms of outcome-selective populations (A) and response-selective populations (B). Histograms relative to the time of response completion and reward delivery were drawn for units selective during the odor presentation, response, or reward-waiting phase separately, as indicated above each graph. Thick red and blue lines in each graph show activities in preferred and nonpreferred trials. Error bars indicate SEM across units at respective time points. Preferred and nonpreferred trials were defined for each unit as the trial type (either sucrose or water trials for outcome-selective units, and either left or right trials for response-selective units) in which the activity during a relevant behavioral phase was the higher or lower, respectively. The difference between activities in preferred and nonpreferred trials was averaged across units in each population, and is shown in bar graphs at the bottom of each graph. The statistical significance of the difference was calculated using the bootstrap method. The α value at each time point was set 0.00256 so that the false-positive rate during the entire analysis period (20 bins) is <5% for each graph. Two blue thin lines in each graph show the confidence interval with this criterion of the difference of randomly shuffled activities (for details, see Materials and Methods). Bars that exceed these lines are thus considered to be statistically significant and are shown in green. The colored bars above each graph represent the durations of the odor presentation (red), response (gray), and reward-waiting (green) phases. Spike rates were calculated in the time window of 100 ms.
The binomial test (χ2 test) was used to test whether the number of units that showed statistical significance was significantly higher than the number expected from a statistical threshold. To test whether the selectivity in two behavioral phases (Table 1) or outcome and response selectivity within a phase (Table 3) occurred independently, we used the binomial test for mutual independence (Zar, 1999). Briefly, based on the actual probabilities of units that were selective in each behavioral phase, we calculated the expected probability of units in each selectivity condition (i.e., those selective in both behavioral phases, those selective in only one behavioral phase, and those not selective in either phase), assuming that the selectivity in two behavioral phases was independent. Then we calculated χ2 by calculating the sum of the adjusted squared differences between the expected and actual numbers [(actual number in each condition minus expected number in each condition)2/(expected number in each condition)] and determined the statistical significance based on the χ2 distribution (1 df).
Table 1.
Numbers of units that showed outcome and response selectivity in one or more behavioral phases
| Odor presentation | Response | Reward waiting | |
|---|---|---|---|
| Outcome-selective units | |||
| Odor presentation | 35* | 8 (7)*** | 6 (5)** |
| Response | 42* | 8 (7)*** | |
| Reward waiting | 36* | ||
| Response-selective units | |||
| Odor presentation | 53* | 21 (13)**** | 18 (10)*** |
| Response | 90* | 26 (17)*** | |
| Reward waiting | 80* |
Each entry along the diagonal shows the total number of units selective in the corresponding behavioral phase. The remaining entries show the number of units with selectivity in two behavioral phases (as designated by the row and column headings; e.g., the top center entry is for the number of units selective in both the odor presentation and response phases). In parentheses, the number of units that showed selectivity for the same option in both phases is indicated (e.g., for the top center entry under Outcome-selective units, 7 of 8 units had the same outcome selectivity in both phases). A total 380 units are included in this analysis. *p < 0.001 for the binomial test for numbers of units selective to either outcome or response in each phase; **p = 0.104, ***p < 0.05, and ****p < 0.01 for the binomial test for mutual independence regarding whether the selectivity in two phases occurred independently (for details, see Materials and Methods).
Table 3.
The number of outcome- and response-selective units that showed particular combinations of outcome and response selectivity
| Selective for both outcome and response | Interaction with response selectivity | Interaction with outcome selectivity | Outcome-selective only | Response-selective only | |
|---|---|---|---|---|---|
| Outcome-selective units | |||||
| Odor presentation | 9 (26%)* | 2 (6%) | 24 (69%) | ||
| Response | 13 (31%) | 1 (2%) | 28 (67%) | ||
| Reward waiting | 7 (19%) | 2 (6%) | 27 (75%) | ||
| Response-selective units | |||||
| Odor presentation | 9 (17%)* | 6 (11%) | 38 (72%) | ||
| Response | 13 (14%) | 9 (10%) | 68 (76%) | ||
| Reward waiting | 7 (9%) | 7 (9%) | 66 (83%) |
The table shows the number of outcome- and response-selective units that showed particular combinations of outcome and response selectivity, namely, significant joint (outcome and response) selectivity (p < 0.05, by Mann–Whitney test) or outcome × response interactions (p < 0.05, by two-way ANOVA). Each column shows the numbers of units in each condition indicated by the column heading. The percentage of units in each cell out of all the units that were selective in the corresponding behavioral phase is shown in the parentheses. The numbers in the left column (Selective for both outcome and response) for both outcome- and response-selective units are from identical units. Only during the odor presentation phase were there significantly more neurons that encoded both outcome and response than would be expected by chance. *p = 0.035 for the binomial test for mutual independence of outcome and response selectivity in each phase (for details, see Materials and Methods).
The distribution of selective activity within a behavioral phase (see Fig. 3) was examined using bootstrap statistics based on the cumulative difference between the numbers of spikes in preferred and nonpreferred trials as a function of time (“cumulative selectivity”) (see Fig. 3A, red line). Given that the duration of the behavioral phase considerably varied across trials, time stamps of spikes were normalized to the phase duration in each trial and rescaled between 0 and 1 (i.e., the beginning and end of the behavioral phase) (see Fig. 3A, abscissa). By definition, this curve is the line that starts from the origin and ends at a positive value that is the difference between the total numbers of spikes in preferred and nonpreferred trials in the analyzed behavioral phase. If the selectivity distribution were random, the cumulative-selectivity curve should be ideally approximated by a straight line connecting the same two points (see Fig. 3A, black line). However, if the distribution were skewed to a behavioral event, at either the beginning or end of the behavioral phase, the cumulative-selectivity curve should deviate above or below, respectively. Thus, this statistical analysis is to determine whether the actual cumulative-selectivity curve is significantly different from a straight line. The distribution of the hypothetical cumulative-selectivity curves assuming the randomized selectivity distribution and its confidence interval (see Fig. 3A, shaded area) was estimated by shuffling time stamps across spikes in preferred and nonpreferred trials (500 times), keeping the numbers of spikes in preferred and nonpreferred trials constant. The selectivity distribution was considered to be nonuniform, when the cumulative-selectivity curve fell outside the determined confidence interval at >10% of time points. Although this statistical criterion itself is arbitrary, the α value at single time points was determined for each unit, such that the false-positive rate for the entire analysis was <5%. Thus, the α value for each time point was decremented from 0.1 stepwise by 0.001, and the actual false-positive rate for the entire analysis was estimated from independently simulated samples of the cumulative-selectivity curve with random selectivity distribution. Then, the α value was selected when the false-positive rate according to the above criterion became not to exceed 5% in two consecutive sample sets (500 samples each) of the randomized cumulative-selectivity curve.
Figure 3.
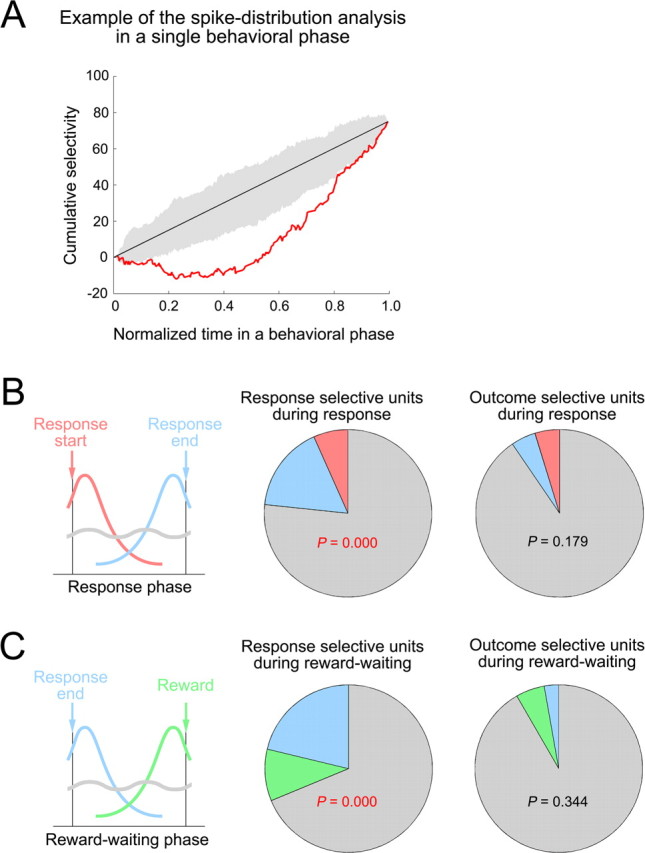
The distribution of response- and outcome-selective activity within a single behavioral phase. A, Illustration of the selectivity distribution within a single behavioral phase. This bootstrap statistic used the cumulative difference between the numbers of spikes for single neurons in preferred and nonpreferred trials as a function of time (cumulative selectivity; red line). Time stamps of spikes were normalized to the phase duration in each trial and rescaled between 0 and 1 (abscissa). If the selectivity distribution was uniform over the entire duration of a behavioral phase, the cumulative activity function should approximate a straight line (black line). However, if selective activity occurred near the beginning or end of the analyzed behavioral phase, the curve should deviate upward or downward, respectively. The confidence interval of the cumulative-selectivity curve, shown in the shaded area, assuming random selectivity distributions, was determined for each unit such that the false-positive rate for an analysis was expected to be <5%. In this example, a single unit that had response selectivity in the response phase was analyzed. The cumulative-selectivity curve fell below from the confidence interval of the cumulative-selectivity curve. Thus, the distribution of the response-selective activity of this unit during the response phase was considered to be significantly skewed toward response completion. For more details, see Materials and Methods. B, Response- and outcome-selective units in the response phase were classified using the analysis described in A. The proportions of response- (middle) and outcome-selective (right) units whose selective activities in the response phase were distributed near the response initiation (red) or the response completion (blue), or without a significant bias (gray) are shown. C, Response and outcome-selective units in the reward-waiting phase were classified similarly. The proportions of response- (middle) and outcome-selective (right) units whose selective activities in the reward-waiting phase were distributed near response completion (blue) or reward delivery (green), or without a significant bias (gray) are shown. The p value in each pie chart was derived from the χ2 analysis for the number of units with a nonuniform selectivity distribution with respect to chance level (α = 0.05).
Finally, in Figure 7, B and C, the Kolmogorov–Smirnov test was used to compare two distributions.
Figure 7.
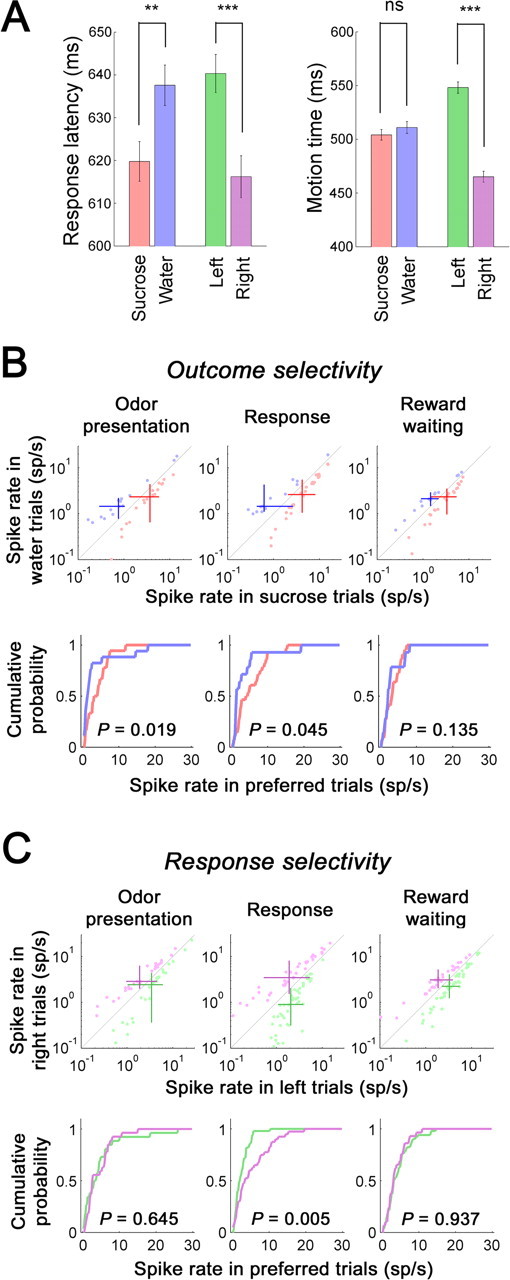
Activities of outcome- and response-selective units depended on the content of selective encoding. A, The response latency and the motion time in trials with different outcomes or responses. Averaged response latency (left) and motion time (right) in sucrose and water trials and in left and right trials were plotted as means ± SE. A significant difference was shown for the response latency between sucrose and water trials and for both the response latency and motion time in comparisons between left and right trials (2021 sucrose trials, 1951 water trials, 2028 left trials, and 1944 right trials). **p < 0.01; ***p < 0.001. ns, Nonsignificant difference. B, In the top, spike rates in each behavioral phase of sucrose trials (abscissa) and water trials (ordinate) for units that were selective to the outcome in the odor presentation (left), response (center), or reward-waiting (right) phase are shown. Red and blue dots indicate sucrose- and water-selective units, respectively, in the corresponding behavioral phase. Intersections of two red or blue bars show the median spike rates of sucrose- or water-selective units, respectively. Bars represent quartile deviations. In the bottom, cumulative probabilities of spike rates in preferred trials (for the definition of preferred trials, see Fig. 2) of sucrose- and water-selective units are shown in red and blue, respectively. C, In the top, spike rates in each behavioral phase of left trials (abscissa) and right trials (ordinate) for units that were selective to the response in the odor presentation (left), response (center), or reward-waiting (right) phase are shown. Green and purple dots indicate left- and right-selective units, respectively, in the corresponding phase. Intersections of two green or purple bars show the median spike rates of left- or right-selective units, respectively. Bars represent quartile deviations. In the bottom, cumulative probabilities of spike rates in preferred trials of left- and right-selective units were shown in green and purple, respectively. The p value of the Kolmogorov–Smirnov test is indicated in each plot.
Results
Rat OFC neurons showed selective activity to either the expected outcome or the behavioral response
Using the contingencies shown in Figure 1 A, thirsty rats were trained to make a correct response to obtain a rewarding outcome, either 5% sucrose or water. During task performance, the correct response consisted of a nose poke to either a left or right fluid well, depending on the odor cue presented on a trial. Each of two different odors associated with the same response (e.g., go to right fluid well) consistently predicted that one of the two different outcomes (sucrose or water) would be delivered at a variable delay after the response was made. Given that each of four odors was associated with a unique combination of correct response and rewarding outcome, the task enabled analysis of neuronal activity selective for the expected outcome (sucrose or water outcome) or for the behavioral response (left or right response), or for a combination of outcome and response. Our behavioral task did not dissociate distinct properties of the expected outcome; outcome-selective encoding could include sensory (e.g., sweetness), incentive (e.g., preference), or other unidentified correlates of the expected outcome. Notably, under the water deprivation conditions used to motivate performance, rats strongly prefer 5% sucrose to water, as was shown by a two-bottle preference test in the home cage (22.1 ± 1.2 ml for sucrose consumption and 1.7 ± 0.4 ml for water consumption as means ± SE during 30 min; n = 7; p = 0.002 by t test) and by response latencies during task performance, as described in a later section of the results.
After rats were extensively trained with the same odor-response and odor-outcome contingencies, we recorded 422 single units from the lateral area of rat OFC (Fig. 1B) during 65 sessions of task performance. Isolated units exhibited action potentials with either short or long waveforms. There were 42 units with short action potentials, which are putative fast-spiking interneurons (Wilson et al., 1994). These units showed significantly higher spike rates than the remaining population. Therefore, by excluding these units, we analyzed 380 single units in this study.
To identify outcome-selective and response-selective units, we statistically compared spike rates during each behavioral phase in a trial (for the definition of each phase, see Materials and Methods) comparing between correct sucrose and water trials or between correct left and right trials. This analysis identified substantial numbers of units with outcome selectivity or response selectivity during each phase of task performance: odor presentation, response to the fluid well, and waiting during the delay before reward delivery [94 outcome-selective units (24.7%) and 165 response-selective units (43.4%) of total] (Figure 1C, Table 1). Except for the analysis of the intertrial interval (p > 0.05), the numbers of outcome-selective or response-selective units were significantly higher in each trial phase than those expected from the binomial distribution (p < 0.001). Within each classification, either outcome or response, selectivity was evident for each option, including both sucrose- and water-selective units and both left- and right-selective units (Table 2, left and middle column pairs). Notably, among the response-selective units, similar numbers were selective for the response in the direction ipsilateral and contralateral to the recording site hemisphere (Table 2, right column pair), suggesting bilateral encoding in the OFC related to response selectivity. Finally, some neurons appeared to have correlates that were a combination of outcome and response selectivity (Fig. 1C, Table 3). However, the number of those units in the response and reward-waiting phases was not significantly greater than expected given the actual probabilities of outcome- and response-selective units in those phases. Only the units selective for a combination of outcome and response in the odor sampling phase exceeded the expected value based on numbers of outcome- and response-selective units (p = 0.035). Such selectivity, indicative of preferential firing on a particular trial type, could reflect either odor-selective encoding per se or an associated response–outcome contingency; these two possibilities could not be distinguished within the current task design. We also used two-way ANOVA to evaluate any interactions between response and outcome-selective encoding (e.g., units that responded selectively to one response–outcome combination) in each phase. Most selective units did not show significant interaction between outcome and response selectivity (Table 3).
Table 2.
Detailed profiles of outcome and response selectivity
| Sucrose vs water | Left vs right | Ipsi vs contra | |
|---|---|---|---|
| Odor presentation | 18 vs 17 | 26 vs 27 | 25 vs 28 |
| Response | 28 vs 14 | 50 vs 40 | 45 vs 45 |
| Reward waiting | 22 vs 14 | 51 vs 29 | 40 vs 40 |
Outcome-selective units were divided according to sucrose or water preference. Response-selective units were categorized as left- or right-selective units or whether the side of response selectivity was the same as [ipsilateral (Ipsi)] or opposite [contralateral (contra)] the recorded hemispheres.
The results of additional analyses confirmed that selective encoding for outcome and response in OFC occurred independently from the other selectivity type. This was indicated by an analysis that determined whether outcome- and response-selective units showed the same selectivity regardless of the responses or outcomes in the trial. To quantify selectivity of each type, we used a nonparametric selectivity index derived from receiver operating characteristic analysis (for details, see Materials and Methods) (supplemental Fig. 1, available at www.jneurosci.org as supplemental material). Two outcome-selectivity indices were derived from the comparison between left-sucrose and left-water trials and from the comparison between right-sucrose and right-water trials, respectively. Similarly, we obtained two response-selectivity indices by comparing either left-sucrose and right-sucrose trials or left-water and right-water trials. In Figure 1D, we plotted the relationship between these two selectivity indices for outcome- and response-selective units separately in each behavioral phase. In each case, most selective units were located in the top right and bottom left quadrants, indicating consistent selectivity of one type, either outcome or response, across all contingencies. Similar conclusions were obtained by rank correlation analyses without the assumption of normal sample distributions (supplemental Fig. 2, available at www.jneurosci.org as supplemental material).
Collectively, the data presented in this section show that response and outcome-selective encoding concurrently occurred in mostly separate populations of OFC neurons. Moreover, the neurons with correlates of each type were observed in each behavioral phase of task performance (odor presentation, response, and reward-waiting delay). Thus, under conditions in which the two possible outcomes associated with each response differed in identity and value, a population of OFC neurons, which was at least as large as the population that exhibited outcome encoding, exhibited response selectivity. Neurons with such correlates represented a substantial fraction of cells recorded in OFC.
OFC neurons with outcome selectivity and response selectivity exhibited different profiles during task performance
To further characterize neuronal correlates in relation to task performance, we first analyzed population activity for units that were either outcome-selective or response-selective within each behavioral phase. To accomplish this, we used a measure of selectivity computed as a difference score for the preferred and nonpreferred firing rates (for the definitions of preferred and nonpreferred trials, see the legend of Fig. 2), which was then averaged for units in each population (Fig. 2). These spike-rate differences exhibited qualitatively distinctive profile for the response- and outcome-selective populations. As shown in Figure 2B, the response-selective neurons, as a population, had more distinctive peaks within each phase, particularly surrounding response execution (Fig. 2B). Because the phases for the analysis of neural activity were, for the most part, synchronized to behavioral events, such as the initiation and completion of the behavioral response (i.e., unpoke at the odor port entry and poke to the fluid port, respectively) and reward delivery, this profile suggests a temporal relationship with such events across the response-selective population (Fig. 2B). In contrast, the outcome-selective population showed a profile that more broadly spanned each behavioral phase (Fig. 2A). Such firing in the outcome-selective population is consistent with the encoding of outcome expectancy, such that activated selectivity is maintained across the trial epochs.
A bootstrap analysis (for details, see Materials and Methods) of the distribution of selective activity in individual units over time confirmed these impressions. A statistically significant proportion of response-selective units exhibited selective activity that was skewed toward the occurrence of specific behavioral events, whereas the proportion of outcome-specific neurons with such nonuniform selectivity distributions did not differ significantly from chance (Fig. 3). Furthermore, a binomial analysis demonstrated a significant difference in the selectivity distributions of the response- and outcome-selective populations; across the response and reward-waiting phases combined, nonuniform selectivity was observed in 46 of 170 response-selective units compared with only 7 of 78 outcome-selective units (p = 0.0013). In the following sections, we will analyze how individual outcome- or response-selective units contribute to the patterns observed at the population level.
Outcome expectancy was maintained from either odor presentation or response initiation until reward delivery at the single-unit level
To statistically examine maintenance of outcome selectivity across phases of task performance for the individual units, we examined whether the same neurons encoded significant outcome selectivity in more than a single behavioral phase. The numbers of units that were outcome-selective in two behavioral phases were disproportionately larger than those expected from actual probabilities of selective units in each phase (Table 1, top). Notably, most units that were outcome-selective in two behavioral phases showed higher activity for the same outcome option, either sucrose or water, in both (see values in parentheses in Table 1). Furthermore, three units that were outcome-selective in all three behavioral phases showed the same preferred selectivity in all three phases.
Examples of units that maintained outcome selectivity until reward delivery are shown in Figure 4. Similar to the unit shown in Figure 4Aa, units that had the same outcome selectivity in the odor presentation and reward-waiting phases often exhibited a noticeable increase in activity toward reward delivery. Less commonly observed among such cells, Figure 4Ab shows a unit that had firing peaks during odor sampling and at the beginning of the reward-waiting period. Units that had selective activity emerging only after the response was initiated but then maintained selective activity into the reward-waiting phase were also observed and illustrated by the unit shown in Figure 4Ac. Interestingly, for units that exhibited outcome selectivity either from odor presentation or from the time of response initiation, selective firing was typically less pronounced near the time of response completion, but then re-emerged in the reward-waiting phase (Fig. 4A). Alongside those patterns, units that showed transient outcome-selective firings confined within a behavioral phase were also observed (Fig. 4B, examples). In summary, although the outcome-selective units in the OFC exhibit diverse patterns, a substantial subset of units in the outcome-selective population maintained their selectivity from either the odor presentation or response initiation until reward delivery.
Figure 4.
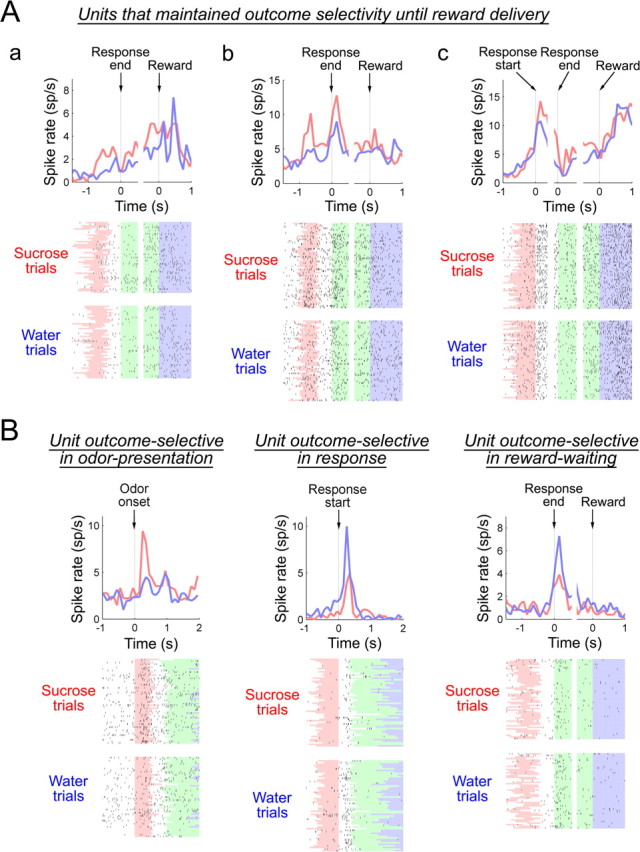
Perievent spike histograms and raster plots of representative outcome-selective units. A, B, Perievent spike histograms and raster plots are shown for three units that maintained outcome selectivity from either the odor presentation (Aa, Ab) or the response initiation (Ac) until reward delivery, and for units that were transiently active and selective in either the odor presentation, response, or reward-waiting phase (B). The time window of 100 ms sliding at 100 ms steps was used to generate perievent spike histograms. Red and blue lines in the histograms show firings in sucrose and water trials, respectively. In raster plots, the odor presentation, reward-waiting, and consumption phases are shown in red, green, and blue, respectively. White areas between red and green areas correspond to the response phase.
Response encoding activity was time-locked to behavioral events and often exhibited phase-specific selectivity across the epochs of behavioral performance
In the bootstrap statistical analysis already described, the profile of response-selective units was more tightly linked to task events compared with outcome-selective units. This finding was further evident at the level of single units. Thus a majority of response-selective units were selective only in a single behavioral phase (Table 1, bottom). Perievent spike histograms showed transient activation of many response-selective units during the odor presentation and response phases around response initiation and completion, respectively (Fig. 5A, left and center panels). In contrast, response-selective firings in the reward-waiting epoch typically showed more sustained activation during this phase (Fig. 5A, right). With a variable delay for reward delivery, it was noticeable that the emergence and cessation of response-selective encoding in this phase were time-locked to response completion and reward delivery, respectively.
Figure 5.

Perievent spike histograms and raster plots of representative response-selective units. A–D, Perievent spike histograms and raster plots are shown for units that were transiently active in either odor presentation, response, or reward-waiting phase (A), units that showed the same (B, left) or opposite (B, right) response selectivity in the odor presentation and response phases, units that showed the same (C, left) or opposite (C, right) response selectivity in the odor presentation and reward-waiting phases, and units that showed the same (D, left) or opposite (D, right) response selectivity in the response and reward-waiting phases. Green and purple lines in perievent spike histograms show firings in left and right trials, respectively. Colors in raster plots are the same as in Figure 4.
Alongside those units that were selective in a single behavioral phase, we also noted a significant number of units that were response-selective in more than a single behavioral phase (Table 1, bottom). The numbers of units that were response-selective in two behavioral phases were disproportionately larger than those expected from actual probabilities of selective units in each phase (Table 1, bottom). Perhaps surprisingly, however, the units that were response-selective across any two behavioral phases (i.e., odor presentation and response, odor presentation and reward waiting, and response and reward waiting) were less likely than the outcome-selective units to have the same preferred activity (see values in parentheses in Table 1).
Examples of units that showed response selectivity in two behavioral phases are shown in Figure 5B–D. Similar to the unit in the left panel of Figure 5B, units that had the same preferred response in the odor presentation and response phases exhibited broad peaks that widely spanned both phases. In contrast, units that had differing response selectivity between the odor presentation and response phases were typically activated only after response initiation in trials with one response option, whereas their selective firing emerged during odor presentation only in trials with the other response option (Fig. 5B, right). Figure 5C illustrates units that showed either same or differing response selectivity at the beginning and end of trials (in the odor presentation and reward-waiting phases). Units that had differing response selectivity in those phases typically showed activation at the end of odor presentation in trials with one response option, whereas activation in the reward-waiting phase occurred in trials with the other response option (Fig. 5C, right). Another group of units that showed same or differing response selectivity in the response and reward-waiting phases is illustrated in Figure 5D. Similar to the unit shown in the left panel of Figure 5D, most units that maintained the same response selectivity in the response and reward-waiting phases exhibited a noticeable transient decrease in selective activity at the completion of response execution. However, units that had differing selectivity in those phases typically showed a clear reversal of response selectivity at the time of response completion (Fig. 5D, right).
Together, these findings show that neurons with response-selective activity have properties that are distinctive from neurons that encode outcome selectivity, such that response encoding was typically transient and time-locked to behavioral events. Furthermore, many response-selective units changed selectivity from one preference to another in conjunction with behavioral events such as response initiation and completion.
Relationship of response selectivity to behavioral performance in an analysis of error trials
Our data, as described above, indicate that response selectivity was often phasic and selectivity for the same preferred response was not always maintained across different epochs of trial performance in the task, even when the same units exhibited response selectivity in multiple phases. Importantly, encoding related to the behavioral response in the task (left or right) was not limited to the epoch during which a response was executed. As already noted, initiation of the overt behavioral response defined the boundary between the odor presentation and response phases for the purpose of data analysis. Given that odors provided cues for the correct behavioral responses, response selectivity might be tied to the information provided by odor cues themselves or to the subsequent selection of the behavioral responses that were executed. To examine this possible distinction, we compared response selectivity in each behavioral phase between correct and error trials, in which the relationships between odor cues and responses specifically differed (Fig. 6, top). Because the discriminative performance was highly accurate (see Materials and Methods), we could not collect enough error trials for analyses at the individual-unit level. Therefore, we conducted population-level comparisons of response selectivity in correct and error trials only for response-selective units whose firings in error trials were obtained from at least one trial for both response types (51, 87, and 78 units response-selective during the odor presentation, response, and reward-waiting phases, respectively). This analysis resulted in a striking difference according to the phase of performance that was analyzed (Fig. 6, bottom). Thus, response selectivity in the population that was selective after odor presentation (i.e., response and reward-waiting phases) was tied to actual behavioral responses (Fig. 6, center and right bottom panels). In contrast, in the population of units that exhibited selectivity during odor presentation, that selectivity was not associated with the subsequent overt behavioral responses, but rather could be weakly associated with presentation of odor cues (Fig. 6, bottom left panel). Similar conclusions were obtained by rank correlation analyses without the assumption of normal sample distributions (supplemental Fig. 3, available at www.jneurosci.org as supplemental material). Further discussion of data on units selective for a specific odor contingency is provided as supplemental text and supplemental Figure 4 (available at www.jneurosci.org as supplemental material).
Activities of both outcome- and response-selective neurons depend on the content of selective encoding
Because the incentive value of sucrose greatly exceeds than that of water, as shown by a taste preference test previously described, sucrose expectancy would be anticipated to have a correspondingly larger incentive value. A behavioral manifestation of such expectancy was evident in response latencies, defined as the interval between cue onset and response initiation. Response latency differed as a function of trial outcome, with significantly shorter latencies in sucrose trials than in water trials (Fig. 7A, left). As a neural correlate of this difference, we found that sucrose-selective units that were selective during either the odor presentation or response phase, but not those that were selective during the reward-waiting phase, were significantly more active than water-selective units for the corresponding phase (Fig. 7B). Sucrose-selective units during those phases showed significantly higher spike rates than water-selective units in preferred trials (Fig. 7B, bottom) as well as in nonpreferred trials (data not shown).
Unexpectedly, a behavioral difference was similarly observed between left and right trials in the response latency and motion time, the latter referring to the interval that a rat was moving in execution of a behavioral response. Those behavioral indices showed significantly faster behavioral responses in right trials than in left trials (Fig. 7A). Given that behavioral difference, we also tested whether spike rates of left- and right-selective units might also differ. We found that right-selective units during the response phase, but not those selective during the other two phases, were significantly more active than left-selective ones (Fig. 7C). Spike rates of right-selective units during the response phase were significantly higher than those of left-selective units in preferred trials (Fig. 7C, bottom) as well as in nonpreferred trials (data not shown).
Given that response and outcome-selective activities averaged across trials were correlated with rats' behavioral performance, we also examined trial-by-trial correlations of activities of each unit and the behavioral performance. A significant subset of outcome-selective and response-selective units in the odor presentation and response phases showed trial-by-trial correlations of spike rates with response latencies and motion times, respectively (supplemental Table 2, available at www.jneurosci.org as supplemental material). The number of units with significant correlations was significantly larger than expected from the binomial distribution. However, contrary to the population analysis described above, both positive and negative correlations were noticeable in trial-by-trial correlations (supplemental Fig. 5, available at www.jneurosci.org as supplemental material). Nevertheless, together, these data suggest that the representations of response and outcome selectivity are biased in accordance with behavioral performance in the task.
Discussion
The current investigation examined response-related encoding in OFC alongside the widely recognized function of OFC in encoding reward-related information. We identified mostly separate neuronal populations in rodent OFC that encoded the expected outcome (24.7%) and the behavioral response (43.4%), respectively, in an instrumental discrimination task. Although substantial encoding of each type was found in each behavioral phase (odor presentation, response, and reward waiting), distinctive characteristics of outcome and response encoding were evident both at the level of population analysis and single units. Although outcome-selective encoding in our study did not dissociate distinct properties of the expected outcome (e.g., taste, value), the features of outcome encoding were generally consistent with past reports, supporting a critical role for the OFC in the representation of predicted outcome information that can be used to guide behavioral performance. Alongside the encoding of outcome, a population of neurons, at least as large, exhibited selective activity related to the instrumental response, regardless of the predicted outcome. That response-selective population contrasts with an apparent lack of such correlates in studies of primate OFC, but is consistent with observations of response-selective encoding in studies of rodent OFC. Here, in contrast with the design of previous experiments, it was possible to concurrently segregate the representation of response and outcome information as correlates of OFC neural activity. In that context, few OFC neurons were found that encoded combined outcome and response contingencies. Instead, task-related information was represented in relatively distinct ensembles of OFC neurons with encoding of either outcome or response-related information.
Outcome-selective encoding in OFC
We found several types of neurons in OFC with selective activity tied to trial outcome (sucrose or water). An important class of such neurons maintained selective activity in a manner that predicted the outcome across behavioral performance in the trials. Some of those neurons became activated during odor sampling but were not tied to a specific odor stimulus. Instead, activation of neurons with a preferred outcome (water or sucrose) could be elicited by different odor cues that signaled the same reward. Other neurons that maintained outcome-selective firing became activated at the initiation of the behavioral response. Given that the same outcome occurred after execution of different responses (left or right), this encoding is also consistent with the representation of predicted outcome independent of the specification of response.
Behavioral deficits in settings that depend on outcome information are prominent after OFC damage in both rodents and primates. For example, patients with OFC damage fail to show adaptive behavior in a gambling task in which their choices can lead to unfavorable consequences (Bechara et al., 2000). In reinforcer devaluation experiments, OFC-lesioned rodents and primates also fail to alter responding when the value of an expected reward is reduced (Gallagher et al., 1999; Izquierdo et al., 2004). As evident in the population profile in the current study, outcome-selective encoding provides a template within the OFC of the predicted outcome, from the time when the informative cue is sampled at the beginning of a trial until the reward is delivered. Activation of outcome-selective neurons by the predictive odor cues themselves allows behavioral guidance at the time of cue sampling, an essential function for normal performance in reinforcer devaluation experiments. Thus, outcome encoding, as observed in the outcome-selective population in the current study, serves as a basis for adaptive behavioral control.
Although in general, outcome-encoding units showed relatively sustained selectivity, a considerable number of neurons in the outcome-encoding population had selective activity that predominated, or was even confined, in a limited phase of task performance within trials. Such activity was particularly evident in different subsets of these neurons during sampling of the odor, and surrounding the response, at both its initiation and completion. Because firing rates in outcome-selective neurons were biased according to the incentive value of expected reward in the odor presentation and response phases, phasic encoding within those epochs could also be associated with the vigor of the behavioral response, which differed according to the incentive value of the outcome, apart from movement specification (left or right response). This interpretation is consistent with other evidence showing that OFC damage eliminates latency differences in responding to odor cues that signal outcomes with different incentive value in a related instrumental task (Schoenbaum et al., 2003b). In that regard, it is also interesting that outcome-selective activity in the reward-waiting phase did not show a similar spike-rate bias, and phasic outcome encoding was also less evident in that epoch.
Response-selective encoding in OFC
We found abundant response-related encoding occurring alongside outcome-selective encoding. As with outcome-encoding units, neurons with response selectivity were found in each phase of task performance. However, at the level of both population and single-unit analysis, features of response-encoding neurons clearly differed from those of outcome-encoding units. In contrast to outcome-encoding population activity, which spanned behavioral phases, response-selective encoding was time-locked to task-related events (e.g., response initiation and completion as well as reward delivery). It was especially evident that response-selective unit activity was tightly aligned to behavioral events (e.g., response execution) during task performance. Furthermore, spike rates of response-selective units in the response phase, but not in the other phases, differed between the two response options in conjunction with different motion speeds. Finally, in our analysis of performance on error trials, response selectivity during the response phase was tied to the behavioral response that was actually executed, rather than the preceding odor stimulus. Thus, the OFC encoding appears to provide a template of behavioral events (e.g., behavioral response or its associated sensory/proprioceptive stimulus) during task performance and may contribute to the execution of responding.
Not all response-selective encoding, however, could be clearly tied to behavioral events related to task performance. Indeed, in our analysis of error trials, some neurons identified with response-selective activity during odor sampling were associated with the odor cue rather than the response performed. Here, the data fail to support a role for OFC encoding in response selection. As suggested previously (Hollerman et al., 2000; Wallis, 2007), that function may depend on other prefrontal circuits that integrate OFC input to generate a behavioral response.
Our design did not firmly establish the basis for response-selective activity that was observed in the reward-waiting phase. Such activity could be tied to some undetermined behavioral correlate that differs as a function of location (left or right) or could reflect the rat's current location after response completion (e.g., the spatial goal). Considering the latter possibility, units with left vs right preferences in the reward-waiting phase typically maintained activity until reward delivery, a profile that was also apparent in the population profile of response-selective encoding. Thus, encoding in the OFC within the overall response-selective population may consist of different subsets of neurons with patterns linked to response execution and location of reward delivery, respectively. That some response-selective units participate in networks that encode these different features is further suggested by the sizeable subset of units in the response-selective population that switched selectivity across phases of the trials, a property that was not commonly observed in the outcome-encoding population.
Parallel component processing in an OFC network: task demands and species differences
We observed substantial, but mostly independent, encoding of outcome and response information in the OFC, with few neurons exhibiting features of both outcome and response selectivity. Thus, correlates in OFC that encode the behavioral response and/or spatial goals can be represented mostly independent of features of reward, such as incentive value, that are a basis for outcome encoding.
Notably, compared with tasks used in primate studies, our task (Fig. 1A) may have especially encouraged response encoding and downplayed the role of outcome encoding. First, as in other rodent studies that showed response correlates in OFC, the required left and right responses were directed to the site of reward delivery and, thus, response encoding may also have represented spatial goals. Second, a response did not predict a specific outcome, leading equally often to sucrose or water, thus diminishing the likelihood of response–outcome association. Third, specific outcome expectancies conditioned to the odor cues alone could not be used to guide behavioral choice, because left and right responses were equally reinforced in the presence of each of these expectancies.
Differences between our results and those of primate studies may be related in part to procedural differences such as these. For example, typically in primate studies, rewards are delivered at the same site, rather than different sites, after all correct responses, visual rather than olfactory cues are used, and responses (reach or saccade) are often directed to the visual cue itself. Given the different potential roles for spatial mapping in these studies and the fact that association sensory cortices of different modalities connect with distinct subdivisions of primate OFC, such differences could be important determinants of performance differences. Furthermore, although rodent and primate OFC exhibit similar functions and anatomical connectivity (Eichenbaum et al., 1983; Kolb, 1984; Ongür and Price, 2000), the cytoarchitecture differs significantly in that rodent OFC is agranular, whereas primate OFC contains granular and dysgranular subdivisions (Price, 2007). Thus, regional differentiation within the OFC and comparisons at the level of OFC subregions are still controversial. According to behavioral experiments, the orbital surface of the primate brain can be divided into at least two functional subregions: the inferior convexity, located laterally (mostly Walker's area 12), and the so-called orbitofrontal cortex, located more medially (Walker's areas 11/13/14) (Butter, 1969; Iversen and Mishkin, 1970). This notion is also supported by extensive anatomical analyses of corticocortical connections within primate OFC (Price 2007). The parallel distinction has not been demonstrated in rodent OFC. In primate studies that failed to identify response correlates, single units were recorded from Walker's areas 11/13/14, but not from the lateral OFC. Thus, recordings in monkey area 12 would be illuminating.
The current investigation addressed the important question of whether OFC itself plays a role in guiding overt action. The features of response-related encoding, isolated here from encoding related to outcome, identify a more direct role of OFC information processing in goal-directed behavioral processes. The findings also point to conditions under which the processing of information related to behavioral actions might be evident in studies of other species.
Footnotes
This work was supported by grants from the National Institute of Mental Health (M.G.) and a research fellowship from Uehara Memorial Foundation in Japan (T.F.). We thank Dr. Stephen Warrenburg at International Flavors and Fragrances for their kind gift of odorant samples, Jim Garmon and Patrick Tao for their help in building apparatuses for behavior and electrophysiology, Aliza Ehrlich and Weidong Hu for behavioral training (A.E.) and brain processing for the histology (A.E., W.H.), Dr. Thomas Jhou and Michael Saddoris for their helpful comments and discussions, and Leslie Loving for her secretarial help.
References
- Baxter MG, Murray EA. The amygdala and reward. Nat Rev Neurosci. 2002;3:563–573. doi: 10.1038/nrn875. [DOI] [PubMed] [Google Scholar]
- Bechara A, Damasio H, Damasio A. Emotion, decision making and the orbitofrontal cortex. Cereb Cortex. 2000;10:295–307. doi: 10.1093/cercor/10.3.295. [DOI] [PubMed] [Google Scholar]
- Butter CM. Perseveration in extinction and in discrimination reversal tasks following selective frontal ablations in Macaca mulatta. Physiol Behav. 1969;4:163–171. [Google Scholar]
- Critchley HD, Rolls ET. Hunger and satiety modify the responses of olfactory and visual neurons in the primate orbitofrontal cortex. J Neurosci. 1996;75:1673–1686. doi: 10.1152/jn.1996.75.4.1673. [DOI] [PubMed] [Google Scholar]
- Dolan RJ. The human amygdala and orbital prefrontal cortex in behavioural regulation. Philos Trans R Soc Lond B Biol Sci. 2007;362:787–799. doi: 10.1098/rstb.2007.2088. [DOI] [PMC free article] [PubMed] [Google Scholar]
- Eichenbaum H, Clegg RA, Feeley A. Reexamination of functional subdivisions of the rodent prefrontal cortex. Exp Neurol. 1983;79:434–451. doi: 10.1016/0014-4886(83)90224-8. [DOI] [PubMed] [Google Scholar]
- Feierstein CE, Quirk MC, Uchida N, Sosulski DL, Mainen ZF. Representation of spatial goals in rat orbitofrontal cortex. Neuron. 2006;51:495–507. doi: 10.1016/j.neuron.2006.06.032. [DOI] [PubMed] [Google Scholar]
- Furuyashiki T, Gallagher M. Neural encoding in the orbitofrontal cortex related to goal-directed behavior. Ann NY Acad Sci. 2007;1121:193–215. doi: 10.1196/annals.1401.037. [DOI] [PubMed] [Google Scholar]
- Gallagher M, McMahan RW, Schoenbaum G. Orbitofrontal cortex and representation of incentive value in associative learning. J Neurosci. 1999;19:6610–6614. doi: 10.1523/JNEUROSCI.19-15-06610.1999. [DOI] [PMC free article] [PubMed] [Google Scholar]
- Holland PC, Gallagher M. Amygdala-frontal interactions and reward expectancy. Curr Opin Neurobiol. 2004;14:148–155. doi: 10.1016/j.conb.2004.03.007. [DOI] [PubMed] [Google Scholar]
- Hollerman JR, Tremblay L, Schultz W. Involvement of basal ganglia and orbitofrontal cortex in goal-directed behavior. Prog Brain Res. 2000;126:193–215. doi: 10.1016/S0079-6123(00)26015-9. [DOI] [PubMed] [Google Scholar]
- Iversen SD, Mishkin M. Perseverative interference in monkeys following selective lesions in the inferior prefrontal convexity. Exp Brain Res. 1970;11:376–386. doi: 10.1007/BF00237911. [DOI] [PubMed] [Google Scholar]
- Izquierdo A, Suda RK, Murray EA. Bilateral orbital prefrontal cortex lesions in rhesus monkeys disrupt choices guided by both reward value and reward contingency. J Neurosci. 2004;24:7540–7548. doi: 10.1523/JNEUROSCI.1921-04.2004. [DOI] [PMC free article] [PubMed] [Google Scholar]
- Kolb B. Functions of the frontal cortex of the rat: A comparative review. Brain Res Rev. 1984;8:65–98. doi: 10.1016/0165-0173(84)90018-3. [DOI] [PubMed] [Google Scholar]
- Ongür D, Price JL. The organization of networks within the orbital and medial prefrontal cortex of rats, monkeys and humans. Cereb Cortex. 2000;10:206–219. doi: 10.1093/cercor/10.3.206. [DOI] [PubMed] [Google Scholar]
- Padoa-Schioppa C, Assad JA. Neurons in the orbitofrontal cortex encode economic value. Nature. 2006;441:223–226. doi: 10.1038/nature04676. [DOI] [PMC free article] [PubMed] [Google Scholar]
- Paxinos G, Watson C. Ed 4. San Diego: Academic; 1998. The rat brain in stereotaxic coordinates. [DOI] [PubMed] [Google Scholar]
- Price JL. Definition of the orbital cortex in relation to specific connections with limbic and visceral structures and other cortical regions. Ann NY Acad Sci. 2007;1121:54–71. doi: 10.1196/annals.1401.008. [DOI] [PubMed] [Google Scholar]
- Roesch MR, Taylor AR, Schoenbaum G. Encoding of time-discounted rewards in orbitofrontal cortex is independent of value representation. Neuron. 2006;51:509–520. doi: 10.1016/j.neuron.2006.06.027. [DOI] [PMC free article] [PubMed] [Google Scholar]
- Rolls ET, Critchley HD, Mason R, Wakeman EA. Orbitofrontal cortex neurons: Role in olfactory and visual association learning. J Neurophysiol. 1996;75:1970–1981. doi: 10.1152/jn.1996.75.5.1970. [DOI] [PubMed] [Google Scholar]
- Schoenbaum G, Chiba A, Gallagher M. Orbitofrontal cortex and basolateral amygdala encode expected outcomes during learning. Nat Neurosci. 1998;1:155–159. doi: 10.1038/407. [DOI] [PubMed] [Google Scholar]
- Schoenbaum G, Chiba A, Gallagher M. Neural encoding in orbitofrontal cortex and basolateral amygdala during olfactory discrimination learning. J Neurosci. 1999;19:1876–1884. doi: 10.1523/JNEUROSCI.19-05-01876.1999. [DOI] [PMC free article] [PubMed] [Google Scholar]
- Schoenbaum G, Setlow B, Saddoris MP, Gallagher M. Encoding predicted outcome and acquired value in orbitofrontal cortex during cue sampling depends upon input from basolateral amygdala. Neuron. 2003a;39:855–867. doi: 10.1016/s0896-6273(03)00474-4. [DOI] [PubMed] [Google Scholar]
- Schoenbaum G, Setlow B, Nugent SL, Saddoris MP, Gallagher M. Lesions of orbitofrontal cortex and basolateral amygdala complex disrupt acquisition of odor-guided discriminations and reversals. Learn Mem. 2003b;10:129–140. doi: 10.1101/lm.55203. [DOI] [PMC free article] [PubMed] [Google Scholar]
- Thorpe SJ, Rolls ET, Maddison S. The orbitofrontal cortex: neuronal activity in the behaving monkey. Exp Brain Res. 1983;49:93–115. doi: 10.1007/BF00235545. [DOI] [PubMed] [Google Scholar]
- Tremblay L, Schultz W. Relative reward preference in primate orbitofrontal cortex. Nature. 1999;398:704–708. doi: 10.1038/19525. [DOI] [PubMed] [Google Scholar]
- Tremblay L, Schultz W. Reward-related neuronal activity during go-nogo task performance in primate orbitofrontal cortex. J Neurophysiol. 2000;83:1864–1876. doi: 10.1152/jn.2000.83.4.1864. [DOI] [PubMed] [Google Scholar]
- Wallis JD. Orbitofrontal cortex and its contribution to decision-making. Annu Rev Neurosci. 2007;30:31–56. doi: 10.1146/annurev.neuro.30.051606.094334. [DOI] [PubMed] [Google Scholar]
- Wallis JD, Miller EK. Neuronal activity in primate dorsolateral and orbital prefrontal cortex during performance of a reward preference task. Eur J Neurosci. 2003;18:2069–2081. doi: 10.1046/j.1460-9568.2003.02922.x. [DOI] [PubMed] [Google Scholar]
- Wilson FA, Ó Scalaidhe SP, Goldman-Rakic PS. Functional synergism between putative γ-aminobutyrate-containing neurons and pyramidal neurons in prefrontal cortex. Proc Natl Acad Sci USA. 1994;91:4009–4013. doi: 10.1073/pnas.91.9.4009. [DOI] [PMC free article] [PubMed] [Google Scholar]
- Zar JH. Ed 4. Upper Saddle River, NJ: Prentice Hall; 1999. Biostatistical analysis. [Google Scholar]