

Abstract
Purpose
It is unclear if the production and perception of speech movements are sub served by the same brain networks. The purpose of this study was to investigate neural recruitment in cortical areas commonly associated with speech production during the production and visual perception of speech.
Method
This study utilized functional magnetic resonance imaging (fMRI) to assess brain function while participants either imitated or observed speech movements.
Results
A common neural network was recruited by both tasks: greatest frontal lobe activity in Broca’s area was triggered not only when producing speech but also when watching speech movements. Relatively less activity was observed in the left anterior insula during both tasks.
Conclusions
These results support the emerging view that cortical areas involved in the execution of speech movements are also recruited in the perception of the same movements in other speakers.
Keywords: Broca’s area, insula, fMRI, imitation, neuroimaging
The relatively recent discovery of mirror neurons (neurons recruited for the execution of an action as well as the visual perception of the same action by others) in the inferior premotor cortex (F5) of the macaque monkey (Rizzolatti et al., 1988; Gallese, Fadiga, Fogassi, Rizzolatti, 1996; Rizzolatti & Arbib, 1998; Ferrari, Fogassi, Gallese, & Rizzolatti, 2003) has rekindled considerable interest in the motor theory of speech perception (Liberman, Cooper, Shankweiler, & Studdert-Kennedy, 1967). Some of this increased interest is based on several studies showing greater neural activity in Broca’s area-the proposed human homologue of the macaque monkey’s F5 (Rizzolati & Arbib, 1998; Petrides, 2005; Petrides, Cadoret, & Mackey, 2005) during passive viewing of speech (Paulesu et al., 2003; Skipper, Nusbaum, & Small, 2005) as well as active speech reading (Calvert, Campbell, & Brammer, 2000; Campbell et al., 2001; Bernstein et al., 2002; MacSweeney et al., 2002; Calvert & Campbell, 2003; Buccino, et al., 2004; Hall, Fussell, & Summerfield, 2005).
The notion that cortical speech areas are recruited for speech perception was originally suggested in a classic paper by Liberman, Cooper, Shankweiler, & Studdert-Kennedy (1967) discussing the perception of the speech code. After consideration of acoustic alternatives, Liberman and colleagues proposed that human listeners accomplish speech perception by exploiting the motor commands that produce speech. This might explain why speech perception improves when the face of the speaker is visible as compared to when only auditory speech is present (Sumby & Pollack, 1954; van Wassenhove, Grant, & Poeppel, 2005). It is plausible that speech motor maps in the posterior portion of Broca’s area (pars opercularis), which are recruited to plan speech production (Guenther, Hampson, & Johnson, 1998; Guenther, 2006; Guenther, Ghosh, & Tourville, 2006), could also support the auditory perception of speech when produced by others. Thus, support for the motor theory of speech perception is an appealing and straightforward interpretation of the current imaging data showing increased Broca’s area activity during speech perception.
However, this explanation ignores a series of papers that suggest that the left anterior insula, but not Broca’s area, is the crucial speech area (Bates et al., 2003; Dronkers, 1996; Dronkers, Plaisant, Iba-Zizen, & Cabanis, 2007). Traditionally, Broca’s area has been viewed as crucial for speech production (Broca, 1861, 1865; Geschwind, 1965). Based on clinical evidence, this notion was relatively unchallenged until Dronkers (1996) suggested that the left anterior insula, but not Broca’s area, was the critical lesion site that caused apraxia of speech (AOS). Utilizing a lesion overlay method in chronic stroke patients, her data showed that patients with AOS incurred insular rather than Broca’s area damage, suggesting that the former is the critical brain area that supports speech planning. These findings received further support from patient data in Bates et al. (2003) and Ogar et al. (2006), as well as studies utilizing fMRI to study speech production (Bohland & Guenther, 2006; Shuster & Lemieux, 2005). In contrast to the findings of Dronkers (1996), Hillis and colleagues (2004) used structural and perfusion weighted MRI and found Broca’s area to be the critical lesion site associated with AOS in acute stroke patients. Bonilha et al. (2006) further supported these results in a study that utilized fMRI to investigate brain modulation during the production of speech and non-speech oral movements. They found greater Broca’s area modulation associated with the production of speech compared to non-speech movements.
Based on the neuroimaging data discussed above, it seems clear that Broca’s area is modulated by speech perception. While this may reflect taxing of speech related cortical areas, it is less clear whether the same areas are recruited for speech production. In this paper, we explore neural recruitment associated with visual perception and production of speech movements utilizing fMRI in a ‘within subject’ design. Consistent with previous studies of the neuroanatomical basis of speech production, we focused specifically on the left anterior insula and the posterior portion of Broca’s area (BA 44). We predicted that the same cortical areas would be recruited during perception and production with the exclusion of the motor cortex where greater activity would be expected during execution compared to viewing of speech movements.
Methods
Thirteen adults (ten females; three males) participated in the study. All were right handed as verified using the Edinburgh Handedness Scale, and their age range was 18–25 years. Each participant completed two separate tasks that utilized event related design during sparse fMRI scanning where a single echo planar imaging (EPI) volume was collected every 10 seconds. During the first task, participants observed a speaker producing nonsense consonant-vowel syllables (without semantic meaning) randomly presented during a 10 minute sparse fMRI paradigm. Syllables were chosen to include highly visible speech features and excluded the less visible velar and glottal consonants as well as neutral vowels such as /ə/. The following syllables were included: /fa/, /fu/, /la/, /lu/, /ma/, /me/, /mu/, /sa/, /tha/, and /thu/. The mean stimulus length was 1.5 seconds and each was recorded using a standard video camera and presented on a computer screen mounted on the scanner head coil; no auditory stimulation was included. A total of 60 trials were presented-10 syllables, each shown three times for a total of 30 presentations, and 30 baseline items consisting of a neutral mouth position. Stimulus presentation was randomized and the inter stimulus intervals (ISI) were jittered using a range of 2–10 seconds. Thus, following the collection of a single echo planar imaging (EPI) volume, the stimuli were presented during the silent period before the next volume acquisition. Because the ISI was randomized (for the purpose of hemodynamic response estimation), the stimuli could be presented at any point during the silent interval with exclusion of the last second before the collection of an upcoming EPI volume. This was arranged so that speech productions in the second task did not coincide with EPI data acquisition. Using a randomized rather than a fixed ISI allows for better estimation of the HDR in cases where the onset and peak of the HDR varies from one participant to the next.
To maintain participants’ attention during the speech-viewing task they were instructed to press a response button with their left hand whenever the tongue of the speaker was visible (approximately 10% of stimuli). The specific purpose of this task was not revealed until study participation was completed. When the first task was complete, the same fMRI stimulus paradigm was presented again, and participants were then explicitly instructed to say out loud the syllables produced by the speaker. All stimuli were produced by the same speaker, and only the lower portion of the face, below the nose, was visible.
A sparse imaging design with a repetition time (TR) of 10 seconds was chosen to minimize motion artifacts during speaking and to allow clear monitoring of speech production. A total of 60 EPI volumes with 32 axial slices were collected at 1.647 seconds each, allowing for 8.463 seconds when no concomitant scanner noise was present. Other fMRI related parameters were as follows: TE (time to echo) = 30 ms; matrix = 64 × 64 voxels; voxel dimensions 3.25 × 3.25 × 3.25 mm. A high resolution T1-MRI scan was collected for anatomical reference and normalization for higher-level analysis. A TFE (turbo fast echo) sequence was used, yielding a 1mm isotropic image (field of view = 256 × 256 mm, 160 sagittal slices, 15-degree flip angle, TR = 9.5 ms, TE = 5.7 ms). The functional images were registered first to individual high-resolution images and then normalized in standard space. Consequently, the spatial interpretations of this study are consistent with transformation of 3.25 mm isotropic images into 1 mm isotropic standard template. All scanning was conducted on a Philips Integra 3T scanner with SENSE multi-channel head coil and an Integrated Functional Imaging System (IFIS; MRI Devices Corp.) stimulus presentation system utilizing E-prime software (Psychology Software Tools, Inc.).
The FMRIB’s Software Library (www.fmrib.ox.ac.uk/fsl) was used to process the fMRI data. The first level analysis (where data from each participant are analyzed separately) employed motion correction (Jenkinson, Bannister, Brady, & Smith, 2002), non-brain removal (to exclude signal in irrelevant areas such as the skull and other non-brain tissue) (Smith, 2002), spatial smoothing using a Gaussian kernel of FWHM (full width at half maximum) 8 mm (to improve detection of real activation), mean-based intensity normalization of all volumes by the same factor, and highpass temporal filtering (to reduce low frequency noise) (Gaussian-weighted, least squares fit, straight line fitting, with SD = 60.0 s). Time-series statistical analyses employed general linear modeling (GLM) and a Gamma function to model the hemodynamic response (HDR). For the first task (speech viewing and tongue detection) the HDR was modeled from the onset of the stimuli. For the second task, the HDR was modeled from the end of the stimuli to better estimate cortical activity associated with speech production. The first level analysis for each participant generated the contrasts ‘speech viewing > baseline’ and ‘speech production > baseline.’ Again, the baseline for both tasks included viewing of a static face.
To estimate mean cortical activity, as well as the activation contrasts associated with viewing of speech movements and speech production, a higher-level (group) analysis was carried out using local analysis of mixed effects (Beckmann, Jenkinson, & Smith, 2003; Woolrich, Ripley, Brady, & Smith, 2004). Here, the data from each participant were combined where the variance within and between subjects was modeled. Z (Gaussianised T/F) statistic images were generated using a rather conservative cluster threshold of Z > 3.1 and a (corrected) cluster significance threshold of p = 0.01 (Worsely, Evans, Marrett, & Neelin, 1992). For whole volume voxelwise analysis, FSL uses the following correction for multiple comparisons. First, each voxel in a volume is thresholded so only voxels with Z-scores greater than 3.1 survive. Next, the surviving clusters are thresholded so that only clusters with a p < 0.01 remain following correction for multiple comparisons based on the random field theory Euler Characteristic. Therefore, voxels that survive must have Z-scores greater than 3.1 and be part of a cluster that survives clusterwise correction for multiple comparisons. A mean statistical map which included data associated with speech viewing (task 1: ‘speech viewing > baseline’) and speech production (task 2: speech production > baseline’) was generated to reveal common areas of brain activity among the two tasks. In addition, a contrast between speech viewing and speech production was generated to examine difference in brain activity associated with each task. Note that using multivariate analysis to compare conditions is far more rigorous than simply subtracting one condition from another without accounting for variance within and between subjects. Local maxima were extracted using the Talairach Daemon Client (http://ric.uthscsa.edu/resources/talairachdaemon/; Lancaster, Summer, Rainey, Freitas, & Fox, 1997). Local maxima are generally thought to reflect the relative intensity of neural activity in a given brain area (Worsley, 2005). For illustrative purpose, the statistical maps generated in the higher level analysis were overlaid on a standard brain map (www.mricro.com; Rorden & Brett, 2000).
To explore task related activity in the left BA 44 and anterior insula, a region of interest (ROI) analysis was performed where the percent signal change in the blood oxygenated level dependent (BOLD) signal was compared for speech viewing and speech production. The ROI for the left BA 44 was extracted from the standard Brodmann’s area map in MRIcro (Rorden & Brett, 2000). This map was generated by Krish Singh who warped an image from Van Essen and Drury (1997) to standard stereotaxic space. It should be noted that an image is probabilistic in nature: Brodmann’s Areas are histologically defined and can not be precisely mapped using currently available in-vivo MRI. The ROI for the left insula was extracted from the Automated Anatomical Labeling map (AAL; Tzourio-Mazoyer et al., 2002). To only include the anterior portion of the insula in the ROI, a redefined ROI was created by limiting the insular volume of interest from the AAL to include only the anterior portion by preserving those voxels that were also included in the “anterior inferior frontal gyrus insula” volume of interest from the Jerne database (http://hendrix.ei.dtu.dk/services/jerne/ninf/voi.html; Nielsen & Hansen, 2002). Finally, the mean percent signal change (for ‘condition > baseline’) for all voxels in both ROIs was calculated and compared using a two-by-two analysis of variance (ANOVA) where the two factors were ‘ROI’ (left BA 44 vs. left anterior insula) and ‘task’ (speech viewing vs. speech production).
Results
The higher level analysis revealed recruitment of an extensive bilateral neural network associated with speech viewing and speech production (Figure 1). The greatest common activity in posterior brain areas was found in the bilateral occipital lobe, the posterior temporal lobe, and the inferior parietal lobe whereas greatest frontal lobe activity was revealed the posterior portion of Broca’s area (Table 1). Sub-cortical activity was noted in the bilateral basal ganglia as well as thalamus.
Figure 1.

Brain areas that were modulated by both speech viewing and speech production (red color scale)- the intensity bar denotes the intensity of the BOLD signal measured in Z-scores compared to baseline. The contrast ‘speech production > speech viewing’ is shown in the green (the green color scale shows the difference in activity measured in Z-scores between the two tasks). There was a slight overlap among the two statistical maps in the left middle and inferior frontal lobe (shown in a shade of yellow). The numbers at the top of the axial images show the locations of the slices in the z direction (top-to-bottom) in MNI coordinates. All images are shown in neurological orientation (left = left; right = right).
Table 1.
List of brain areas where greatest cortical activity was observed during both speech viewing and speech production (top) as well as for the statistical contrast ‘speech production > speech viewing’ (bottom). Anatomical locations and Brodmann’s areas correspond to the Montreal Neurological Institute (MNI) coordinates revealed in the higher level fMRI analysis.
| All Stimuli
| ||||||
|---|---|---|---|---|---|---|
| Z | x | y | z | Hemisphere | Location | BA |
| 6.67 | −50 | −74 | 6 | Left | Middle Occipital Gyrus | 19 |
| 6.65 | −46 | −72 | 2 | Left | Inferior Temporal Gyrus | 19 |
| 6.64 | −34 | −46 | 44 | Left | Inferior Parietal Lobule | 40 |
| 6.63 | 50 | −74 | −2 | Right | Inferior Temporal Gyrus | 19 |
| 6.37 | 58 | −66 | 6 | Right | Middle Temporal Gyrus | 37 |
| 6.28 | −49 | 13 | 29 | Left | Inferior Frontal Gyrus | 44 |
|
Speech Production > Speech Viewing
| ||||||
| Z | x | y | z | Hemisphere | Location | BA |
|
| ||||||
| 4.52 | −58 | −2 | 36 | Left | Precentral Gyrus | 6 |
| 4.2 | 58 | −10 | 34 | Right | Precentral Gyrus | 4 |
| 3.82 | 58 | −10 | 24 | Right | Postcentral Gyrus | 3 |
| 3.4 | 2 | 6 | 60 | Right | Superior Frontal Gyrus | 6 |
| 3.91 | −24 | −6 | 6 | Left | Lentiform Nucleus | Putamen |
Z = Z-score; x, y, and z denote MNI coordinates; BA = Brodmann’s area
To examine the similarities and differences among the two study tasks, higher level contrasts were generated. The contrast for ‘speech production’ greater than ‘speech viewing’ revealed significantly greater activity in the bilateral pre- and post-central gyrus as well as the premotor cortex (Figure 1; Table 1). The converse contrast (speech viewing > speech production) was not significant.
With regard to the ROI analysis, the ANOVA resulted in a main effect for ROI, F(1,10) = 7.77, p < 0.016, where greater percent BOLD signal change in Broca’s area compared to the left anterior insula was associated with both tasks (Figure 2). A significant difference in signal change was not found among the two tasks, F(1,10) = 0.02, p < 0.88 regardless of ROI; similarly, the interaction between ROI and task was not significant, F(1,10) = 0.283, p < 0.60.
Figure 2.
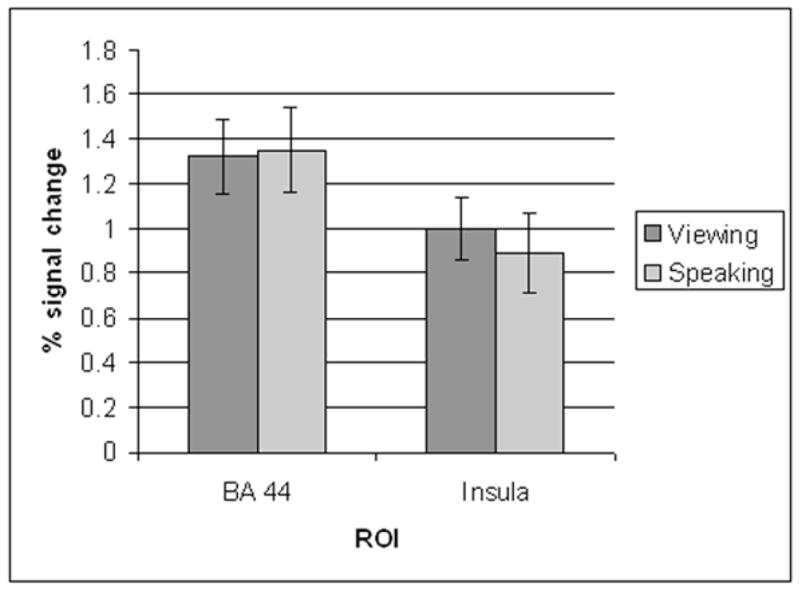
The results from the region of interest analysis where the percent signal change in the left BA 44 and the left anterior insula was compared across the two conditions (speech viewing vs. speech production). The error bars denote standard error.
While data were not collected for ‘tongue monitoring’ accuracy during the speech viewing task, each participant’s button presses were monitored throughout to ensure task compliance. Two participants only pressed the button at the beginning of the task suggesting they had difficulty maintaining attention for the remainder of the task. Since there was no way to verify that these two participants performed the task, we excluded their data in the fMRI analyses leaving the total number of participants at eleven (eight females; three males).
Discussion
This research revealed the greatest frontal lobe activity in the posterior portion of Broca’s area during both production and viewing of speech movements. The finding of increased Broca’s area activity during viewing of speech movements is consistent with several studies involving overt speech reading (Calvert, Campbell, & Brammer, 2000; Campbell et al., 2001; Bernstein et al., 2002; MacSweeney et al., 2002; Calvert & Campbell, 2003; Buccino, et al., 2004; Hall, Fussell, & Summerfield, 2005; Fridriksson et al., 2008). For example, Hall et al. found greater Broca’s activity associated with speech reading compared to viewing non-speech (gurning) oral movements, suggesting that this region is selectively activated for processing speech. In contrast to the present findings, Skipper et al. (2005) did not find increased frontal lobe activity associated with passive viewing of speech movements in a study that combined audio and visual presentation of speech. However, when audio and visual speech was compared to only audio presentation, greater frontal lobe activity, including in Broca’s area, was revealed. The authors suggested that the frontal activity associated with speech viewing may reflect the motor commands needed for speech production. Using transcranial magnetic stimulation (TMS), Watkins, Strafella, and Paus (2003) found that seeing and hearing speech resulted in greater motor-evoked potential in the lip muscles during TMS of the left but not the right face area of the primary motor cortex. Their findings would suggest that not only viewing but also hearing speech modulates the frontal brain areas traditionally associated with speech production.
Based on clinical and neuroimaging data that suggest Broca’s area is crucial for speech production (e.g. Broca, 1861; Hillis et al., 2004; Bonilha et al., 2006), it was not surprising that greatest frontal lobe activity associated with production of simple nonsense syllables was revealed in Broca’s area. Cortical activation patterns associated with speech production in the present study are similar to those revealed by Bohland and Guenther (2006) who used fMRI to study functional correlates of overt syllable production. It is important to note, however, that the current findings do not discount the role of the insula in speech production as fMRI can only deduce the areas involved in a given task rather than determine whether these same areas are crucial for task completion. On this note, it would be interesting to see whether left insular damage would impair visual speech perception. Although the role of the left anterior insula in speech production has been supported by lesion studies (Dronkers, 1996; Bates et al., 2003; Ogar et al., 2006), it is not clear whether damage to this area interrupts active speech processing in gray matter or whether it reflects damage to the underlying white matter fibers. Naeser and colleagues (1989) found that the extent of white matter damage adjacent to the left frontal horn (deep to Broca’s area and the anterior insula) in non-fluent aphasic patients was an important indicator of the severity of speech impairment. Similarly, Fridriksson, Bonilha, and Rorden (2007) showed that damage to the left anterior insula can result in severe Broca’s aphasia. These results suggest that interruption of white matter fibers that connect the anterior and posterior speech areas may be a better predictor of speech impairment compared to frank damage to gray matter in the left insula.
It is a novel finding that the greatest BOLD signal change in the frontal lobes was revealed in Broca’s area during both passive viewing of speech movements and speech production within the same participants. This provides evidence for the notion that the posterior portion of Broca’s area constitutes an area that is involved in speech production as well as the visual perception of others speech movements. Moreover, based on the comparison between speech viewing and speech production, which mostly revealed bilateral sensory-motor cortex activity, it is clear that not only Broca’s area but also several other brain regions respond to both conditions. It is worth noting that the right homologue of Broca’s area was modulated by both tasks. This would suggest that this area plays a role in speech processing. However, damage to the right frontal lobe rarely results in speech problems suggesting that task related modulation of the homologue of Broca’s area in the current study may be associated with its strong white matter connections to Broca’s area via the corpus callosum. Whereas right frontal activity may not reflect an active role for this area in speech processing, extensive evidence has shown that the right temporal lobe plays a role in speech perception. For example, in their Dual Stream model of speech perception Hickock and Poeppel (2007) suggest that the bilateral temporal lobe is associated with frequency encoding of speech; in contrast, their model does not implicate the right frontal lobe in speech processing (for an excellent review of the roles of the left and right hemispheres in speech perception see Scott, 2008).
It is important to emphasize that while our two tasks (speech viewing and speech production) included different instructions, the participants were administered the same stimulus paradigm twice. Accordingly, it is perhaps not surprising that the speech production task resulted in greater bilateral sensory-motor area activity compared to only speech viewing. The contrast ‘speech viewing > speech production’ did not yield statistically significant results even though the participants were required to press a button during the speech viewing task whenever the tongue of the speaker was visible. However, the tongue was only visible on approximately 10% of the stimuli suggesting that insufficient statistical power may have yielded a null result for those trials.
The present findings are consistent with the DIVA model of speech production (Guenther, Hampson, & Johnson, 1998; Guenther, 2006; Guenther, Ghosh, & Tourville, 2006) which ascribes the speech network to the left inferior frontal gyrus, the superior temporal lobe, and the supramarginal gyrus. The DIVA model also includes the cerebellum. However, due to the size of the volume covered by the fMRI sequence (3.25 m3), the whole cerebellum was not covered in all participants. Visual inspection of the first level fMRI analyses suggested that the cerebellum showed activity in both tasks (viewing and producing speech) for most of the participants whose whole cerebellum was imaged. However, this was not reflected in the higher-level analysis.
As discussed by Iacoboni and Wilson (2006), mirror neuron activity has been revealed in the macaque homologues of the human posterior, inferior frontal lobe, the inferior parietal lobe, and superior temporal sulcus during imitation of hand movements. Furthermore, these areas constitute the typical lesion sites for aphasia, suggesting their crucial involvement in language processing. Iacoboni and Wilson suggested that, indeed, these areas cannot be viewed as specifically subserving a speech/language network but rather reflect an inverse/forward mechanism that mirrors others’ actions, such as imitation of hand movements.
If Broca’s area not only supports speech production, but also the perception of speech movements, then AOS could have a receptive component as it has been associated with damage to Broca’s area (Hillis et al., 2004). While Square-Storer, Darley, and Sommers (1988) found that patients with AOS did not have difficulty with auditory speech discrimination, Schmid and Ziegler (2006) showed that AOS patients do have difficulty matching visual speech movements with their corresponding auditory speech sounds. Their findings complement the present results, suggesting that Broca’s area may play a role in the perception of others’ speech movements.
In conclusion, it is clear that brain areas involved in speech production are also modulated during visual perception of speech movements. It is quite tempting to suggest that Broca’s area recruitment reflects an active role for this region in speech perception. However, the present data cannot adjudicate whether intact Broca’s area is crucial for successful parsing of visual speech movements. Other techniques, such as TMS stimulation and stroke patient data may offer more convincing evidence regarding this issue.
Acknowledgments
This work was supported by grants (R03-005915; R01- DC008355) to JF from the National Institute on Deafness and Other Communication Disorders and a grant (R01-042047) to GCB from the National Institute on Neurological Disorders and Stroke.
References
- Bates E, Wilson SM, Saygin AP, Dick F, Sereno MI, Knight RT, et al. Voxel-based lesion-symptom mapping. Nature Neuroscience. 2003;6:448–450. doi: 10.1038/nn1050. [DOI] [PubMed] [Google Scholar]
- Beckmann CF, Jenkinson M, Smith SM. General multi-level linear modelling for group analysis in FMRI. NeuroImage. 2003;20:1052–1063. doi: 10.1016/S1053-8119(03)00435-X. [DOI] [PubMed] [Google Scholar]
- Bernstein LE, Auer ET, Moore JK, Ponton C, Don M, Singh M. Visual speech perception without primary auditory cortex activation. NeuroReport. 2002;13:311–315. doi: 10.1097/00001756-200203040-00013. [DOI] [PubMed] [Google Scholar]
- Bohland JW, Guenther FH. An fMRI investigation of syllable sequence production. Neuroimage. 2006;32(2):821–841. doi: 10.1016/j.neuroimage.2006.04.173. [DOI] [PubMed] [Google Scholar]
- Bonilha L, Moser D, Rorden C, Baylis G, Fridriksson J. Speech apraxia without oral apraxia: Can normal brain function explain the physiopathology? NeuroReport. 2006;17:1027–1031. doi: 10.1097/01.wnr.0000223388.28834.50. [DOI] [PubMed] [Google Scholar]
- Broca P. Loss of speech, chronic softening and partial destruction of the anterior left lobe of the brain. Bulletin de la Société Anthropologique de Paris. 1861;2:235–238. [Google Scholar]
- Broca P. Localisation of speech in the third left frontal convolution. Bulletin de la Société d’Anthropologie de Paris. 1865;6:377–393. [Google Scholar]
- Buccino G, Lui F, Canessa N, Patteri I, Lagravinese G, Benuzzi F, et al. Neural circuits involved in the recognition of actions performed by nonspecifics: An fMRI study. Journal of Cognitive Neuroscience. 2004;16:1–14. doi: 10.1162/089892904322755601. [DOI] [PubMed] [Google Scholar]
- Calvert GA, Campbell R. Reading speech from still and moving faces: The neural substrates of visible speech. Journal of Cognitive Neuroscience. 2003;15:57–70. doi: 10.1162/089892903321107828. [DOI] [PubMed] [Google Scholar]
- Calvert G, Campbell R, Brammer M. Evidence from functional magnetic resonance imaging of crossmodal binding in the human heteromodal cortex. Current Biology. 2000;10(11):649–657. doi: 10.1016/s0960-9822(00)00513-3. [DOI] [PubMed] [Google Scholar]
- Campbell R, MacSweeney M, Surguladze S, Calvert GA, McGuire PK, Brammer MJ, David AS, Suckling J. Cortical substrates for the perception of face actions: An fMRI study of the specificity of activation for seen speech and for meaningless lower-face acts (gurning) Cognitive Brain Research. 2001;12:233–243. doi: 10.1016/s0926-6410(01)00054-4. [DOI] [PubMed] [Google Scholar]
- Dronkers N. A new brain region for coordinating speech articulation. Nature. 1996;384:159–161. doi: 10.1038/384159a0. [DOI] [PubMed] [Google Scholar]
- Dronkers NF, Plaisant O, Iba-Zizen MT, Cabanis EA. Paul Broca’s historic cases: High resolution MR imaging of the brains of Leborgne and Lelong. Brain. 2007;130:1432–1441. doi: 10.1093/brain/awm042. [DOI] [PubMed] [Google Scholar]
- Ferrari PF, Fogassi L, Gallese V, Rizzolatti G. Mirror neurons responding to the observation of ingestive and communicative mouth actions in the monkey ventral premotor cortex. European Journal of Neuroscience. 2003;17(8):1703–1714. doi: 10.1046/j.1460-9568.2003.02601.x. [DOI] [PubMed] [Google Scholar]
- Fridriksson J, Bonilha L, Rorden C. Severe Broca’s aphasia without Broca’s area damage. Behav Neurol. 2007;18:237–8. doi: 10.1155/2007/785280. [DOI] [PMC free article] [PubMed] [Google Scholar]
- Fridriksson J, Moss J, Davis B, Baylis GC, Bonilha L, Rorden C. Motor speech perception modulates the cortical language areas. Neuroimage. 2008;41:605–13. doi: 10.1016/j.neuroimage.2008.02.046. [DOI] [PMC free article] [PubMed] [Google Scholar]
- Gallese V, Fadiga L, Fogassi L, Rizzolatti G. Action recognition in the premotor cortex. Brain. 1996;119:593–609. doi: 10.1093/brain/119.2.593. [DOI] [PubMed] [Google Scholar]
- Geschwind N. Disonnexion syndromes in animals and man. Brain. 1965;88(23):237–294. 583–644. doi: 10.1093/brain/88.2.237. [DOI] [PubMed] [Google Scholar]
- Guenther FH. Cortical interactions underlying the production of speech sounds. Journal of Communication Disorders. 2006;39:350–365. doi: 10.1016/j.jcomdis.2006.06.013. [DOI] [PubMed] [Google Scholar]
- Guenther FH, Ghosh SS, Tourville JA. Neural modeling and imaging of the cortical interactions underlying syllable production. Brain and Language. 2006;96(3):280–301. doi: 10.1016/j.bandl.2005.06.001. [DOI] [PMC free article] [PubMed] [Google Scholar]
- Guenther FH, Hampson M, Johnson D. A theoretical investigation of reference frames for the planning of speech movements. Psychological Review. 1998;105:611–633. doi: 10.1037/0033-295x.105.4.611-633. [DOI] [PubMed] [Google Scholar]
- Hall DA, Fussell C, Summerfield AQ. Reading Fluent Speech from Talking Faces: Typical Brain Networks and Individual Differences. Journal of Cognitive Neuroscience. 2005;17:939–953. doi: 10.1162/0898929054021175. [DOI] [PubMed] [Google Scholar]
- Hickok G, Poeppel D. The cortical organization of speech processing. Nat Rev Neurosci. 2007;8:393–402. doi: 10.1038/nrn2113. [DOI] [PubMed] [Google Scholar]
- Hillis AE, Work M, Barker PB, Jacobs MA, Breese EL, Maurer K. Re-examining the brain regions crucial for orchestrating speech articulation. Brain. 2004;127:1479–1487. doi: 10.1093/brain/awh172. [DOI] [PubMed] [Google Scholar]
- Iacoboni M, Wilson S. Beyond a single area: motor control and language within a neural architecture for imitation encompassing Broca’s area. Cortex. 2006;43:503–506. doi: 10.1016/s0010-9452(08)70387-3. [DOI] [PubMed] [Google Scholar]
- Jenkinson M, Bannister P, Brady M, Smith S. Improved optimisation for the robust and accurate linear registration and motion correction of brain images. NeuroImage. 2002;17:825–841. doi: 10.1016/s1053-8119(02)91132-8. [DOI] [PubMed] [Google Scholar]
- Lancaster JL, Summer JL, Rainey L, Freitas CS, Fox PT. The Talairach Daemon, a database server for Talairach Atlas Labels. Neuroimage. 1997;5(4):S633. [Google Scholar]
- Liberman AM, Cooper FS, Shankweiler DP, Studdert-Kennedy M. Perception of the speech code. Psychological Review. 1967;74(6):431–461. doi: 10.1037/h0020279. [DOI] [PubMed] [Google Scholar]
- MacSweeney M, Woll B, Campbell R, McGuire PK, David AS, Williams SCR, Suckling J, Calvert GA, Brammer MJ. Neural systems underlying British Sign Language and audiovisual English processing in native users. Brain. 2002;125:1583–1593. doi: 10.1093/brain/awf153. [DOI] [PubMed] [Google Scholar]
- Naeser MA, Palumbo CL, Helm-Estabrooks N, Stiassny-Eder D, Albert ML. Severe non-fluency in aphasia: Role of the medial subcallosal fasciculus plus other white matter pathways in recovery of spontaneous speech. Brain. 1989;112:1–38. doi: 10.1093/brain/112.1.1. [DOI] [PubMed] [Google Scholar]
- Nielsen FA, Hansen LK. Automatic anatomical labeling of Talairach coordinates and generation of volumes of interest via the BrainMap database. NeuroImage; Presented at the 8th International Conference on Functional Mapping of the Human Brain; June 2–6, 2002; Sendai, Japan. 2002. Available on CD-Rom. ( http://hendrix.ei.dtu.dk/services/jerne/ninf/voi.html) [Google Scholar]
- Ogar J, Willock S, Baldo J, Wilkins D, Ludy C, Dronkers N. Clinical and anatomical correlates of apraxia of speech. Brain and Language. 2006;97(3):343–350. doi: 10.1016/j.bandl.2006.01.008. [DOI] [PubMed] [Google Scholar]
- Paulesu E, Perani D, Blasi V, Silani G, Borghese NA, De Giovanni V, et al. A functional–anatomical model for lipreading. Journal of Neurophysiology. 2003;90:2005–2013. doi: 10.1152/jn.00926.2002. [DOI] [PubMed] [Google Scholar]
- Petrides M. Lateral prefrontal cortex: architectonic and functional organization. Philosophical Transactions of the Royal Society of London. Series B: Biological Sciences. 2005;360(1456):781–795. doi: 10.1098/rstb.2005.1631. [DOI] [PMC free article] [PubMed] [Google Scholar]
- Petrides M, Cadoret G, Mackey S. Orofacial somatomotor responses in the macaque monkey homologue of Broca’s area. Nature. 2005;435(7046):1235–1238. doi: 10.1038/nature03628. [DOI] [PubMed] [Google Scholar]
- Rizzolatti G, Arbib MA. Language within our grasp. Trends In Neurosciences. 1998;21(5):188–94. doi: 10.1016/s0166-2236(98)01260-0. [DOI] [PubMed] [Google Scholar]
- Rizzolatti G, Craighero L. The mirror-neuron system. Annual Review of Neuroscience. 2004;27:169–92. doi: 10.1146/annurev.neuro.27.070203.144230. [DOI] [PubMed] [Google Scholar]
- Rizzolatti G, Camarda R, Fogassi L, Gentilucci M, Luppino G, Matelli M. Functional organization of inferior area 6 in the macaque monkey. II. Area F5 and the control of distal movements. Experimental Brain Research. 1988;71:491–507. doi: 10.1007/BF00248742. [DOI] [PubMed] [Google Scholar]
- Rorden C, Brett M. Stereotaxic display of brain lesions. Behavioural Neurology. 2000;12:191–200. doi: 10.1155/2000/421719. [DOI] [PubMed] [Google Scholar]
- Schmid G, Ziegler W. Audio-visual matching of speech and non-speech oral gestures in patients with aphasia and apraxia of speech. Neuropsychologia. 2006;44(4):546–555. doi: 10.1016/j.neuropsychologia.2005.07.002. [DOI] [PubMed] [Google Scholar]
- Scott SK. Streams of processing and hemispheric asymmetries in speech perception. J Acoust Soc Am. 2008;123:3581. [Google Scholar]
- Shuster LI, Lemieux SK. An fMRI investigation of covertly and overtly produced mono-and multisyllabic words. Brain and Language. 2004;93:20–31. doi: 10.1016/j.bandl.2004.07.007. [DOI] [PubMed] [Google Scholar]
- Skipper JI, Nusbaum HC, Small SL. Listening to talking faces: motor cortical activation during speech perception. Neuroimage. 2005;25:76–89. doi: 10.1016/j.neuroimage.2004.11.006. [DOI] [PubMed] [Google Scholar]
- Smith SM. Fast robust automated brain extraction. Human Brain Mapping. 2002;17:143–155. doi: 10.1002/hbm.10062. [DOI] [PMC free article] [PubMed] [Google Scholar]
- Square-Storer Darley, Sommers Nonspeech and speech processing skills in patients with aphasia and apraxia of speech. Brain and Language. 1988;33:65–85. doi: 10.1016/0093-934x(88)90055-7. [DOI] [PubMed] [Google Scholar]
- Sumby WH, Pollack I. Visual contribution of speech intelligibility in noise. The Journal of the Acoustical Society of America. 1954;26:212–215. [Google Scholar]
- Tzourio-Mazoyer N, Landeau B, Papathanassiou D, Crivello F, Etard O, Delcroix N, et al. Automated anatomical labelling of activations in SPM using a macroscopic anatomical parcellation of the MNI MRI single subject brain. Neuroimage. 2002;15:273–289. doi: 10.1006/nimg.2001.0978. [DOI] [PubMed] [Google Scholar]
- Van Essen DC, Drury HA. Structural and Functional Analyses of Human Cerebral Cortex Using a Surface-Based Atlas. Journal of Neuroscience. 1997;17(18):7079–102. doi: 10.1523/JNEUROSCI.17-18-07079.1997. [DOI] [PMC free article] [PubMed] [Google Scholar]
- Van Wassenhove V, Grant KW, Poeppel D. Visual speech speeds up the neural processing of auditory speech. Proceedings of the National Academy of Sciences (PNAS) 2005;102:1181–1186. doi: 10.1073/pnas.0408949102. [DOI] [PMC free article] [PubMed] [Google Scholar]
- Watkins KE, Strafella AP, Paus T. Seeing and hearing speech excites the motor system involved in speech production. Neuropsychologia. 2003;41(8):989–94. doi: 10.1016/s0028-3932(02)00316-0. [DOI] [PubMed] [Google Scholar]
- Woolrich MW, Ripley BD, Brady JM, Smith SM. Temporal autocorrelation in univariate linear modeling of fMRI data. NeuroImage. 2001;14(6):1370–1386. doi: 10.1006/nimg.2001.0931. [DOI] [PubMed] [Google Scholar]
- Worsley KJ. An improved theoretical P value for SPMs based on discrete local. Neuroimage. 2005;28(4):1056–1062. doi: 10.1016/j.neuroimage.2005.06.053. [DOI] [PubMed] [Google Scholar]
- Worsley KJ, Evans AC, Marrett S, Neelin P. A three-dimensional statistical analysis for CBF activation studies in human brain. Journal of Cerebral Blood Flow and Metabolism. 1992;12:900–918. doi: 10.1038/jcbfm.1992.127. [DOI] [PubMed] [Google Scholar]