

Abstract
Rationale
Two previous studies have utilized Diffusion Tensor Imaging (DTI) to examine microstructural integrity in cocaine abuse and found evidence of brain abnormalities in white matter.
Objective
Using anatomical magnetic resonance imaging (MRI), DTI, and clinical evaluation, the macrostructural and microstructural correlates of cocaine abuse were investigated.
Methods
21 men and women (mean age 42.5, mean 18.9 years of cocaine use) and 21 age/gender-matched controls were included. Fractional anisotropy (FA) was measured in frontal white matter ROIs. Gray and white matter volumes in superior and inferior frontal regions were compared.
Results
DTI data revealed that cocaine users had lower FA than controls, specifically in inferior frontal white matter. FA differences were not seen in other areas. Significant volumetric differences were not seen, but both grey and white matter inferior frontal volumes trended toward smaller in the cocaine group. The data suggested that duration of use was associated with decreased grey and white matter volumes. FA and grey matter volume were correlated in cocaine users.
Conclusions
Both macrostructural and microstructural abnormalities were seen in a group of cocaine abusers. Length of cocaine use was associated with severity of the brain abnormalities. Future studies of white matter tissue integrity are warranted including examination of the relationship between DTI measures and traditional volumetric measures.
Keywords: Diffusion Tensor Imaging (DTI), Magnetic Resonance Imaging (MRI), brain, cocaine, abuse, dependence
1. Introduction
Chronic cocaine abuse is associated with cerebrovascular dysfunction which may contribute to significant neuropathology (Bruno, 2003; Neiman et al., 2000). Recent magnetic resonance (MR) imaging studies have provided strong evidence that cocaine abuse is associated with structural brain abnormalities in both gray matter (GM) and white matter (WM) (Bartzokis et al., 2002; Fein et al., 2002; Franklin et al., 2002; Lim et al., 2002; Moeller et al., 2005). Evidence from functional neuroimaging studies and investigations of neuropsychological deficits also point to long-term changes in brain status associated with cocaine abuse (Bolla et al., 2000; Goldstein et al., 2004; Volkow et al., 2005). Fully characterizing the nature of the underlying structural abnormalities in cocaine abusers is critical to understanding the impact of the drug on long-term functioning.
The initial imaging studies of cocaine abusers, using CT imaging, demonstrated ventricular enlargement and cerebral atrophy and showed an association between level of cocaine exposure and degree of ventricular enlargement (Pascual-Leone et al., 1991). An early MRI study of T1 and T2 relaxation times found no differences between cocaine users and controls in several GM and WM regions (Amass et al., 1992). In a volumetric study, Bartzokis et al. (2000) observed a significant temporal lobe GM volume decrement in cocaine users compared to controls as well as a negative correlation between volume and age among abstinent cocaine dependent subjects, suggesting that cocaine alters brain maturation. Bartzokis et al. (2002) also demonstrated alterations in WM, specifically showing that cocaine use was associated with an interruption in the normal expansion of frontal WM with age. Others have observed similar GM and WM volumetric differences in cocaine abusers (O’Neill et al., 2001). Decreased GM concentration in limbic structures has been reported in cocaine dependent patients (Franklin et al., 2002) in a study using voxel-based morphometry. Matochik et al. (2003) also found similar reductions in frontal GM concentration using a voxel-based approach in a sample of cocaine users who were abstinent at the time.
Several cocaine studies have examined white matter hyperintensities (WMHI) as these are often associated with demyelination or other WM disturbance. In the earliest study of this kind, Volkow et al. (1988b) observed a greater number of MRI focal signal hyperintensities in WM in drug abusers (cocaine or heroin), suggestive of demyelination. Bartzokis et al. (1999a) found a greater frequency of WMHI in cocaine users vs. controls in the cerebral WM and subinsular WM. Although WMHI occur in the course of normal aging, Bartzokis et al. (1999b) reported levels of WMHI in cocaine users that were similar to controls who were 20 year older. Lyoo et al. (2004) also reported WMHI, in both deep WM and insular WM, among cocaine dependent subjects.
Only two studies have employed diffusion tensor imaging (DTI) to examine the effect of chronic cocaine use on WM. Lim et al. (2002) first reported evidence of low WM integrity (lower fractional anisotropy—FA) of inferior frontal WM in male cocaine dependent subjects compared with male control subjects. No significant group differences were observed in temporal WM or in corpus callosum. Moeller and colleagues used DTI to examine WM in the corpus callosum of cocaine dependent subjects and control subjects (Moeller et al., 2005). Cocaine dependent subjects showed lower FA in the genu and rostral body compared with control subjects.
To date, no study of cocaine users has examined both brain tissue volume (macrostructure) and tissue organization (microstructure) in the same subjects. In the current study, we employed conventional volumetrics and DTI in order to examine correlates of chronic cocaine abuse at both macrostructural and microstructural levels in the same individuals. In addition, we included a larger number of cocaine users with a wide range of abuse duration in order to examine relationships between exposure level and structural brain integrity.
2. Methods
2.1 Subjects
The subjects included 21 chronic cocaine users (CocDep) (11 male and 10 female) and 21 control subjects (CTL) (11 male and 10 female). Subject characteristics are contained in Table 1. Subjects ranged in age from 22 to 54. Lifetime cocaine use ranged from 3 years to 38 years with a mean of 18.9 years. CocDep subjects were recruited in the Minneapolis, MN metropolitan area via advertising placed in a University newspaper and a free local-area publication. Fliers were also placed on community bulletin boards throughout the metro area and campus. CTL subjects were recruited via fliers posted on community and staff bulletin boards throughout campus and the metro area and through an on-line employee newsletter.
Table 1.
Subject characteristics for cocaine users and controls.
| Control Group (N = 21) | Cocaine Group (N = 21) | |
|---|---|---|
| Sex (% male) | 52% | 52% |
| Handedness (% right) | 90 | 85.7 |
| Age (years) | 40.9 (7.4) | 42.5 (6.1) |
| Education (years) | 15.5 (1.3) | 13.1 (1.7) |
| Lifetime cocaine use (years) | 0 | 18.9 (8.4) |
| Alcohol use (days per prior month) | 3.90 (7.2) | 6.9 (6.7) |
2.2 Diagnostic screening
Informed consent was obtained from participants by investigators and staff. The consent process and all procedures were reviewed and approved by the institutional review board (IRB) at the University of Minnesota prior to initiating studies. HIPAA consent documentation was also obtained. All subjects underwent a Structured Clinical Interview for DSM-IV Axis I Conditions (SCID) (First, 1995) administered by a trained member of the research staff. Cocaine dependent subjects received the SCID I/P (patient version) and healthy controls received the SCID I/NP (non-patient version).
Inclusion criteria for all subjects were as follows: 1) ability to provide written consent and comply with study procedures; 2) cocaine using subjects only: met DSM-IV diagnostic criteria for cocaine dependence within the last month, based on the Structured Clinical Interview for DSM-IV (SCID), and abstinence for at least four days as documented by self report; 3) minimum of 6 months of self-reported cocaine use (including intravenous, nasal, smoking or combinations of methods of use) and must have used at least 6 days in the last month. Cocaine use was confirmed by urine drug screen.
Unless indicated, potential subjects were excluded if they met any of the following criteria: 1) a serious neurological or endocrine disorder or any medical condition or treatment known to affect the brain; 2) a medical condition which requires treatment with a medication with psychotropic effects; 3) evidence of stroke or space-occupying lesions observed on conventional, clinical MR images; 4) any contraindications to MRI scanning (i.e., metal implants, pacemakers, etc.); 5) documented loss of consciousness (LOC) for longer than 30 minutes or LOC with any neurological sequelae; 6) DSM-IV criteria for mental retardation; 7) current or a history of active neurological disorder, dementia or DSM-IV Axis I Psychiatric Disorder, with the exception of cocaine dependent subjects who may have a lifetime but not current diagnosis of depression; 8) control subjects only: any form of substance abuse or dependence except for nicotine and caffeine, or positive illicit drug urine toxicology screen (all control subjects were screened) or HIV seropositivity; and 9) cocaine subjects only: current dependence on any psychoactive substance other than cocaine, caffeine or nicotine; or positive urine toxicology screen for any drug other than cocaine.
CocDep subjects were administered the Addiction Severity Index (ASI) (McLellan et al., 1992), a standardized face-to-face clinical interview commonly used in substance abuse research. For purposes of this study, data were extracted that quantified subjects’ cocaine use as well as alcohol and other drug use. The Barratt Impulsiveness Scale (BIS-11), a 30-item self-report measure assessing self-control and ability to delay gratification (Patton et al., 1995), was also administered.
2.3 MR image acquisition
MRI was performed on a 3 Tesla scanner (Trio, Siemens, Erlangen, Germany) using the standard quadrature head coil. A three plane localizer scout was acquired and used to position the subsequent scans. Anatomical scans with T1 and PD contrasts were collected to allow for tissue segmentation. The T1 weighted images were acquired coronally, using a 3D FLASH sequence (TR=25 ms, TE=9.5ms, flip angle =25 degrees, acquisition matrix of 256×176, 240 partitions, 1mm isotropic voxel, flow compensation). Proton density (PD) and T2-weighted images were acquired axially using a dual echo turbo spin echo (TSE) sequence (TR=5590ms, TE=14ms and 113ms, flip angle=149 degrees, 80 slices, thickness=2mm, FOV=256×256mm, matrix=256×256, 2 concatenations). The DTI data were acquired axially, positioned to cover the entire cerebrum and as much of the cerebellum as was possible. The center of the PD/T2 acquisition was identical to that of the DTI acquisition. The DTI data were acquired using a dual spin echo, single shot, pulsed gradient echo planar imaging sequence (TR=10s, TE=97ms, 64 slices, thickness=2mm, FOV=320×320mm, matrix=128×128, 6/8 partial Fourier, 3 averages), b value=1000s/mm2. Diffusion was measured along 12 non-collinear directions: (Gx,Gy,Gz) = [1.0,0.0,0.5], [0.0,0.5,1.0], [0.5,1.0,0.0], [1.0,0.5,0.0], [0.0,1.0,0.5], [0.5,0.0,1.0], [ 1.0, 0.0,−0.5], [ 0.0, −0.5, 1.0], [−0.5, 1.0, 0.0], [ 1.0, −0.5, 0.0], [ 0.0, 1.0, −0.5], [−0.5, 0.0, 1.0].
2.4 Anatomical image processing
Image processing was performed using several tools from the FMRIB Software Library developed by the Oxford Centre for Functional Magnetic Resonance Imaging of the Brain (http://www.fmrib.ox.ac.uk/). The brain was extracted from T1 and PD images using the Brain Extraction Tool (BET). The brain from the PD acquisition was aligned to the T1 brain using linear registration (FLIRT), allowing rotation and translation but no scaling (6 DoF). Dual channel segmentation was performed on the T1 and aligned PD brains, using the FMRIB automated segmentation tool (FAST), producing four tissue classes (CSF, white, gray, and blood).
Masks for three regions (whole cerebrum, inferior frontal and superior frontal) were defined for analysis based on anatomical landmarks (Figure 1). To account for variability in subject position and anatomy, the landmarks were determined based on the subject’s T1, aligned to the FSL template brain using FLIRT (12 DoF). The axial plane containing the AC-PC points and the coronal plane at the anterior extent of the genu were determined manually for each subject on the aligned T1. Brain voxels anterior to and including the genu plane were defined as the frontal region with the AC-PC plane delimiting the superior frontal (above the plane) and inferior frontal (at and below the plane) regions. A cerebrum mask was defined to be the FSL ‘strucseg’ mask, excluding the brain stem and cerebellum compartments, and the cerebrum region was defined to be brain voxels within cerebrum mask. The masks for the superior and inferior frontal regions and the cerebrum were transformed back onto the original T1 brain using the inverse transform. The masks for each of the three regions were applied to the masks from each of the four tissue classes in each region of interest. Frontal regional volumes (Figure 1) were adjusted for head size by dividing by total cerebral volume.
Figure 1.

Regions of interest used for volumetric calculations: inferior frontal (orange) and superior frontal (blue).
2.5 Diffusion tensor image processing
We first applied a non-linear warping correction to every diffusion volume to compensate for residual eddy current distortions (Haselgrove and Moore, 1996). Twelve maps of the apparent diffusion coefficient (ADC) were computed from the eddy current corrected images, and then used to compute the diffusion tensor. The scalar measure fractional anisotropy (FA) was derived from the tensor. FA is a commonly used measure of diffusion anisotropy (Basser, 1995), and is the ratio of the anisotropic component to the entire tensor. FA ranges between 0 (perfectly isotropic diffusion) and 1 (perfectly anisotropic, diffusion along a line).
To allow for ROI placement in the same anatomy across subjects, the diffusion images were aligned to a common space using FLIRT. First, the DTI b=0 diffusion image was aligned to the PD image (6 DoF). Next, the PD brain was aligned to the FSL template brain (6 DoF fit). The b=0 image was aligned to the FSL template brain by applying the product of transforms from the b=0 to PD brain and PD brain to template transforms to the original b=0 image. The FA maps were aligned to the template brain by applying the same transforms.
Multiple circular ROIs were placed on the AC-PC aligned DTI B=0 images of each subject by a trained operator (C.P.R.) who was blind to subject group. ROIs were placed bilaterally at several levels in frontal WM. Relative to the AC-PC line, small ROIs (20 mm2) were placed in inferior frontal WM at −4 mm and −8 mm. ROIs were also placed in superior frontal WM at +8 mm (medium – 77 mm2) and +12 mm (large- 150 mm2). The −4 mm and −8 mm ROIs were positioned within the medial portion of the WM tracts on a line located within the coronal plane immediately anterior to the genu. The remaining frontal ROIs were placed within the central portion of the WM tracts and positioned anterior to the frontal horns of the lateral ventricles. Two additional medium ROIs were placed in left and right occipital WM adjacent to the occipital horns at a level +12 mm superior to the AC-PC plane. These occipital ROIs were defined for purposes of obtaining FA from a “control region”, a region not expected to show group differences. Reliability of this ROI placement method has been examined in our laboratory in another sample (n = 20) and found to be high (r =.867). Because of the relatively small number of subjects included in this study, these ROIs were combined within regions to reduce the number of statistical tests performed: A “superior frontal” ROI was computed from the mean of right and left ROIs at +8 mm and +12 mm; an “inferior frontal” ROI was the mean of right and left ROIs at −4 mm and −8 mm; an “occipital” ROI was the mean of the right and left occipital ROIs.
2.6 Exploratory voxel-wise analyses
The FA data was also examined in a set of exploratory voxel-wise analyses. For these analyses, the FA maps were registered to a median brain from the control group using IRTK (a component of TBSS (Smith et al., 2006)), resulting in interpolated 1 mm3 FA maps. Accurate alignment was visually verified by examining major tracts (corpus callosum, internal capsule, optic radiations) for each subject. In order to reduce the potential impact of mis-alignment, a white matter mask was defined and analyses were subsequently limited to major white matter tracts common to all images in the registered set. Individual white matter masks were produced by thresholding each subject’s FA map to FA>.35. Only regions that included voxels in common to each subject were included in the analyses.
In-house software—previously described in (Lim et al., 2006)—was used to determine regions of group FA differences in using voxel-wise t-tests. In order to correct for multiple comparisons, seed voxels of high significance were identified that were adjacent to clusters of voxels with significance levels adjusted with a False Discovery Rate correction (Genovese et al., 2002). Seed voxels were first determined (p<.005) and regional clusters of over 200 voxels with p<.05 (FDR-adjusted) are reported. Cluster regions were transformed into Talairach space using AFNI (Cox, 1996) for anatomical identification.
For the CocDep group only, voxel-wise Pearson correlations were computed between FA values and BIS-11 score. Clusters of over 200 voxels (p<.05) were identified after finding a seed voxel of at least p<.005. Average Pearson r values and average p values are reported for each cluster.
3. Results
3.1 Subject characteristics
The groups were matched according to age and gender. As a result, there were no significant group differences on these variables. Although an attempt was made to match subjects on education, an ANOVA revealed a significant difference between the groups [F(1,40) = 28.87, p <.001] with control subjects having 2.4 more years of education than cocaine users. Alcohol use (number of days used in the last month) did not differ significantly between cocaine users and controls.
3.2 Diffusion tensor imaging findings
A MANOVA, which tested for group differences (CTL vs. CocDep) in all three ROIs revealed a significant group difference [Wilks’ lambda =.709, F(3,38) = 5.188, p =.004]. Univariate tests for the three ROIS revealed a significant difference in the inferior frontal region [F(1,42) = 13.488, p =.001] but not in the superior frontal [F(1,42) =.024, p =.878] or occipital regions [F(1,42) =.295, p =.590]. CocDep subjects had significantly lower FA than CTL subjects in inferior frontal WM [Cohen’s d effect size = 1.13]. Within the CocDep group (n=21) a linear regression analysis on inferior frontal FA with age and years of cocaine abuse entered as predictor variables was non-significant [R2=.053, F(2,18) =.506, p =.611]. Neither age [beta =.235, t=.812, p=.428] nor years of cocaine use [beta = −.280, t = −.966, p =.347] accounted for a significant amount of the variance in inferior frontal FA. A second regression analysis showed no relationship between days of alcohol use in the previous month and inferior frontal FA in the CocDep group [R2=.008, F(1,19) =.150, p =.703]. In contrast to the CocDep group, a regression analysis for CTL subjects demonstrated a significant relationship between age and inferior frontal FA, [R2=.445, F(1,19) = 4.70, p =.043]. In that group, FA declined with age.
3.3 Volumetric findings in cocaine dependence
A MANOVA was used to test for group differences on four volumes: inferior frontal WM and GM and superior frontal WM and GM. The overall analysis was not significant but did indicate a clear trend toward a group difference among the four volumes [Wilks’ lambda =.794, F(4,37) = 2.40, p =.067]. Because of this strong trend, the univariate effects were examined. This examination showed no evidence of group differences in the superior frontal region: WM [F(1,42) =.626, p =.433]; GM [F(1,42) =.156, p =.695]. In contrast, the CocDep group had smaller inferior frontal GM volumes than controls [F(1,42) = 5.961, p =.019, effect size =.73] and there was a trend toward a smaller inferior frontal WM volume in the CocDep group [F(1,42) = 3.370, p =.074, effect size =.61]. On the basis of these findings, two regression analyses were carried out to examine relationships with duration of cocaine use in the CocDep group. The first regression, examining inferior frontal WM volume with age and years of cocaine use entered as predictors, was significant [R2=.319, F(2,18) = 4.208, p =.032]. Older age was associated with greater inferior frontal WM volume [beta =.691, t = 2.813, p =.012], and longer duration of cocaine use was independently associated with decreased inferior frontal WM volume [beta = −.561, t = −2.281, p =.035]. The second regression analysis, examining inferior frontal GM volume with age and years of cocaine use as predictors, was not significant, but there was a trend [R2 =.251, F(2,18) = 3.008, p =.075]. Examining the coefficients from this analysis suggests that age was not significantly associated with inferior frontal GM volume [beta =.344, t = 1.334, p =.199], but duration of cocaine use may be associated [beta = −.630, t = −2.444, p =.025]. Figures 3 and 4 illustrate the relationships between duration of cocaine use and inferior frontal WM and GM volumes after controlling for the effects of age. Among CTL subjects, age was not associated with inferior frontal WM volume, [R2 =.044, F(1,19) =.037, p =.850] nor GM volume, [R2 =.081, F(1,19) = 1.27, p =.726].
Figure 3.

Inferior frontal white matter volume as a function of duration of cocaine use after controlling for age.
Figure 4.

Inferior frontal gray matter volume as a function of duration of cocaine use after controlling for age.
3.4 Relationships between DTI and volumetric measures
On the basis of the significant group difference in both inferior frontal FA and a trend toward group differences in GM and WM volumes, Pearson correlations were computed to examine the relationships between these variables across all subjects (n = 42). FA was significantly correlated with GM volume in the inferior frontal region [r =.403, p =.008], but FA was not significantly correlated with WM volume in that same region [r =.229, p =.145]. When the sample was limited to only the cocaine users (n=21), the relationships were essentially the same for GM volume [r =.430, p =.050] and for WM volume [r =.217, p =.346].
3.5 Relationships between neuroimaging and behavioral measures
For the CocDep group, Pearson correlations were computed between the BIS and inferior frontal FA as well as WM and GM volumes in the inferior frontal region. None of these correlations was significant [r=.214, p =.365 for FA, r =.189, p =.426 for WM volume, and r =.267, p =.255 for GM volume].
3.6 Results of exploratory voxel-wise analyses
Table 2 contains results from the voxel-wise t-tests for group differences in FA. These results are also illustrated in Figure 5. The CocDep group showed clusters of lower FA than controls in frontal WM and internal capsule, and body and splenium of the corpus callosum. There were no significant clusters of higher FA for the CocDep group.
Table 2.
Voxel-wise t-test results showing white matter regions with significant clusters of group difference in fractional anisotropy.
| Brain region | Cluster size (cm3) | Average p-value | Talairach coordinates (xyz) |
|---|---|---|---|
| Right inferior frontal | 0.28 | 0.016 | 11 46 −20 |
| Left inferior frontal | 0.21 | 0.021 | −12 45 −20 |
| Right internal capsule | 2.53 | 0.014 | 25 −28 5 |
| Left internal capsule | 1.43 | 0.015 | −26 −30 12 |
| Splenium, corpus callosum | 1.3 | 0.017 | 1 −35 10 |
| Body, corpus callosum | 0.78 | 0.017 | −9 14 20 |
Figure 5.

Voxel-wise t-test results showing regions of low FA in cocaine users compared to controls. White matter regions include inferior frontal, internal capsule and body and splenium of the corpus callosum.
Table 3 contains results from the voxel-wise correlational analysis examining the relationship between BIS-11 score and FA for the CocDep group only. These data indicate that low FA in internal capsule and the genu and body of the corpus callosum is associated with increased impulsivity as measured by the BIS-11. These results are also illustrated in Figure 6.
Table 3.
Voxel-wise correlation results showing white matter regions with a significant inverse relationship between the Barratt Impulsiveness Scale score and fractional anisotropy (cocaine users only).
| Brain region | Cluster size (cm3) | Average p-value | Pearson r-value | Talairach Coordinates (xyz) |
|---|---|---|---|---|
| Left Internal capsule | 0.92 | .022 | −.512 | −25 −23 12 |
| Genu, corpus callosum | 0.23 | .023 | −.507 | 9 −40 10 |
| Body, corpus callosum | 0.21 | .026 | −.499 | −10 9 22 |
Figure 6.

Voxel-wise correlation results, for cocaine users only, showing regions in which low fractional anisotropy was related to high impulsivity. White matter regions include the internal capsule and genu and body of the corpus callosum.
4. Discussion
The current data indicate that cocaine abuse is associated with abnormalities in inferior frontal white matter as evidenced by an alteration in FA and trends toward smaller WM and GM volumes in that same brain region. The exploratory voxel-wise analyses suggest that there are additional regions of low FA in subjects who abuse cocaine. Furthermore, the data suggest a possible relationship between FA levels and a potentially important clinical variable –impulsivity. The underlying mechanisms for these abnormalities are not well understood. Within cerebral WM, vasoconstriction and associated hypoperfusion may be an important pathophysiological mechanism. A gerbil model has been described which reduces cerebral blood flow to 75% of normal flow. Following chronic hypoperfusion, animals developed learning impairments in a passive avoidance paradigm (Kudo et al., 1990). Lesions specific to WM, resembling the leukoariosis seen in the aging brain, were also seen in these animals (Hattori et al., 1992). Western blotting was used to examine the molecular changes in WM following chronic hypoperfusion. Myelin basic protein (MBP), a marker for myelin, was low; neurofilament H (NFH), a marker of axons, was decreased; and glial fibrillary acidic protein, a marker of astroglia, was increased (Kurumatani et al., 1998). The decrease in MBP preceded the decrease in NFH, leading the authors to conclude that the change in myelin is the primary pathological event in cerebral WM under chronic hypoperfusion. Relatedly, a gene expression study of the nucleus accumbens in cocaine users found a reduction in the expression of myelin-related genes (Albertson et al., 2004).
In vivo human neuroimaging work has provided further support for the hypoperfusion model in cocaine abuse. Decreased cerebral blood flow, as measured by FDG-PET, selective to the prefrontal cortex has been reported in cocaine users (Volkow et al., 1988a). Similarly, decreased frontal brain glucose metabolism has been found in cocaine dependent subjects at baseline and at 3 months (Volkow et al., 1992). Significant negative correlations were found between the average weekly dose of cocaine used and frontal metabolic activity. Perfusion defects, measured with SPECT, have also been observed in cocaine users (Holman et al., 1991). These abnormalities persist even after 6 months of abstinence, along with impairments observed in attention, concentration, new learning, visual and verbal memory, word production, and visuomotor integration (Strickland et al., 1993). Chronic hypoperfusion may be linked to cocaine-induced changes in vasoconstriction. Vasoconstriction in a low dose cocaine challenge study was assessed using MRI angiography (Kaufman et al., 1998). A dose response with degree of vasconstriction was found; subjects with prior cocaine use had greater likelihood of vasoconstriction, suggesting that cocaine may have cumulative residual effects that contribute to chronic cerebrovascular dysfunction.
Proton spectroscopy studies have provided additional information on the brain effects of cocaine use. Chang et al. (1999) found lower levels of the neuronal/axonal marker N-acetyl aspartate (NAA) in frontal GM but not WM in a sample of young abstinent cocaine users. Higher levels of the glial marker myoinositol were found in both GM and WM in cocaine users. NAA/creatine ratio was low and myoinositol/creatine was high in WM in cocaine users. The low levels of NAA suggest neuronal/axonal damage; the high level of myoinositol could represent glial hypertrophy or proliferation. Meyerhoff et al. (1999) found higher choline containing compounds in the frontal WM of the cocaine dependent subjects who were abstinent for four months. Low levels of the neuronal/axonal marker, N-acetyl aspartate (NAA), were found in prefrontal GM and central WM. The low NAA was interpreted as evidence of axonal damage and higher choline in frontal WM indicative of gliosis. Taken together, these proton spectroscopy studies suggest that there may be axonal damage, perhaps related to a reactive process involving the glia. The low axonal content in WM, as measured with spectroscopy, suggests that there is an alteration in major tracts forming the anatomical basis for cortical connectivity (Lim et al., 1998).
Although the current study sheds further light on the potential brain effects of chronic cocaine use and the data fits well with the existing models of the pathophysiology of cocaine, there are limitations to the generalizability of the data reported here. The focus of the current study was active cocaine users, not abstinent users. Thus, these data do not directly address whether the observed effects are chronic and/or permanent effects. Furthermore, relatively limited information about the subjects’ actual exposure to cocaine was available, as is common in this type of study. The measure “years of use” allows for only a gross characterization of exposure. Despite these limitations, the current data do indicate that longer duration of cocaine use is associated with smaller white matter volume and, possibly, smaller grey matter volume in the inferior frontal region. These effects were independent of age-related effects. These data are generally consistent with previous studies, suggesting a possible alteration in normal brain maturation among cocaine users (Bartzokis et al., 2002), although we did not observe age-related significant increases in grey or white matter volumes with age among our controls. An intriguing finding was that inferior frontal FA was decreased in cocaine users, but this decrease was unrelated to age or duration of use. This suggests that a change in white matter FA may have occurred very early in the course of the cocaine use or, possibly, that the difference was pre-existing.
Another limitation of the current data is an inherent problem in studying this population: co-morbid substance use. We attempted to address this issue by imposing strict exclusion criteria and by limiting the level of alcohol use in both the cocaine abusing sample and controls. Analyses showed that the groups did not differ in their alcohol use and that alcohol use was moderate overall. Although other investigators employing DTI have found WM microstructural abnormalities in patients with chronic alcohol abuse (Pfefferbaum and Sullivan, 2002, 2005), the alcohol use in those samples was substantially higher than in the current study. Likewise, a direct comparison of cocaine users and cocaine + alcohol users has been published, and this study showed no significant differences in prefrontal volumes (Fein et al., 2002). Ultimately, a DTI study incorporating an alcohol-only control group will help to clarify the findings.
Lastly, we cannot rule out the possibility that the differences we observed in brain integrity were pre-existing. For example, education level may be relevant. Although careful group matching was attempted, the cocaine users had less education than the control group. We did not observe any significant correlations between our brain measures and education, but this does not rule out the potential contribution of education level or related variables on our outcome measures. In considering the impact of other subject variables, one could also hypothesize that pre-existing alterations in inferior frontal tissue integrity could potentially pre-dispose an individual toward developing an addiction. The current data, which suggest an age-interaction with GM and WM volumes but not with FA in cocaine users, suggest that FA differences may be a better target for investigating pre-existing group differences.
Despite these limitations, the data do suggest that both volumetric measures and DTI measures are sensitive to the alterations in brain structure that are present in chronic cocaine abuse. Furthermore, the data show a relationship between FA (a potential measure of white matter integrity) and a self report measure of impulsivity (a potentially very relevant clinical variable). Both macrostructural and microstructural data clearly have the potential to contribute significantly to our understanding of the neural correlates of serious drug addiction.
Figure 2.
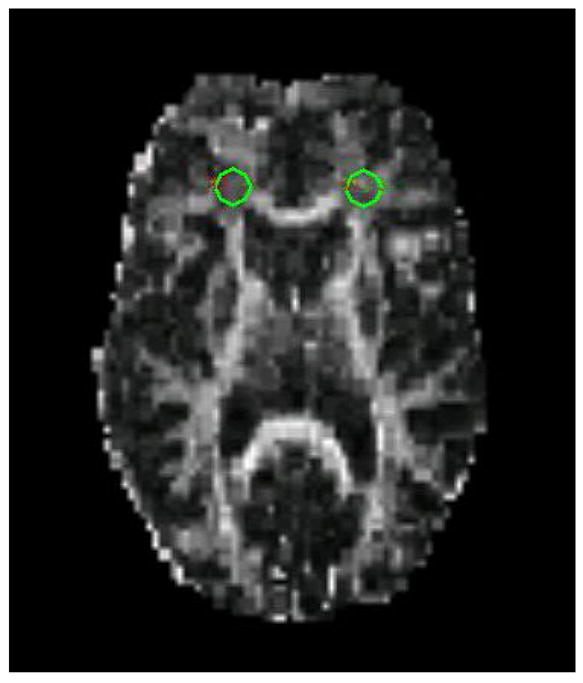
Example of ROI placement in frontal white matter on a DTI image.
Acknowledgments
Funding Source
Funding for this study was provided by NIDA grant R21DA-015330 (Dr. Lim), NCRR grant P41RR-008079, and the MIND Institute. Neither the NIH nor the MIND Institute had any role in the study design, data collection, data analysis, data interpretation, writing of the report, on in the decision to submit the paper for publication.
We would like to thank Jeremy Doughan and Kari Pantekoek for their efforts in subject recruitment, clinical and neurocognitive data collection, and data management.
Footnotes
Contributors
Kelvin Lim and John Rotrosen were responsible for study design; Jeffrey Wozniak was responsible for data analysis and initial preparation of the manuscript; Bryon Mueller, Dan Franc, and Craig Rodriguez were responsible for data collection and image analysis; Sheila Specker was responsible for subject recruitment and data collection; Amy Silverman was responsible for study coordination and data collection. All authors were involved in the final preparation of the manuscript and all have approved the final version.
Conflict of Interest
The authors have no conflicts of interest to disclose.
Publisher's Disclaimer: This is a PDF file of an unedited manuscript that has been accepted for publication. As a service to our customers we are providing this early version of the manuscript. The manuscript will undergo copyediting, typesetting, and review of the resulting proof before it is published in its final citable form. Please note that during the production process errors may be discovered which could affect the content, and all legal disclaimers that apply to the journal pertain.
References
- Albertson DN, Pruetz B, Schmidt CJ, Kuhn DM, Kapatos G, Bannon MJ. Gene expression profile of the nucleus accumbens of human cocaine abusers: Evidence for dysregulation of myelin. J Neurochem. 2004;88(5):1211–1219. doi: 10.1046/j.1471-4159.2003.02247.x. [DOI] [PMC free article] [PubMed] [Google Scholar]
- Amass L, Nardin R, Mendelson JH, Teoh SK, Woods BT. Quantitative magnetic resonance imaging in heroin- and cocaine-dependent men: A preliminary study. Psychiatry Res. 1992;45(1):15–23. doi: 10.1016/0925-4927(92)90010-2. [DOI] [PubMed] [Google Scholar]
- Bartzokis G, Beckson M, Hance DB, Lu PH, Foster JA, Mintz J, Ling W, Bridge P. Magnetic resonance imaging evidence of “silent” cerebrovascular toxicity in cocaine dependence. Biol Psychiatry. 1999a;45(9):1203–1211. doi: 10.1016/s0006-3223(98)00228-5. [DOI] [PubMed] [Google Scholar]
- Bartzokis G, Beckson M, Lu PH, Edwards N, Bridge P, Mintz J. Brain maturation may be arrested in chronic cocaine addicts. Biol Psychiatry. 2002;51(8):605–611. doi: 10.1016/s0006-3223(02)01315-x. [DOI] [PubMed] [Google Scholar]
- Bartzokis G, Beckson M, Lu PH, Edwards N, Rapoport R, Wiseman E, Bridge P. Age-related brain volume reductions in amphetamine and cocaine addicts and normal controls: Implications for addiction research. Psychiatry Res. 2000;98(2):93–102. doi: 10.1016/s0925-4927(99)00052-9. [DOI] [PubMed] [Google Scholar]
- Bartzokis G, Goldstein IB, Hance DB, Beckson M, Shapiro D, Lu PH, Edwards N, Mintz J, Bridge P. The incidence of t2-weighted mr imaging signal abnormalities in the brain of cocaine-dependent patients is age-related and region-specific. AJNR Am J Neuroradiol. 1999b;20(9):1628–1635. [PMC free article] [PubMed] [Google Scholar]
- Basser PJ. Inferring microstructural features and the physiological state of tissues from diffusion-weighted images. NMR Biomed. 1995;8(7–8):333–344. doi: 10.1002/nbm.1940080707. [DOI] [PubMed] [Google Scholar]
- Bolla KI, Funderburk FR, Cadet JL. Differential effects of cocaine and cocaine alcohol on neurocognitive performance. Neurology. 2000;54(12):2285–2292. doi: 10.1212/wnl.54.12.2285. [DOI] [PubMed] [Google Scholar]
- Bruno A. Cerebrovascular complications of alcohol and sympathomimetic drug abuse. Curr Neurol Neurosci Rep. 2003;3(1):40–45. doi: 10.1007/s11910-003-0035-8. [DOI] [PubMed] [Google Scholar]
- Chang L, Ernst T, Strickland T, Mehringer CM. Gender effects on persistent cerebral metabolite changes in the frontal lobes of abstinent cocaine users. Am J Psychiatry. 1999;156(5):716–722. doi: 10.1176/ajp.156.5.716. [DOI] [PubMed] [Google Scholar]
- Cox RW. Afni: Software for analysis and visualization of functional magnetic resonance neuroimages. Comput Biomed Res. 1996;29(3):162–173. doi: 10.1006/cbmr.1996.0014. [DOI] [PubMed] [Google Scholar]
- Fein G, Di Sclafani V, Meyerhoff DJ. Prefrontal cortical volume reduction associated with frontal cortex function deficit in 6-week abstinent crack-cocaine dependent men. Drug Alcohol Depend. 2002;68(1):87–93. doi: 10.1016/s0376-8716(02)00110-2. [DOI] [PMC free article] [PubMed] [Google Scholar]
- First MB, Spitzer RL, Gibbon M, Williams JBW. Structured clinical interview for axis i dsm-iv disorders - patient edition (scid-i/p, version 2.0) New York: Biometrics Research Department, New York State Psychiatric Institute; 1995. [Google Scholar]
- Franklin TR, Acton PD, Maldjian JA, Gray JD, Croft JR, Dackis CA, O’Brien CP, Childress AR. Decreased gray matter concentration in the insular, orbitofrontal, cingulate, and temporal cortices of cocaine patients. Biol Psychiatry. 2002;51(2):134–142. doi: 10.1016/s0006-3223(01)01269-0. [DOI] [PubMed] [Google Scholar]
- Genovese CR, Lazar NA, Nichols T. Thresholding of statistical maps in functional neuroimaging using the false discovery rate. Neuroimage. 2002;15(4):870–878. doi: 10.1006/nimg.2001.1037. [DOI] [PubMed] [Google Scholar]
- Goldstein RZ, Leskovjan AC, Hoff AL, Hitzemann R, Bashan F, Khalsa SS, Wang GJ, Fowler JS, Volkow ND. Severity of neuropsychological impairment in cocaine and alcohol addiction: Association with metabolism in the prefrontal cortex. Neuropsychologia. 2004;42(11):1447–1458. doi: 10.1016/j.neuropsychologia.2004.04.002. [DOI] [PubMed] [Google Scholar]
- Haselgrove JC, Moore JR. Correction for distortion of echo-planar images used to calculate the apparent diffusion coefficient. Magn Reson Med. 1996;36(6):960–964. doi: 10.1002/mrm.1910360620. [DOI] [PubMed] [Google Scholar]
- Hattori H, Takeda M, Kudo T, Nishimura T, Hashimoto S. Cumulative white matter changes in the gerbil brain under chronic cerebral hypoperfusion. Acta Neuropathol (Berl) 1992;84(4):437–442. doi: 10.1007/BF00227672. [DOI] [PubMed] [Google Scholar]
- Holman BL, Carvalho PA, Mendelson J, Teoh SK, Nardin R, Hallgring E, Hebben N, Johnson KA. Brain perfusion is abnormal in cocaine-dependent polydrug users: A study using technetium-99m-hmpao and aspect. J Nucl Med. 1991;32(6):1206–1210. [PubMed] [Google Scholar]
- Kaufman MJ, Levin JM, Ross MH, Lange N, Rose SL, Kukes TJ, Mendelson JH, Lukas SE, Cohen BM, Renshaw PF. Cocaine-induced cerebral vasoconstriction detected in humans with magnetic resonance angiography. Jama. 1998;279(5):376–380. [PubMed] [Google Scholar]
- Kudo T, Tada K, Takeda M, Nishimura T. Learning impairment and microtubule-associated protein 2 decrease in gerbils under chronic cerebral hypoperfusion. Stroke. 1990;21(8):1205–1209. doi: 10.1161/01.str.21.8.1205. [DOI] [PubMed] [Google Scholar]
- Kurumatani T, Kudo T, Ikura Y, Takeda M. White matter changes in the gerbil brain under chronic cerebral hypoperfusion. Stroke. 1998;29(5):1058–1062. doi: 10.1161/01.str.29.5.1058. [DOI] [PubMed] [Google Scholar]
- Lim KO, Adalsteinsson E, Spielman D, Sullivan EV, Rosenbloom MJ, Pfefferbaum A. Proton magnetic resonance spectroscopic imaging of cortical gray and white matter in schizophrenia. Arch Gen Psychiatry. 1998;55(4):346–352. doi: 10.1001/archpsyc.55.4.346. [DOI] [PubMed] [Google Scholar]
- Lim KO, Ardekani BA, Nierenberg J, Butler PD, Javitt DC, Hoptman MJ. Voxelwise correlational analyses of white matter integrity in multiple cognitive domains in schizophrenia. Am J Psychiatry. 2006;163(11):2008–2010. doi: 10.1176/appi.ajp.163.11.2008. [DOI] [PMC free article] [PubMed] [Google Scholar]
- Lim KO, Choi SJ, Pomara N, Wolkin A, Rotrosen JP. Reduced frontal white matter integrity in cocaine dependence: A controlled diffusion tensor imaging study. Biol Psychiatry. 2002;51(11):890–895. doi: 10.1016/s0006-3223(01)01355-5. [DOI] [PubMed] [Google Scholar]
- Lyoo IK, Streeter CC, Ahn KH, Lee HK, Pollack MH, Silveri MM, Nassar L, Levin JM, Sarid-Segal O, Ciraulo DA, Renshaw PF, Kaufman MJ. White matter hyperintensities in subjects with cocaine and opiate dependence and healthy comparison subjects. Psychiatry Res. 2004;131(2):135–145. doi: 10.1016/j.pscychresns.2004.04.001. [DOI] [PubMed] [Google Scholar]
- Matochik JA, London ED, Eldreth DA, Cadet JL, Bolla KI. Frontal cortical tissue composition in abstinent cocaine abusers: A magnetic resonance imaging study. Neuroimage. 2003;19(3):1095–1102. doi: 10.1016/s1053-8119(03)00244-1. [DOI] [PubMed] [Google Scholar]
- McLellan AT, Kushner H, Metzger D, Peters R, Smith I, Grissom G, Pettinati H, Argeriou M. The fifth edition of the addiction severity index. J Subst Abuse Treat. 1992;9(3):199–213. doi: 10.1016/0740-5472(92)90062-s. [DOI] [PubMed] [Google Scholar]
- Meyerhoff DJ, Bloomer CJ, Schuff N, Ezekiel F, Norman D, Clark W, Weiner MW, Fein G. Cortical metabolite alterations in abstinent cocaine and cocaine/alcohol-dependent subject: Proton magnetic resonance spectroscopic imaging. Addiction Biology. 1999;4:405–419. doi: 10.1080/13556219971399. [DOI] [PMC free article] [PubMed] [Google Scholar]
- Moeller FG, Hasan KM, Steinberg JL, Kramer LA, Dougherty DM, Santos RM, Valdes I, Swann AC, Barratt ES, Narayana PA. Reduced anterior corpus callosum white matter integrity is related to increased impulsivity and reduced discriminability in cocaine-dependent subjects: Diffusion tensor imaging. Neuropsychopharmacology. 2005;30(3):610–617. doi: 10.1038/sj.npp.1300617. [DOI] [PubMed] [Google Scholar]
- Neiman J, Haapaniemi HM, Hillbom M. Neurological complications of drug abuse: Pathophysiological mechanisms. Eur J Neurol. 2000;7(6):595–606. doi: 10.1046/j.1468-1331.2000.00045.x. [DOI] [PubMed] [Google Scholar]
- O’Neill J, Cardenas VA, Meyerhoff DJ. Separate and interactive effects of cocaine and alcohol dependence on brain structures and metabolites: Quantitative mri and proton mr spectroscopic imaging. Addict Biol. 2001;6(4):347–361. doi: 10.1080/13556210020077073. [DOI] [PubMed] [Google Scholar]
- Pascual-Leone A, Dhuna A, Anderson DC. Cerebral atrophy in habitual cocaine abusers: A planimetric ct study. Neurology. 1991;41(1):34–38. doi: 10.1212/wnl.41.1.34. [DOI] [PubMed] [Google Scholar]
- Patton JH, Stanford MS, Barratt ES. Factor structure of the barratt impulsiveness scale. J Clin Psychol. 1995;51(6):768–774. doi: 10.1002/1097-4679(199511)51:6<768::aid-jclp2270510607>3.0.co;2-1. [DOI] [PubMed] [Google Scholar]
- Pfefferbaum A, Sullivan EV. Microstructural but not macrostructural disruption of white matter in women with chronic alcoholism. Neuroimage. 2002;15(3):708–718. doi: 10.1006/nimg.2001.1018. [DOI] [PubMed] [Google Scholar]
- Pfefferbaum A, Sullivan EV. Disruption of brain white matter microstructure by excessive intracellular and extracellular fluid in alcoholism: Evidence from diffusion tensor imaging. Neuropsychopharmacology. 2005;30(2):423–432. doi: 10.1038/sj.npp.1300623. [DOI] [PubMed] [Google Scholar]
- Smith SM, Jenkinson M, Johansen-Berg H, Rueckert D, Nichols TE, Mackay CE, Watkins KE, Ciccarelli O, Cader MZ, Matthews PM, Behrens TE. Tract-based spatial statistics: Voxelwise analysis of multi-subject diffusion data. Neuroimage. 2006;31(4):1487–1505. doi: 10.1016/j.neuroimage.2006.02.024. [DOI] [PubMed] [Google Scholar]
- Strickland TL, Mena I, Villanueva-Meyer J, Miller BL, Cummings J, Mehringer CM, Satz P, Myers H. Cerebral perfusion and neuropsychological consequences of chronic cocaine use. J Neuropsychiatry Clin Neurosci. 1993;5(4):419–427. doi: 10.1176/jnp.5.4.419. [DOI] [PubMed] [Google Scholar]
- Volkow ND, Hitzemann R, Wang GJ, Fowler JS, Wolf AP, Dewey SL, Handlesman L. Long-term frontal brain metabolic changes in cocaine abusers. Synapse. 1992;11(3):184–190. doi: 10.1002/syn.890110303. [DOI] [PubMed] [Google Scholar]
- Volkow ND, Mullani N, Gould KL, Adler S, Krajewski K. Cerebral blood flow in chronic cocaine users: A study with positron emission tomography. Br J Psychiatry. 1988a;152:641–648. doi: 10.1192/bjp.152.5.641. [DOI] [PubMed] [Google Scholar]
- Volkow ND, Valentine A, Kulkarni M. Radiological and neurological changes in the drug abuse patient: A study with mri. J Neuroradiol. 1988b;15(3):288–293. [PubMed] [Google Scholar]
- Volkow ND, Wang GJ, Ma Y, Fowler JS, Wong C, Ding YS, Hitzemann R, Swanson JM, Kalivas P. Activation of orbital and medial prefrontal cortex by methylphenidate in cocaine-addicted subjects but not in controls: Relevance to addiction. J Neurosci. 2005;25(15):3932–3939. doi: 10.1523/JNEUROSCI.0433-05.2005. [DOI] [PMC free article] [PubMed] [Google Scholar]