

Abstract
Formation of DNA damage is a crucial event in carcinogenesis. Irreparable DNA lesions have the potential to cause mispairing during DNA replication, thereby giving rise to mutations. Critically important mutations in cancer-related genes, i.e., oncogenes and tumor suppressor genes, are key contributors to carcinogenesis. Theoretically, co-localization(s) of persistent DNA lesions and mutational hotspots in cancer-relevant genes can be used for causality inference. The inferred causality can be validated if a suspected carcinogen can similarly produce corresponding patterns of DNA damage and mutagenesis in vitro and/or in vivo. DNA-lesion footprinting (mapping) in conjunction with mutagenicity analysis is used for investigating cancer etiology. Ligation-mediated polymerase chain reaction (LM-PCR) is a versatile DNA-lesion footprinting technique, which enables sensitive and specific detection of DNA damage, at the level of nucleotide resolution, in genomic DNA. Here, we describe an updated protocol for LM-PCR analysis of the mammalian genome. This protocol can routinely be used for DNA-lesion footprinting of a variety of chemical and/or physical carcinogens in mammalian cells.
Keywords: DNA adducts, mutation, PCR amplification, primer extension
1. Introduction
Many genotoxic carcinogens are known to leave unique signatures on cancer-related genes (1). The signature of carcinogens often manifests as the induction of characteristic mutation(s), e.g., base substitutions or frameshifts, at specific nucleotide positions in oncogenes and/or tumor suppressor genes (2–7). The distinctive mutations are commonly preceded by the formation of carcinogen-induced DNA damage at the mutated sites (1, 8). This phenomenon is best exemplified by solar ultraviolet (UV) irradiation linked to TP53 mutations, a highly frequent event in sunlight-associated skin cancers (9). The mutational spectrum of the TP53 gene in sunlight-attributable skin cancers is characterized by single C→T or tandem CC→TT transitions (Fig. 1a) at specific dipyrimidine sequences (Fig. 1b), which correspond to the major hotspots of UV-induced DNA damage found in this tumor suppressor gene (10–12).
Figure 1. (a) Mutation spectrum and (b) codon distribution of the TP53 tumor suppressor gene in human non-melanoma skin tumors (basal cell and squamous cell carcinomas; n = 541).


Data were obtained from the TP53 mutation database of the International Agency for Research on Cancer (R12 version) (31). Ins: Insertions; Del: Deletions.
Today, investigations of human cancer etiology often employ genomic sequencing technologies to correlate the pattern of mutations specific for certain types of human cancer with the experimentally established signature of carcinogens (5, 7, 13, 14). To achieve this objective, DNA-lesion footprinting (mapping) in conjunction with mutation analysis is used to correlate DNA damage and mutagenesis in various endogenous/exogenous reporter genes or cancer-related genes in vitro and/or in vivo (reviewed in (1)). In the following sections, we will discuss ligation-mediated polymerase chain reaction (LM-PCR), a versatile DNA-lesion footprinting technique that enables sensitive and specific detection of DNA damage, at the level of nucleotide resolution (1). We will describe our updated protocol for LM-PCR analysis of the mammalian genome. This protocol can routinely be used for DNA-lesion footprinting of various classes of chemical and/or physical carcinogens in different mammalian cells.
2. Outline of Lm-pcr
LM-PCR is a polymerase-stop based assay, which takes advantage of the fact that DNA polymerase cannot synthesize DNA past certain types of lesions, e.g., DNA single strand breaks (1). Methodologically, therefore, conversion of lesion-bearing DNA to single stranded DNA breaks is a major pre-requisite for LM-PCR analysis (15). This conversion can achieved by chemical, enzymatic and/or physical treatment(s) of DNA prior to assaying with LM-PCR (16). Dependent on the type of these treatments, the single stranded DNA breaks are produced exactly at or in the vicinity of the formed lesions.
The single stranded DNA breaks are initially used as templates in a primer extension reaction using a gene-specific primer (Primer 1), which results in different-lengths molecules with one blunt end. Subsequently, an asymmetric synthetic double-stranded linker (LM-PCR linker) is ligated to the blunt ended molecules, thereby generating a common sequence at all 5′-ends. The ligated fragments are amplified in an exponential PCR reaction using a nested gene-specific primer (Primer 2) together with the longer oligonucleotide of the linker (LP25 linker primer). The PCR-amplified products then undergo a second round of primer extension with a labeled-gene specific primer (Primer 3) (17). The labeled products are resolved by gel electrophoresis and the genomic sequence ladders are visualized by a label-specific detection system, thereafter (18, 19). Visualization of the results provides information on the sequence distribution and frequency of DNA lesions, at nucleotide resolution level (1). A schematic outline of the LM-PCR procedure is illustrated in Figure 2.
Figure 2. A schematic outline of the LM-PCR procedure.

A lesion in the original DNA is indicated by ◆. P1, P2, and P3 indicate gene-specific Primers 1, 2, and 3, respectively.
A unique and challenging aspect of LM-PCR is the ligation of DNA templates to the linker (1). Because the linker is unphosphorylated, it is imperative for the template DNAs to have 5′-phosphate termini (17). This requirement is met during the preparatory step of LM-PCR in which treatment of DNA with special chemicals, enzymes and/or physical agents produces 5′-phosphorylated single stranded DNA breaks (1). For example, the β-δ-elimination step of Maxam and Gilbert chemical reactions (20, 21) generates single stranded DNA breaks with 5′-phosphate termini at each repetition of specific base(s) (see, Fig. 3). Or, hot piperidine treatment of UV-induced pyrimidine (6-4) pyrimidone photoproducts ((6-4)PPs) and their Dewar valence photoisomers yields single stranded DNA breaks with 5′-phosphate groups at the lesion formation sites (22). Another prominent class of UV-induced DNA lesions, the cyclobutane pyrimidine-dimers (CPDs), can be converted to ligatable 5′-ends by successive treatment with T4 endonuclease V (T4 endo V) and E.coli CPD photolyase reactivation (23). The T4 endo V cleaves the glycosidic bond of the 5′-pyrimidine in a CPD and breaks the sugar-phosphate backbone between the two dimerized pyrimidines. The resulting dissociated 3′-pyrimidine retains an overhang dimer, which makes it unligatable until the CPD photolyase reactivation step detaches the dimer. The latter reaction produces a single stranded DNA with a normal base on the 5′-sugar-phosphate terminus (24).
Figure 3. LM-PCR with Maxam and Gilbert chemical reactions.
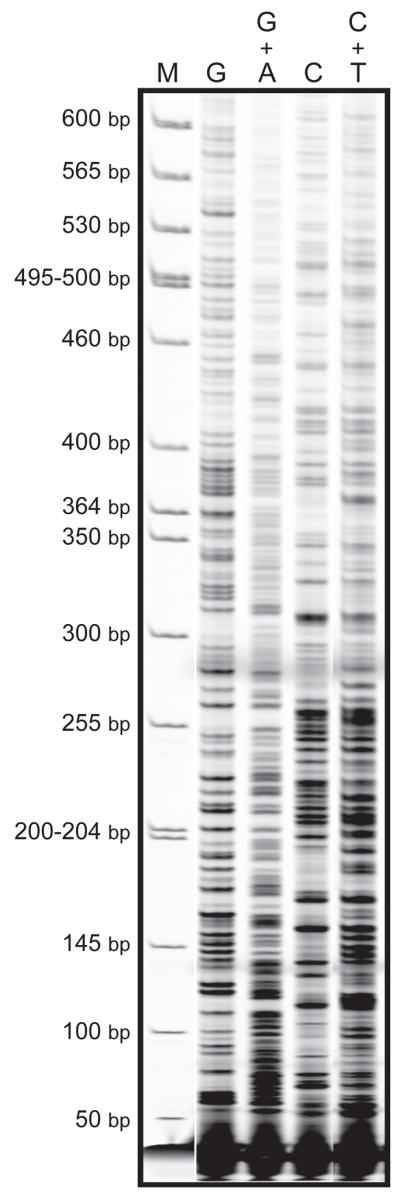
Genomic DNA of Big Blue® mouse embryonic fibroblasts was subjected to standard Maxam and Gilbert chemical reactions (20, 21), and subsequently LM-PCR was performed on the cII transgene. Individual Maxam/Gilbert sequencing ladders include “G”, “G + A”, “C”, and “C + T”. M = Molecular weight standard marker.
Other enzymatic digestions used for LM-PCR analysis, include treatment of DNA with various DNA glycosylases, e.g., formamidopyrimidine DNA glycosylase (Fpg) or Endonuclease III (Nth), which recognize oxidized (ring-open) purines and pyrimidines, respectively (25, 26). Both enzymes generate abasic (AP) sites by releasing damaged bases, and produce single stranded DNA breaks with 5′-phosphate termini by cleaving the sugar-phosphate backbone (AP lyase activity) (27). Another versatile class of enzymes, which is commonly used in LM-PCR, is the E.coli UvrABC endonucleases (28). This enzyme-complex makes a dual incision at specific positions 5′- and 3′- of a variety of lesions, including bulky lesions, e.g., polycyclic aromatic hydrocarbons (PAH) –DNA adducts, intrastrand DNA cross-links, etc (1). For instance, the UvrABC complex creates two separate incisions at seven bases 5′- and four/five bases 3′- to benzo[a]pyrene diol epoxide-guanine adducts, a major tobacco smoke PAH-derived DNA adduct (2).
3. Primer Design for Lm-pcr
As a step-wise PCR-based assay, LM-PCR is heavily dependent on the performance of gene-specific primers that are sequentially used for (1) primer extension of the single stranded DNA breaks created by various cleavage reactions, (2) signal amplification by PCR reaction of the linker-ligated primer-extended fragments, and (3) direct labeling of the PCR-amplified products. A set of three nested primers is typically used for LM-PCR analysis of most mammalian genes. Ideally, the three primers should partially overlap one another by a few to several bases. Nonetheless, they may also work adequately well if they are in close proximity of each other.
A number of computer programs is available to help design LM-PCR primers for a gene/sequence of interest, e.g., OLIGO software (National BioSciences Inc., Plymouth, MN). The three gene-specific LM-PCR primers should preferably be designed to have calculated melting temperatures (Tm) ranging from 48°C to 68°C (in an ascending order). Of the set of LM-PCR primers, the first one (Primer 1) is a 15–22 –mer oligonucleotide with a calculated Tm of 48°C – 56°C, which is used in the primer extension reaction. The second primer (Primer 2) is a 20–28 –mer oligonucleotide with a calculated Tm of 60–68°C. Because Primer 2 together with LP25 linker primer participates in the PCR amplification reaction of the linker-ligated primer-extended fragments, it should have a Tm close to that of the LP25 linker primer (i.e., 66°C as calculated by the OLIGO 4.0 software), without having any homology with it. The third primer (Primer 3) is a 20–28 –mer oligonucleotide with a calculated Tm of 65–68°C, which is used for labeling of the PCR-amplified products. Depending on the target sequence, the lengths of LM-PCR primers and the extent of their overlaps (if any) may vary up to several bases. For example, AT-rich regions may require longer primers with certain degrees of overlap to provide the desired annealing temperature(s) for extension and/or amplification steps of the LM-PCR procedure.
Ideally, in a set of gene-specific LM-PCR primers, Primer 3 is designed to extend 75–100 bases away from a sequence position of interest to ensure an effective resolution of the labeled products on sequencing electrophoresis gel. Primer 2 is designed to be 5′- of the Primer 3 and overlap with it by 3–8 bases (further away from the target sequence). Primer 1 is designed to extend from the 5′- side of the Primer 2 whilst having a 2–6 bases overlap with this primer (furthest away from the target sequence). In the sequential LM-PCR procedure, the nested nature of gene-specific primers together with their respectively ascending Tm serves as a measure of specificity, which provides competition with any residual primer that might be carried with samples to the next step. Generally, sequences with long runs of purines or pyrimidines, sequences with obvious secondary structures, and repetitive DNA sequences that make up a large fraction of the mammalian genome (29, 30) should be avoided in the design of LM-PCR primers. Other primer-design considerations include: (I) primers should have a GC content of approximately 40–50%, (II) primers should preferably have a G or C at the 3′- end, (III) primers should not have single base repeats greater than 3 bases, e.g., GGGG or TTTT, and (IV) primers should not have more than one annealing site in the target sequence of interest. The optimal annealing temperature for each gene-specific LM-PCR primer can be determined using an additional set of PCR primers, designed for opposite strand of the target sequence (i.e., upstream/downstream), in a temperature-gradient PCR reaction. The forward and reverse primers of the corresponding sets can be examined by PCR-amplification of the genomic sequence of interest using a gradient-capable thermal cycler, e.g., DNA Engine Peltier Thermal Cycler PTC-0200 DNA Engine Cycler (Bio-Rad Laboratories, Inc., Hercules, CA). All LM-PCR primers should be of high quality with appropriate purification, thus meeting all quality control standards.
4. Primer Extension Step
Approximately 0.5–1.0 μg DNA digest produced by special cleavage reaction(s) is used together with a 5′-biotinylated gene-specific Primer 1 and a DNA polymerase of choice in a standardized primer extension reaction as follows: (I) denaturation at 95°C for 3 minutes, (II) annealing at or up to 5°C greater than Tm of Primer 1 for 5 minutes (III) extension (elongation) at 72°C for 10 minutes. The choice of DNA polymerase should be determined experimentally for each target sequence. The commonly used DNA polymerases include: Vent (exo−) DNA polymerase (New England Biolabs, Beverly, MA), Pfu DNA polymerase (Promega, Madison, WI), Pfu Turbo® DNA Polymerase (Stratagene, La Jolla, CA), and Sequenase (USB, now part of Affymetrix, Inc., Cleveland, OH). Following the primer extension reaction, the 5′-biotinylated extended fragments are immobilized to streptavidin-coupled magnetic beads (Dynal Biotech ASA, Oslo, Norway), and the bead-bound extension products are washed thoroughly with a buffer solution (i.e., 1× TE (1 mM EDTA, 10 mM Tris-HCl pH 7.5), thereafter. This purification procedure removes all the non-specific DNA templates, which may otherwise interfere with subsequent priming and amplification reactions.
5. Linker Ligation Step
The purified bead-bound primer-extended fragments are ligated to the asymmetric double-stranded LM-PCR linker in a reaction mixture of T4 DNA ligase (Promega) at 17°C overnight. For re-purification, the linker-ligated primer-extended products are washed thoroughly with a buffer solution (i.e., 1× TE pH 7.5) afterward. The LM-PCR linker is prepared in 250 mM Tris-HCl, pH 7.7, by annealing a 25-mer oligonucleotide (5′ –GCGGTGACCCGGGAGATCTGAATTC) to an 11-mer (5′ –GAATTCAGATC) (final concentration of both oligonucleotides: 20 pmol/μl). This mixture is heated to 95°C for 3 minutes, and subsequently cooled down to 4°C over a time period of at least 4 hours. The LM-PCR linker is aliquoted to working quantities and stored in non-defrost −20°C freezers.
6. PCR Amplification Step
The purified ligation products are exponentially amplified in a PCR reaction using a nested gene-specific Primer 2 and the LP25 linker primer and a DNA polymerase of choice. The annealing step of the PCR reaction is performed at or 1°C below the Tm of the gene-specific Primer 2 for 18–20 cycles. The choice of DNA polymerase for PCR amplification reaction should be established experimentally for each target sequence. Thermostable DNA polymerases, such as AmpliTaq® DNA polymerase (Applied Biosystems, Foster City, CA) and Expand Long Template PCR System; Thermostable DNA polymerase mixture (Roche Applied Science, Indianapolis, IN) are commonly used in the PCR amplification step of the LM-PCR procedure. Staying within the range of 18–20 cycles of PCR is important as it ensures a linear and quantitative amplification of the signals, i.e., linker-ligated primer-extended fragments. The specified number of PCR cycles also minimizes the preferential amplification of short fragments during the PCR reaction.
For purification, the PCR-amplified products can be separated from the bead-bound linker-ligated fragments using a Magnetic Particle Concentrator (Dynal, Lake Success, NY). The purified-PCR products can be preserved at 4°C for varying period of times dependant on the type of DNA polymerase used for the PCR reaction. Most thermostable DNA polymerases used in LM-PCR are still active after 20 cycles of PCR, and remain so if kept at 4°C (for at least several weeks).
8. Gel electrophoresis and Visualization Steps
The purified PCR amplification products are directly labeled using a fluorescence (near) infrared dye-labeled gene–specific Primer 3 (i.e., custom-made IRDye® 700/800 primers; LI-COR, Lincoln, NE). A standardized LM-PCR labeling reaction consists of (I) denaturation at 95°C for 2 minutes, (II) 1–6 cycles of: denaturation at 95°C for 45 seconds, annealing at or up to 5°C greater than Tm of Primer 3 for 2 minutes, and extension at 72°C for 3 minutes, and (III) a final round of extension at 72°C for 7 minutes. The optimal number of cycles in the labeling step should be determined experimentally for each target sequence (more cycles often lead to increased noise to signal ratios, i.e., high background and non-specific bands).
If the Tm of Primer 3 is lower than that of Primer 2, it is prudent for the PCR-amplified products to be purified prior to labeling reaction. The purification step should eliminate the carried over primers (leftover from the preceding steps) that could compete with Primer 3 during the labeling step. The removal of undesired primers is routinely achieved by an Escherichia coli Exonuclease I (Amersham, Arlington Heights, IL) treatment of the PCR-amplified products prior to the labeling step. Following the labeling reaction, the IRDye® 700/800 fluorescence-labeled fragments are run on a polyacrylamide–urea gel electrophoresis system, which is part of a computerized Long Read IR 4200 DNA Sequencing system (LI-COR). The system is equipped with a real time IRDye® 700/800-laser (dual) detector and data acquisition software, which enables a simultaneous scanning of the sequencing gel for fluorescence-labeled fragments throughout electrophoresis run.
Note: Alternatively, if a LI-COR system is not available, radioactively labeled primers or probes can be used for visualization (17).
9. Quantification of Sequencing Data
The LI-COR based LM-PCR method utilizes fluorescence technology to detect DNA fragments, which have incorporated an infrared dye-labeled Primer 3 during the labeling reaction of LM-PCR procedure. The labeled fragments separate differently according to their size in sequencing gel electrophoresis. A solid-state laser diode excites the infrared dye on the labeled DNA fragments as they migrate past the detector window. Simultaneously, a focusing fluorescence microscope containing a solid-state silicon avalanche photodiode scans back and forth across the width of sequencing gel, while collecting the data in real time. The raw data are processed and analyzed as the electrophoresis run progresses. The output image data are presented as a TIFF file, and can be retrieved throughout the gel electrophoresis run. Quantification of the sequencing data can be achieved by specialized image analysis softwares, e.g., Gene ImagIR (Scanalytics Inc., Rockville, MD).
The LI-COR System is highly advantageous over the old-fashioned LM-PCR labeling methods that required gel transfer, electroblotting, 32P-γ ATP probe synthesis and hybridization, and autoradiography (17). Comparatively, the LI-COR based LM-PCR method eliminates the risk of exposure to radioactive materials and reduces the amount of time needed for each assay-run. This method offers reproducible and high resolution sequencing data of long reads. The extremely high absorptivity and optimal quantum efficiency of both IRDye® 700/800 dyes provide an excellent sensitivity of 10 attomoles of the labeled products in each genomic ladder of the sequencing gel. The method can easily produce sequencing data of high quality for at least 300 nucleotides, which are equally spaced in each sequencing ladder.
It is highly recommended that Maxam and Gilbert chemical reactions be prepared from the genomic sequence of interest, and run in parallel to all samples throughout runs (20, 21). This strategy can help locate the exact position of each base in a sequence ladder of the gel electrophoresis run (see, Fig. 3). Also, it is helpful to include the IRDye® 700/800 Sizing Standards (LI-COR), which are composed of labeled DNA fragments with different lengths, throughout all runs (see, Fig. 3).
Note: The IRDye® 700/800 fluorescence primers and Sizing Standards are light sensitive and should be handled under dimmed or yellow light.
10. Concluding Remarks on Genomic DNA Preparation for Lm-pcr
The quantity and quality of genomic DNA can determine the outcome of LM-PCR analysis. Care should be taken to minimize the adventitious damage to DNA, e.g., oxidation of DNA bases, which commonly occurs during conventional DNA isolation procedures, or depurination of DNA, which is favored at low pH and increasing temperatures. The isolated DNA should be dissolved in slightly basic solution, e.g., TE buffer pH 7.5, adjusted to a concentration of ~1.0 μg/μl, aliquoted to working quantities, and preserved at preferably −80°C. Subjecting the genomic DNA to repeated freeze-thaw cycles and spontaneous depurination, a frequent occurrence when the DNA is dissolved in water and stored at 4°C for prolonged periods of time, should be avoided at all times. The DNA digest prepared by various cleavage reactions prior to LM-PCR, should be dissolved in nuclease-free water (Ambion Inc., Austin, TX) and aliquoted to working quantities, however. To minimize depurination, any DNA digestion procedure, for example with repair enzymes or nucleases, should be carried out for the shortest possible time periods, i.e., 30 to 60 min. The presence of any unwarranted solvent/reagent in DNA digest may inhibit or adversely affect the efficiency of primer extension reaction of the LM-PCR procedure.
The concentration of all DNA digests should be determined both spectrophotometrically and by gel electrophoresis. An accurate spectrophotometric measurement of DNA can only be made in samples that meet the absorption requirements of A230/A260: 0.4 and A260/A280: 1.8. The lower and higher A260/A280 ratios, respectively, are indicative of protein and RNA contaminations, whereas suboptimal A230/260 ratios indicate salt contamination of the genomic DNA. All control non-treated genomic DNA samples should be reasonably devoid of background strand breaks (to be verified by alkaline/agarose gel electrophoresis).
Acknowledgments
We would like to thank our colleagues Prof. Dr. Arthur D. Riggs and Dr. Hsiu-Hua Chen for helpful discussions. Work of the authors is supported by NIH grants ES06070 and CA84469.
Footnotes
Publisher's Disclaimer: This is a PDF file of an unedited manuscript that has been accepted for publication. As a service to our customers we are providing this early version of the manuscript. The manuscript will undergo copyediting, typesetting, and review of the resulting proof before it is published in its final citable form. Please note that during the production process errors may be discovered which could affect the content, and all legal disclaimers that apply to the journal pertain.
References
- 1.Besaratinia A, Pfeifer GP. Carcinogenesis. 2006;27:1526–37. doi: 10.1093/carcin/bgi311. [DOI] [PubMed] [Google Scholar]
- 2.Denissenko MF, Pao A, Tang M, Pfeifer GP. Science. 1996;274:430–32. doi: 10.1126/science.274.5286.430. [DOI] [PubMed] [Google Scholar]
- 3.Becker MM, Wang Z, Grossmann G, Becherer KA. Proc Natl Acad Sci U S A. 1989;86:5315–19. doi: 10.1073/pnas.86.14.5315. [DOI] [PMC free article] [PubMed] [Google Scholar]
- 4.Chen JX, Zheng Y, West M, Tang MS. Cancer Res. 1998;58:2070–75. [PubMed] [Google Scholar]
- 5.DeMarini DM, Landi S, Tian D, Hanley NM, Li X, Hu F, Roop BC, Mass MJ, Keohavong P, Gao W, Olivier M, Hainaut P, Mumford JL. Cancer Res. 2001;61:6679–81. [PubMed] [Google Scholar]
- 6.Feng Z, Hu W, Chen JX, Pao A, Li H, Rom W, Hung MC, Tang MS. J Natl Cancer Inst. 2002;94:1527–36. doi: 10.1093/jnci/94.20.1527. [DOI] [PubMed] [Google Scholar]
- 7.Olivier M, Hussain SP, Caron de Fromentel C, Hainaut P, Harris CC. IARC Sci Publ. 2004:247–70. [PubMed] [Google Scholar]
- 8.Besaratinia A, Pfeifer GP. Lancet Oncol. 2008;9:657–66. doi: 10.1016/S1470-2045(08)70172-4. [DOI] [PMC free article] [PubMed] [Google Scholar]
- 9.Pfeifer GP, You YH, Besaratinia A. Mutat Res. 2005;571:19–31. doi: 10.1016/j.mrfmmm.2004.06.057. [DOI] [PubMed] [Google Scholar]
- 10.Drobetsky EA, Moustacchi E, Glickman BW, Sage E. Carcinogenesis. 1994;15:1577–83. doi: 10.1093/carcin/15.8.1577. [DOI] [PubMed] [Google Scholar]
- 11.Sage E, Lamolet B, Brulay E, Moustacchi E, Chateauneuf A, Drobetsky EA. Proc Natl Acad Sci U S A. 1996;93:176–80. doi: 10.1073/pnas.93.1.176. [DOI] [PMC free article] [PubMed] [Google Scholar]
- 12.Tommasi S, Denissenko MF, Pfeifer GP. Cancer Res. 1997;57:4727–30. [PubMed] [Google Scholar]
- 13.Hussain SP, Harris CC. Cancer Res. 1998;58:4023–37. [PubMed] [Google Scholar]
- 14.Pfeifer GP, Tang M, Denissenko MF. Curr Top Microbiol Immunol. 2000;249:1–19. doi: 10.1007/978-3-642-59696-4_1. [DOI] [PubMed] [Google Scholar]
- 15.Pfeifer GP, Steigerwald SD, Mueller PR, Wold B, Riggs AD. Science. 1989;246:810–13. doi: 10.1126/science.2814502. [DOI] [PubMed] [Google Scholar]
- 16.Hershkovitz M, Riggs AD. Methods. 1997;11:253–63. doi: 10.1006/meth.1996.0412. [DOI] [PubMed] [Google Scholar]
- 17.Pfeifer GP, Chen HH, Komura J, Riggs AD. Methods Enzymol. 1999;304:548–71. doi: 10.1016/s0076-6879(99)04032-x. [DOI] [PubMed] [Google Scholar]
- 18.Dai SM, Chen HH, Chang C, Riggs AD, Flanagan SD. Nat Biotechnol. 2000;18:1108–11. doi: 10.1038/80323. [DOI] [PubMed] [Google Scholar]
- 19.Dai SM, O’Connor TR, Holmquist GP, Riggs AD, Flanagan SD. Biotechniques. 2002;33:1090–97. doi: 10.2144/02335rr04. [DOI] [PubMed] [Google Scholar]
- 20.Maxam AM, Gilbert W. Proc Natl Acad Sci U S A. 1977;74:560–64. doi: 10.1073/pnas.74.2.560. [DOI] [PMC free article] [PubMed] [Google Scholar]
- 21.Maxam AM, Gilbert W. Methods Enzymol. 1980;65:499–560. doi: 10.1016/s0076-6879(80)65059-9. [DOI] [PubMed] [Google Scholar]
- 22.Pfeifer GP, Drouin R, Riggs AD, Holmquist GP. Proc Natl Acad Sci U S A. 1991;88:1374–78. doi: 10.1073/pnas.88.4.1374. [DOI] [PMC free article] [PubMed] [Google Scholar]
- 23.Besaratinia A, Kim SI, Pfeifer GP. Faseb J. 2008;22:2379–92. doi: 10.1096/fj.07-105437. [DOI] [PMC free article] [PubMed] [Google Scholar]
- 24.Pfeifer GP, Drouin R, Riggs AD, Holmquist GP. Mol Cell Biol. 1992;12:1798–804. doi: 10.1128/mcb.12.4.1798. [DOI] [PMC free article] [PubMed] [Google Scholar]
- 25.O’Connor TR, Laval J. Proc Natl Acad Sci U S A. 1989;86:5222–26. doi: 10.1073/pnas.86.14.5222. [DOI] [PMC free article] [PubMed] [Google Scholar]
- 26.Yoon JH, Iwai S, O’Connor TR, Pfeifer GP. Nucleic Acids Res. 2003;31:5399–404. doi: 10.1093/nar/gkg730. [DOI] [PMC free article] [PubMed] [Google Scholar]
- 27.Ide H. Prog Nucleic Acid Res Mol Biol. 2001;68:207–21. doi: 10.1016/s0079-6603(01)68101-7. [DOI] [PubMed] [Google Scholar]
- 28.Selby CP, Sancar A. Mutat Res. 1990;236:203–11. doi: 10.1016/0921-8777(90)90005-p. [DOI] [PubMed] [Google Scholar]
- 29.Smit AF, Riggs AD. Nucleic Acids Res. 1995;23:98–102. doi: 10.1093/nar/23.1.98. [DOI] [PMC free article] [PubMed] [Google Scholar]
- 30.Smit AF, Toth G, Riggs AD, Jurka J. J Mol Biol. 1995;246:401–17. doi: 10.1006/jmbi.1994.0095. [DOI] [PubMed] [Google Scholar]
- 31.Olivier M, Eeles R, Hollstein M, Khan MA, Harris CC, Hainaut P. Hum Mutat. 2002;19:607–14. doi: 10.1002/humu.10081. [DOI] [PubMed] [Google Scholar]