
Figure 6. Connectivity analysis.
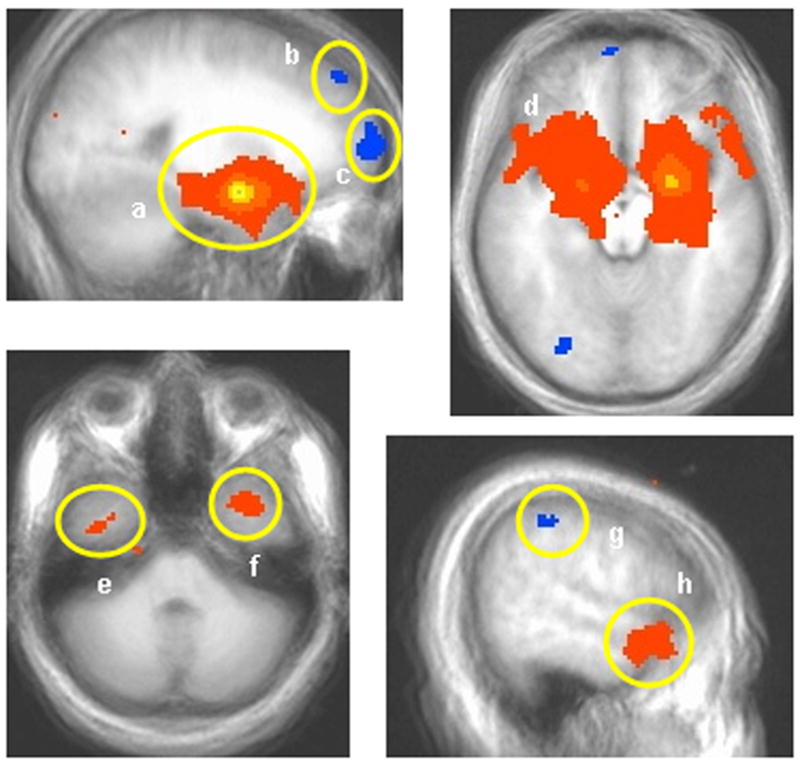
Results of the connectivity analysis with the voxel of peak intensity in right amygdala (p < 0.005) as the seed (a). Regions showing positive connectivity with the seed voxel include the extended amygdala (a and d), and anterior temporal cortex (e, f, and h). Regions showing negative correlation with right amygdala include the lateral superior frontal gyrus (b), middle frontal/orbital gyrus (c), and parietal cortex (g).