Summary
We study fully hydrated bilayers of two di-monounsaturated phospholipids diC18:1PC (DOPC) and diC22:1PC with varying amounts of alamethicin (Alm). We combine the use of X-ray diffuse scattering and molecular dynamics simulations to determine the orientation of alamethicin in model lipids. Comparison of the experimental and simulated form factors shows that Alm helices are inserted transmembrane at high humidity and high concentrations, in agreement with earlier results. The x-ray scattering data and the MD simulations agree that membrane thickness changes very little up to 1/10 Alm/DOPC. In contrast, the x-ray data indicate that the thicker diC22:1PC membrane, thins with added Alm, a total decrease in thickness of 4 Å at 1/10 Alm/diC22:1PC. The different effect of Alm on the thickness changes of the two bilayers is consistent with Alm having a hydrophobic thickness close to the hydrophobic thickness of 27 Å for DOPC; Alm is then mismatched with the 7 Å thicker diC22:1PC bilayer. The x-ray data indicate that Alm decreases the bending modulus (KC) by a factor of ~2 in DOPC and a factor of ~10 in diC22:1PC membranes(P/L ~1/10). The van der Waals and fluctuational interactions between bilayers are also evaluated through determination of the anisotropic B compressibility modulus.
Keywords: Lipid bilayers, peptides, x-ray, structure, MD simulation, alamethicin
1. Introduction
The incorporation of proteins and peptides into the lipid bilayer matrix of biomembranes is a significant aspect of structural biology. One approach to obtain structural and functional information about larger membrane proteins is to study component peptides as model systems. A much-studied model system of a membrane peptide is alamethicin (Alm), the 20-amino acid peptide produced by the fungus Trichoderma viride. Alm increases membrane permeability leading to cell lysis and it has been shown to interact directly with microbial cell membranes rather than with specific membrane proteins [1].
Investigations of the association of Alm with lipid bilayers have yielded varying results regarding its conformation and channel-forming ability (for reviews see: [1–5]. While the peptide binds strongly to lipid bilayers [6] its orientation in the membrane varies as a function of hydration, lipid type, temperature and concentration. Using oriented CD and x-ray diffraction, He et al. [7] reported that Alm associates with lipid membranes in two states: (1) as a helix parallel to the membrane surface at lower concentrations and lower hydration levels, and (2) as an inserted, transmembrane helix at higher concentrations and higher hydration levels. A neutron diffraction study found that Alm at high concentration, but less than full hydration, forms a transmembrane pore [8] as in the barrel-stave model of peptide incorporation into bilayers [9]. A more recent scattering experiment [10] using the level of hydration of He et al. [8] found a wide distribution of orientation angle with respect to the bilayer normal and only a partial insertion of Alm into a DMPC bilayer. One possible concern with previous diffraction studies is that the samples were multilamellar with very small water spaces between the bilayers. The value of studying these systems at full hydration is that there is ample water space between the bilayers to compete for the partitioning of the peptide. It has also been suggested that pore or channel formation might not occur without a transmembrane voltage [11] to align helices and form a barrel-stave pore [12].
How the lipid bilayer is affected by the incorporation of peptides is also of considerable interest [13–15]. To address either goal of determining how the peptide is incorporated into membranes or how the lipid bilayers are perturbed by peptides, it is useful to have structural information about lipid bilayers in their most biologically relevant, fully hydrated, fluid (so called liquid-crystalline, Lα) state. Even this more modest task has not been easy because the fluidity of fluid phase lipids precludes an atomic level structure. Thermal fluctuations in the water spacing between spontaneously bending membranes degrade the usual Bragg diffraction peaks, whose intensities are the primary data used in traditional liquid crystallographic analysis, into diffuse x-ray scattering. Perhaps surprisingly, there is more information in the diffuse scattering than in the traditional Bragg orders and our lab has shown how to extract it to determine the structure of single component lipid bilayers [16–18]. Here we apply this method to model membranes consisting of peptides added to lipid bilayers that are fully hydrated and therefore have ample aqueous space to compete for the peptide. The x-ray scattering experiments herein are carried out in bilayers of either DOPC or diC22:1PC containing varying concentrations of Alm.
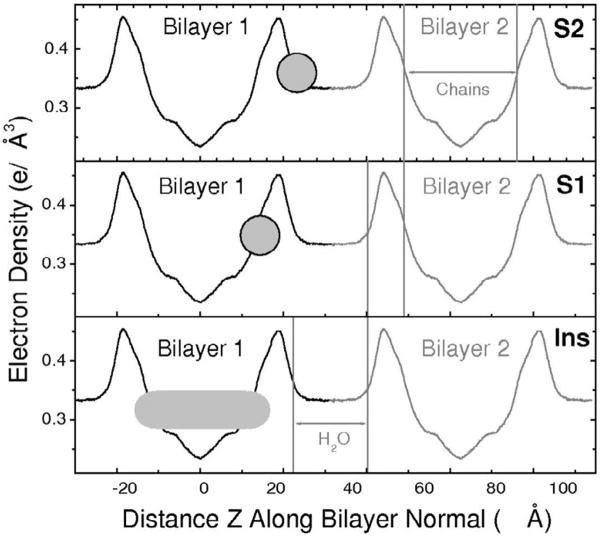
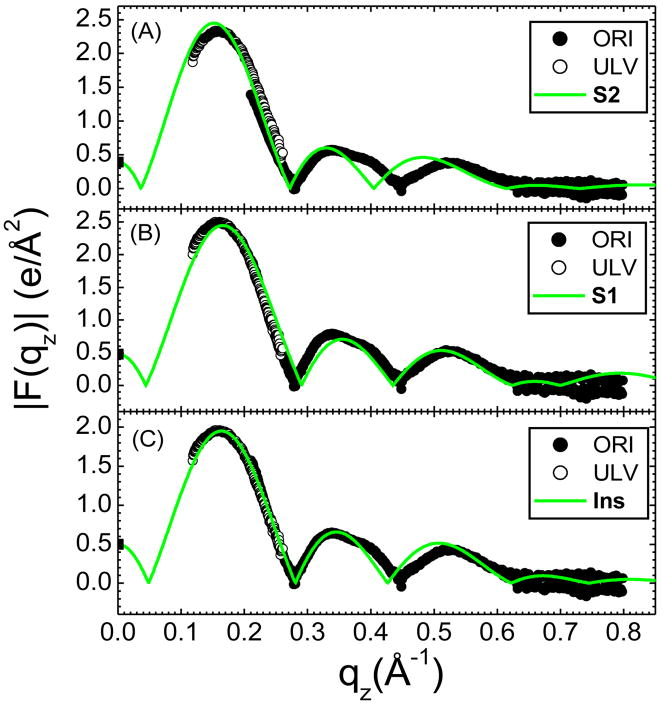
Our preliminary analysis of the low angle x-ray scattering (LAXS) data suggested three distinct ways that Alm could be incorporated into bilayers [19]. In the inserted model Ins the long axis of the Alm helix is primarily perpendicular to the membrane surface, along the z axis; in surface models S1 and S2, the long axis of the Alm peptide is primarily parallel to the membrane surface as shown in Fig. 1. In S2 Alm is positioned outside of the lipid headgroup peak and is therefore partially solvated by interbilayer water. Many experimental studies with relative humidity of 98% or less would not have enough water to even allow this state to exist. In S1 Alm is positioned closer to the center of the bilayer, near the carbonyl-glycerol groups, and therefore interacts less with the solvent than in S2. Fitting simple models of a surface state to the x-ray data obtained two minima in χ2 as a function of location of Alm along the z axis and that led to the distinction between the two, S1 and S2, surface models. However, the χ2 values for the three models were sufficiently close that there was uncertainty which model fits best. To resolve this ambiguity, we have carried out MD simulations. Simulations also are subject to ambiguity because initial Alm placement in the bilayer does not change much during the time available for the simulation. In addition, if two states have a modest free energy difference the accuracy of the force fields used in MD may not be sufficient to identify these differences with confidence. However, in this paper we compare our experimental x-ray data, with no intervening modeling, to the form factors obtained from three MD simulations that started with the S1, S2 or Ins states, and a clear best fit emerges for the Ins case. We suggest that this combination of methods may be useful for studying other peptide/lipid systems.
Figure 1.
2. Materials and Methods
2.1 Materials
DOPC (1,2-dioleoyl-sn-glycero-phosphatidylcholine) (di18:1PC) and dierucoylPC (di22:1PC) were purchased form Avanti Polar Lipids (Alabaster, AL). Alamethicin (Alm) was purchased from Sigma-Aldrich (Milwaukee, WI). This is a natural, purified 20 amino-acid peptide from Trichoderma viride consisting of 85% Alm I (acetyl-Aib-Pro-Aib-Ala-Aib-Ala-Gln-Aib-Val-Aib-Gly-Leu-Aib-Pro-Val-Aib-Aib-Glu-Gln-PhenOl) and 15% Alm II. These differ in the amino acid at the 6th position: alanine in Alm I and aminoisobutyric acid (Aib) in Alm II.
2.2 Preparation of Oriented Samples
Alm was co-dissolved with DOPC or diC22:1PC in either 2:1 or 1:1 volume ratios of chloroform:trifluoroethanol (TFE) at Alm/lipid mole ratios between 1/180 and 1/10. 4 mg of dry lipid was added to the chlor:TFE solvent mixture and to this was added the appropriate amount of Alm from a chloroform stock solution of 1 mg/ml. This mixture was plated onto silicon wafers (1.5cm × 3cm × 1 mm) using the rock and roll procedure [20,21]. The samples were allowed to dry for one day in a glove box with solvent-rich atmosphere and an additional day in a fume hood. They were then trimmed to a strip 0.5 cm wide in the center of the silicon wafer and stored at 2 °C in a dessicator prior to x-ray measurements. The goodness of the orientation of these samples was determined using an x-ray rocking scan which gave mosaic spread from 0.05 to 0.2 ° for different samples, with no discernible trend with Alm concentration.
2.3 Hydration of Oriented Samples
Dried, oriented samples were placed into a hydration chamber that permits full hydration through the vapor [22]. Variable hydration levels (D spacings) were obtained by adjusting a Peltier element under the samples. Samples usually achieved full hydration in less than one hour and they were then allowed to equilibrate for an additional hour. Comparison with the repeat D spacings obtained from multilamellar vesicles immersed in water showed that full or nearly full hydration was achieved in the oriented samples.
2.4 Preparation of Unoriented Samples (MLVs and ULVs)
10 mg lyophilized lipid or Alm/lipid was mixed with 500 μl water (Barnstead nanopure) and cycled between 50 °C and −20 °C with vortexing at each temperature to produce multilamellar vesicles (MLVs). Extruded unilamellar vesicles (ULV) were prepared from MLVs using the Avanti mini-extruder with 500 Å pore size as described previously [22].
2.5 X-Ray Data Collection
Oriented X-ray data were taken on three separate trips to the D-1 station of the Cornell High Energy Synchrotron Source (CHESS) with similar, but not identical setups. Wavelength ~1.18 Å was selected using multilayer monochromators (Δλ/λ ~ 0.01). The beam for oriented samples was 0.28 mm in the horizontal direction and 1.2 mm in the vertical direction to ensure that the same amount of sample was in the footprint of the beam as the plane of the bilayers was rotated from −3° to 7° about a horizontal axis relative to the beam. The beam for ULV samples was 0.28 × 0.28 mm square. For both oriented stacks and ULV samples, total exposure time on a sample spot was limited to 4 minutes, during which time the scattering remained constant, indicating negligible radiation damage. Two dimensional scattering intensities were collected with a Medoptics charge-coupled device (CCD) with a 1024 × 1024 pixel array, 47.19 μm per pixel. The CCD-to-sample distance S was ~250mm for oriented samples and ~350mm for ULV samples, calibrated to four significant figures for each run using an oriented silver behenate standard. 2D X-ray data from isotropic MLV samples in capillaries were obtained using a Rigaku RUH3R rotating copper anode with wavelength = 1.5418 Å which was collimated with a Xenocs FOX2D multilayer optic. The data were collected with a Rigaku Mercury CCD, 1024 × 1024, 68 μm per pixel, with S = 303 mm. Radial averages of two or three Bragg rings yielded an average D-spacing for these fully hydrated samples in excess water.
2.6 Analysis of LAXS diffuse data
The analysis of diffuse data has been described previously [16–18,22] and will be reviewed here only briefly. The scattering intensity for a stack of oriented bilayers corrected for differential absorption at different scattering angles [20] is the product: I(q) = S(q)|F(qz) |2k/qz, where the momentum transfer is q = (qr,qz), S(q) is the structure interference factor, F(qz) is the bilayer form factor, k is a factor that depends on the amount of sample in the beam and other instrumental settings, and qz−1 is the usual low angle approximation to the Lorentz factor for narrow oriented samples and a tall beam for which the same amount of sample remains in the beam for all relevant q. The first step of the analysis obtains the bilayer bending modulus (KC), the compression modulus (B), and |F(qz)|2k/qz. While scattering from oriented samples gives crucial data for high qz, it does not give good results for low qz. We therefore use unilamellar vesicles (ULV) [22], for which the results are accurate at low qz. Relative values of |F(qz)| are obtained from the background subtracted intensities I(q) of isotropic ULV samples using I(q)=|F(qz)|2k/q2z. Electron density models are fit to the results for |F(qz)|2k from both measurements. The models are based on the HB model [22] or the H2 model [23]. Both models were enhanced by adding terms for Alm, either a Gaussian for surface models, or an error function for the inserted model. The number of electrons was constrained and the length of the peptide for the inserted model was found to be 29 Å by fitting to the 1/20 Alm/DOPC data and this length was then fixed for all other concentrations. The number of model parameters becomes too large for definitive determination of all of them, but the main result reported in this paper, namely, the head-head distance DHH, often called the peak-to-peak distance between the maxima in the electron density profile, is robustly determined even when the full parameter set is not. This is consistent with conventional practice that reports DHH from Fourier reconstruction of the electron density profile from the intensities of diffraction peaks that constitute the total LAXS information from drier samples. We also estimate the hydrophobic thickness as 2DC = DHH − 9.9 Å [18,22,24].
2.7 F(qz) Simulations
For the starting structure, DOPC lipids were placed on a widely spaced 8×8 regular grid, with random rotation around the z-axis and random translation between −0.5 and +0.5 nm along the z-axis for each lipid. This grid, essentially a monolayer, was copied, rotated 180 degrees, and translated along the z-axis to obtain a bilayer with 128 DOPC lipids. For the pure DOPC simulation, the lipids were compressed to the expected final area per lipid by scaling the coordinates, and the resulting (deformed) lipid bilayer was energy minimized. Water (nW=20.4 molecules per lipid) was added from a pre-equilibrated water box and subsequently removed from the interior 2.5 nm of the bilayer, where water is placed unrealistically by the geometric criteria used. The pure DOPC simulations were run for a total of 75 ns, which is sufficient to obtain accurate average structural properties. After 30 ns we added more water to increase the water/lipid ratio from 20.4:1 to 40:1 to be consistent with the procedure used for the Alm simulations, and continued to simulate both systems with the different water amounts. The added water had no effect on the electron density profiles of the DOPC bilayer. We analyzed three simulations with the 40:1 water to lipid ratio. In the first, the area was allowed to fluctuate with zero surface tension. In the second, the area was fixed at the experimental area of 72 Å2. From this simulation, the resulting surface tension was calculated. In the third simulation, this surface tension was applied, resulting in the same average area of 72 Å2 as in simulation 2.
To create the Alm systems, Alm was added to the outside of the bilayer or inserted into the 128 DOPC bilayer. Six water molecules were randomly replaced by sodium ions to give a net charge of zero in each system. We carried out a large number of simulations of these systems, with different surface tensions, different amounts of water (20.4 waters/lipid and 40 waters/lipid), with or without helical restraints on the peptides, and with different restraining potentials to place the peptides at an average depth in the membrane. However, the goal of these simulations was to create electron density profiles, including those of the different molecular components, to use in fitting diffraction data to the Ins, S1, and S2 models. Based on the pure DOPC results (described below), we effectively use only three Alm simulations in this paper.
To create S2, Alm peptides were placed just outside the lipid head groups, with their long axes in the x-y plane of the membrane. Overlapping water molecules were deleted, and the peptides were restrained harmonically with their centers of mass at Z = 2.1 nm and Z = −2.1 nm, where Z = 0 nm corresponds to the center of the membrane. To create S1, Alm on the surface was pulled deeper into the lipid bilayer in a 500 ps simulation by applying a weak harmonic potential with a force constant of 56 kJ mol−1 nm−2 centered at Z = −1.35 nm or Z = 1.35 nm to the peptides. Both S1 and S2 were initially equilibrated for 100 ns with a 20.4 water/lipid ratio. We added more water at 100 ns to make the water/lipid ratio 40 and simulated for an additional 30 ns. At that point, we added NOE-like helical restraints to make the Alm peptides more helical and simulated for an additional 50 ns. Analyses were done on the last 30 ns of these 50 ns runs. To create Ins, the method of Kandt et al. [25] was used based on the same equilibrated DOPC structure as used in S1 and S2. We assumed that each orientation (N-terminal vs. C-terminal) was equally likely and placed three Alm peptides in each direction. After 56 ns we added more water to increase the water/lipid ratio from 20.4 to 40 to remain consistent with the S1 and S2 systems and simulated for an additional 30 ns. These 30 ns were used for analyses of the Ins system described in this paper.
In the simulations, Alm I is used. Glu18 can occur in two different protonation states, which may be relevant in an inserted state. This state is not easy to determine, experimentally or computationally, but we added two Ins simulations with the glutamate protonated to investigate whether this has a significant effect on the electron density. Because the Glu18 side chain has ready access to water, even in the inserted state this had no discernible effect, and we only analyzed the state with Glu18 negatively charged. All simulations use the same force field parameters used in several previous Alm simulations [26,27] based on the lipid parameters from Berger et al. [28] and the ffgmx forcefield as implemented in GROMACS, which is based on GROMOS87 with several important improvements. The Simple Point Charge water model was used [29] with dioleoyl-phosphatidylcholine lipids. All simulations were run with GROMACS 3.2.1 on dual processor Xeon nodes [30]. A cutoff for Lennard-Jones interactions and Coulomb interactions of 1.0 nm was used, together with Particle Mesh Ewald for electrostatic interactions [31]. The temperature was kept at 300 K using the weak coupling method to water/ions, lipids, and peptide separately with a coupling constant of 0.1 ps [32]. The pressure was coupled semi-isotropically, separately in the xy plane, and in the z direction normal to the membrane, to a pressure of 1 bar with a coupling constant of 1 ps [32]. All bonds were constrained using LINCS [33], or SETTLE for water [34]. Molecular graphics were made with VMD [35].
Electron density ρ(z) along the bilayer normal was obtained by averaging a series of snapshots from the simulation results. After subtraction of a constant electron density for pure water, Fourier transformation of ρ(z) gives the form factor F(qz) which was then used for comparison with the experimental form factor.
3. Results
3. A. LAXS |F(qz)| data compared to simulations
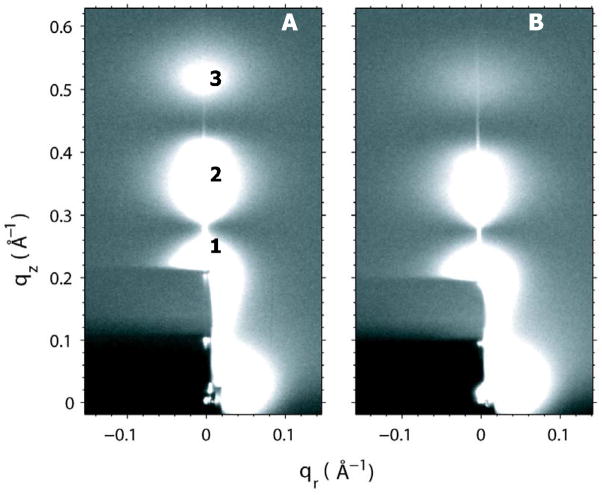
Figure 2A shows the LAXS data for pure DOPC obtained at 30 °C where three lobes of diffuse data are visible. Lobes 2 and 3 were used to analyze the diffuse scattering data in order to obtain the material properties, KC (bending modulus) and B (bulk modulus), as described in Materials and Methods. Fig. 2B shows that Alm has considerable effect on the LAXS data.
Figure 2.
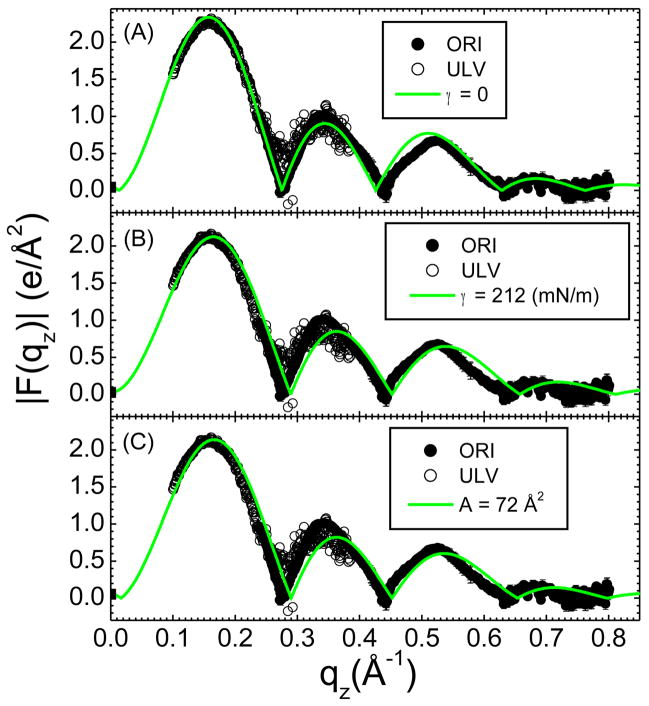
From data sets for oriented DOPC similar to that shown in Fig. 2A and ULV data (CCD images not shown), we obtain the experimental form factor, |F(qz)| shown in Fig. 3. These |F(qz)| data are compared to the |F(qz)| obtained from three different simulations. In Fig. 3A, no lateral tension was applied during the simulation, which resulted in A = 67.5 Å2. In Fig. 3B a constant lateral tension γ = 212 mN/m was applied throughout the simulation, which resulted in A=72 Å2. Instead of setting the lateral tension, a simulation was also performed with A constrained to 72 Å2, which gave the result for |F(qz)| in Fig. 3C which is similar to the result in Fig. 3B. In each comparison to experimental data shown in Figure 3, the unknown experimental scale factors for each of the two data sets, oriented and unilamellar, were determined by obtaining the best fit to the simulations, which are on an absolute scale. The smallest χ2 was obtained for the γ = 0 simulation (Fig. 3A), which encouraged us to use simulations with no surface tension in this study.
Figure 3.
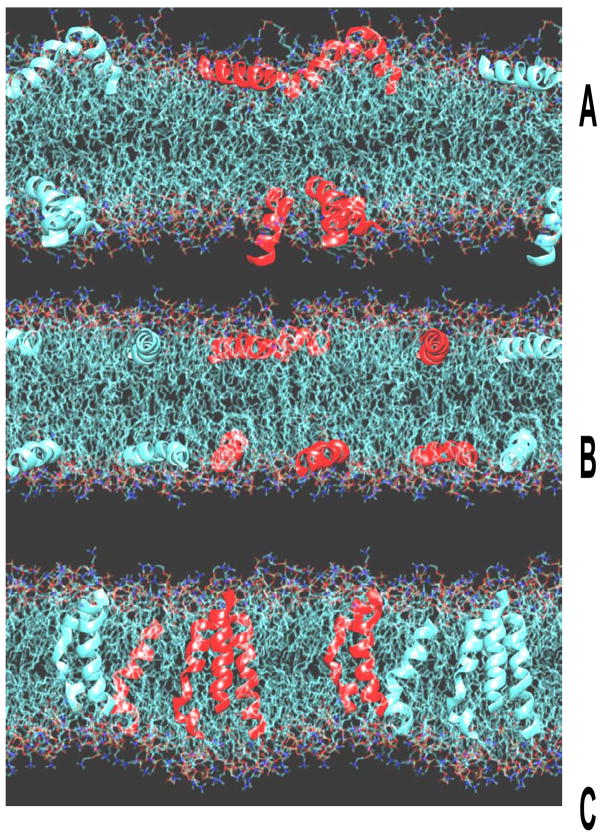
Simulations were performed for the three models in Fig. 1 with Alm/DOPC mole ratio 1/20 and Fig. 4 shows a snapshot of the equilibrated states.
Figure 4.
Figure 5 compares the |F(qz)| obtained from these simulations to the experimental data. Although a visual comparison would not favor the Ins model over the S1 model, the sum of squares of the differences between the simulations and the scaled experimental data, shown in Table 1, shows that the inserted peptide model (Ins) fits the x-ray data better than either of the surface models. Furthermore, the fit to the Ins model is better than fits to any mixtures of S1 with Ins, consistent with having pure Ins. It may also be noted that the form factors for the second and third lobes are smaller relative to the first lobe when Alm is added as can be seen by comparing Fig. 5C with Fig. 3A. This explains the visible difference between the raw data in Fig. 2B compared to Fig. 2A.
Figure 5.
Table 1.
Sum of squares of (|Fsim(q)|−k|Fexp(q)|)2, where k is the scale factor, separately determined for ULV and ORI data, for Alm/DOPC 1/20.
| Model | Sum of squares | |
|---|---|---|
| ULV | ORI | |
| S2 | 3.6 | 10.6 |
| S1 | 2.7 | 11.9 |
| Ins | 0.4 | 5.0 |
3. B. Bending modulus and interactions between bilayers
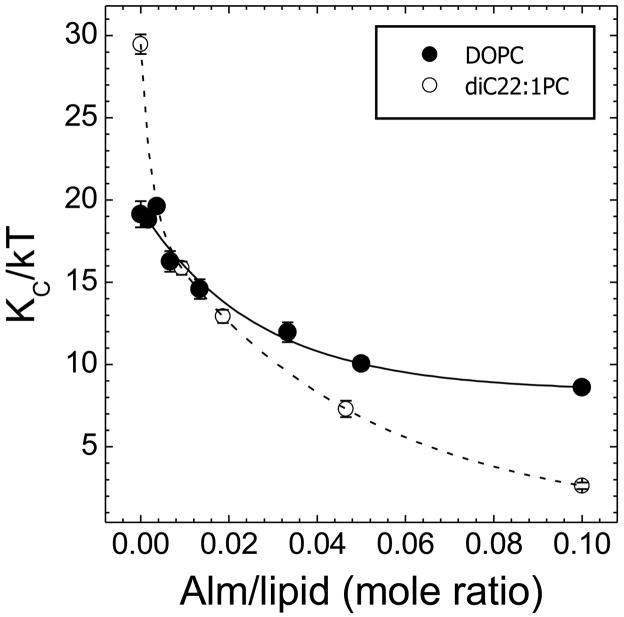
The bending modulus, KC, is determined as a first step in the analysis of diffuse x-ray scattering data [16]. As the bilayers fluctuate more, KC decreases, indicating weakening of the bilayers. Figure 6 shows that Alm causes bilayers to fluctuate more, as shown by a decrease in KC for both DOPC and diC22:1PC. While the decrease in KC could be fit by a single exponential in the case of DOPC, a single exponential fit the data for diC22:1PC only if the zero concentration point was ignored. If this point is included, then a second exponential is required for the fit shown in Fig. 6.
Figure 6.
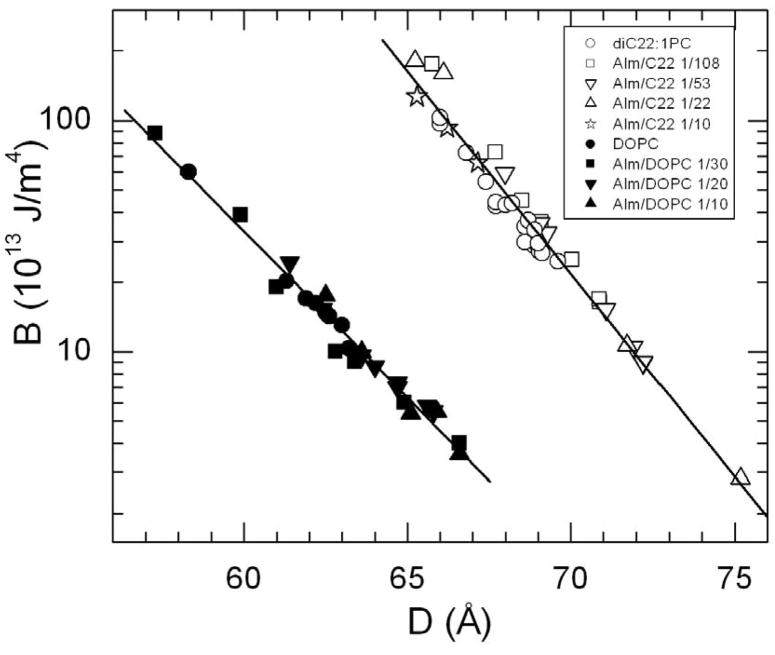
The first step in the analysis also obtains the B modulus, which decays exponentially as a function of the lamellar D-spacing, as shown in Figure 7. (KC is constant over this D range.) For the modest osmotic pressures required to obtain these variations in D, the bilayer thickness changes negligibly, so the D axis can be replaced by the steric water spacing DW′ by subtracting a nearly constant bilayer thickness. If this were done in Fig. 7, the data for diC22:1 would be much closer to those of DOPC because the diC22:1 bilayer is ~7 Å larger [18].
Figure 7.
Table 2 gives the lamellar D-spacing for fully hydrated unoriented multilamellar (MLV) samples. These results are consistent with the largest D values shown in Fig. 7, indicating that full hydration was achieved for the oriented samples. Addition of Alm systematically increased the fully hydrated D. However, it did not result in ‘unbinding’, i.e., D did not become unmeasurably large.
Table 2.
Fully hydrated D-spacings from MLVs
| Lipid | Alm/Lipid Mole Ratio | D-Spacing (Å) |
|---|---|---|
| DOPC | 0 | 63.4 |
| 1/100 | 64.8 | |
| 1/50 | 64.9 | |
| 1/20 | 65.8 | |
| 1/10 | 66.7 | |
| diC22:1PC | 0 | 69.9 |
| 1/108 | 71.7 | |
| 1/53 | 73.3 | |
| 1/22 | 74.7 | |
| 1/10 | 78.2 |
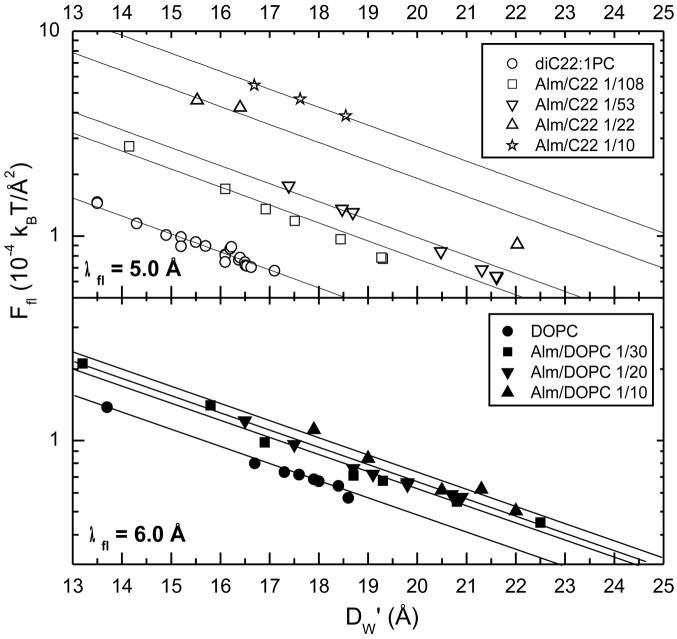
The free energy of the fluctuations (Ffl) (both undulations and compression) per unit area was calculated from the formula [36]
with the results shown in Fig. 8. The straight lines in Fig. 8 are fits of exp(−DW′/λfl) to Ffl(DW′). As shown by the parallel lines for each lipid, the decay length λfl is the same with the addition of Alm, although λfl is somewhat larger for DOPC than for diC22:1PC as indicated by the values shown in Fig. 8. The exponential behavior of Ffl then gives the fluctuation pressure between adjacent bilayers, defined as Pfl = − (∂Ffl/∂DW′)T, to be Pfl = Ffl/λfl.
Figure 8.
In addition to the entropic fluctuation pressure, two other pressures that are thought to be present [37] are the repulsive hydration pressure,
and the attractive van der Waals pressure
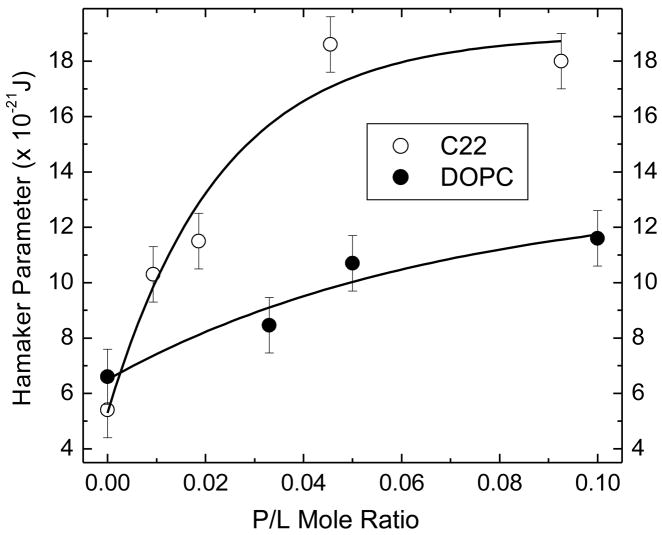
where H is the Hamaker parameter. Although the lipids have no net charge, Alm has a glutamic acid residue which, if deprotonated, would provide a net charge which would require a term for electrostatic interactions. For the moment we will ignore any electrostatic term. At full hydration, where Posm = 0, one can then set Pfl + Phyd = PvdW. Using Ph and h from Tristram-Nagle et al. [38] gives Phyd at full hydration; we note that Phyd is less than 10% as large as Pfl at full hydration, so uncertainties in these parameters make little difference in this calculation. Then, using Pfl from Fig. 8 extrapolated to full hydration allows us to calculate the Hamaker parameter, H, in the van der Waals interaction. Results for Pfl, Phyd, DW′ and H are shown in Table 3. The results for DW′ for full hydration in Table 3 were obtained from the D values in Table 2 by subtracting the thicknesses of DOPC and diC22:1PC bilayers obtained by fitting the F(qz) data to the modeling program (vide infra). The result of balancing the fluctuation and hydration pressures with the van der Waals pressure suggests a slightly larger value of H for DOPC and a significantly larger H for diC22:1PC as Alm is added, shown in Table 3 and plotted in Fig. 9. If an additional electrostatic repulsion were included, the Hamaker parameter would increase even more. The results for Pfl at a fixed value of DW′ (18 Å) shown in the penultimate column of Table 3 increase as Alm is added; this is expected because Alm decreases KC. This increase in Pfl tends to increase the fully hydrated value of DW′, although this is partially opposed by the increase in H.
Table 3.
Interaction Results Neglecting Electrostatics
| Sample | a DW′ Å | a PHYD10−26 J | a Pfl 10−26 J | b Pfl 10−26 J | H 10−21 J |
|---|---|---|---|---|---|
| DOPC | 18.8 | 1.07 | 4.14 | 4.69 | 6.9 |
| Alm (1/30) | 21.4 | 0.33 | 3.41 | 6.05 | 7.4 |
| Alm (1/20) | 20.9 | 0.41 | 3.97 | 6.51 | 8.0 |
| Alm (1/10) | 22.1 | 0.24 | 3.61 | 7.18 | 8.4 |
| diC22:1PC | 17.4 | 2.02 | 5.28 | 4.77 | 5.4 |
| Alm (1/108) | 20.1 | 0.59 | 6.47 | 9.72 | 10.3 |
| Alm (1/53) | 22.3 | 0.22 | 5.20 | 12.38 | 11.5 |
| Alm (1/22) | 25 | 0.064 | 5.89 | 24.56 | 18.6 |
| Alm (1/10) | 29.6 | 0.0079 | 3.33 | 35.59 | 18.0 |
At full hydration
At DW′ = 18 Å
Figure 9.
3. C. Bilayer Thickness
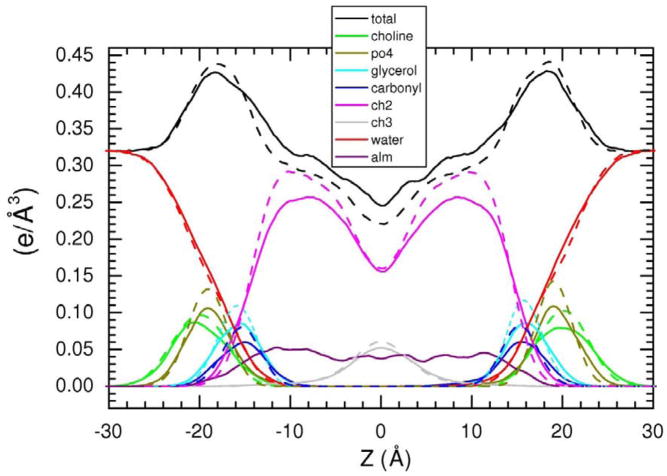
Figure 10 shows the detailed structure obtained from the MD simulation with inserted Alm. In addition to the total electron density, from which the F(q) in Fig. 3 were obtained, MD provides the distribution of individual components of the lipid, the Alm, and the water. The electron density of each lipid component decreased with the addition of Alm due to dilution of the lipid with Alm. The total electron density in the hydrophobic interior (−14 Å to 14 Å) increased because hydrocarbon chains (~0.3 e/Å3) were partially displaced by more electron dense Alm (~0.4 e/Å3). The maximum electron density decreased because the partial mixture of electron dense phosphates (~0.8 e/Å3) and water (~0.33 e/Å3) was further diluted with water covering the Alm.
Figure 10.
Various definitions of bilayer thickness are useful. From the peaks of the phosphate curves in Fig. 10 one can identify a phosphate-phosphate thickness DPP which is very close to the head-head thickness DHH between the maxima in the total electron density profiles shown as the black curves in Fig. 10. The location of the half height (more technically, the Gibbs dividing surface) of the hydrocarbon distribution shown by the magenta curves gives the hydrocarbon thickness 2DC, and location of the half height of the water distribution shown by the red curves gives the Luzzati thickness DB. Fig. 10 shows that none of these thicknesses change appreciably in these simulations when Alm is added to DOPC (1/20).
The volume per lipid in the DOPC simulation was calculated as in Petrache et al. [39], by subtracting the volume of water in the unit cell from the volume of the unit cell Vunit consisting of the area per unit cell Aunit and half the height of the simulation box, where Aunit was the area of the simulation box divided by half the number of lipids. When a concentration c of Alm was added, the same formula for Aunit was employed, so the unit cell volume Vunit contained the volume VL of one lipid plus a fraction c/(1-c) of the volume VAlm of Alm. Results for Aunit and Vunit are given in Table 4. One way to estimate VAlm is to assume that VL is the same as for the pure DOPC bilayer, and this gives VAlm=1882 Å3. This value is smaller than the value 2630 Å3 that was measured by Pabst et al. [13]. If we instead start with this literature value for VAlm, we can calculate VL = 1263 Å3 for DOPC with 1/20 Alm. This suggests that Alm may have a small condensing effect on the volume of DOPC. The same parsing can be applied to areas. Assuming that AL stays the same (67.5 Å2) leads to AAlm = 104 Å2. Alternatively, supposing that the radius R of an Alm alpha helix is R=5 Å (AAlm=78.5 Å2) gives AL= 68.8 Å2 for 1/20 Alm/DOPC, but this would also suggest that the bilayer becomes thinner (DB=VL/AL) and that is inconsistent with Fig. 10.
Table 4.
Structural quantities calculated from MD simulation results
| Sample | Aunit (Å2) | Vunit (Å3) | VDOPC (Å3) | VAlm (Å3) |
|---|---|---|---|---|
| DOPC | 67.5 | 1300 | 1300 | N/A |
| Alm/DOPC(1/20)a | 72.7 | 1394 | 1300 | 1882 |
| Alm/DOPC(1/20)b | 72.7 | 1394 | 1263 | 2630 |
VDOPC as for pure DOPC
VAlm = 2630 Å3 [13]
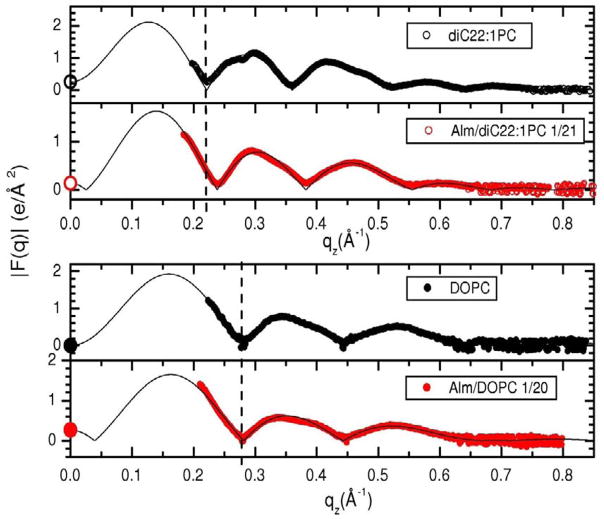
Turning now to x-ray data, Figure 11 compares the experimental x-ray form factors with and without Alm. As shown in Fig. 11, Alm causes a shift to higher q value in the position of the first zero for diC22:1PC; this suggests that Alm makes this bilayer thinner. However, a similar shift to higher q value was not observed for DOPC, which suggests that Alm does not change the thickness of this bilayer.
Figure 11.
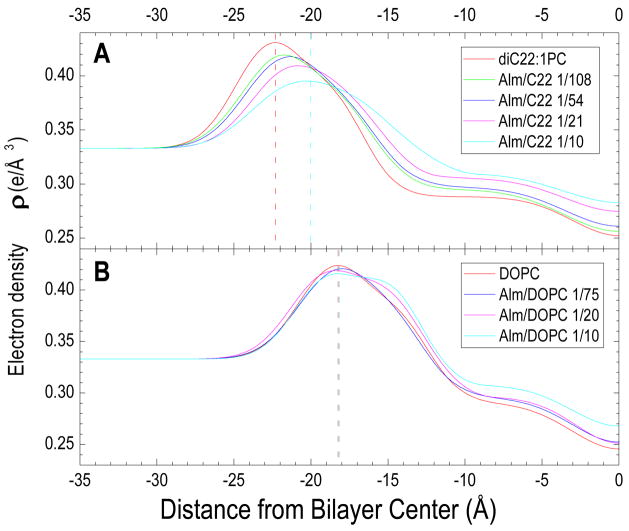
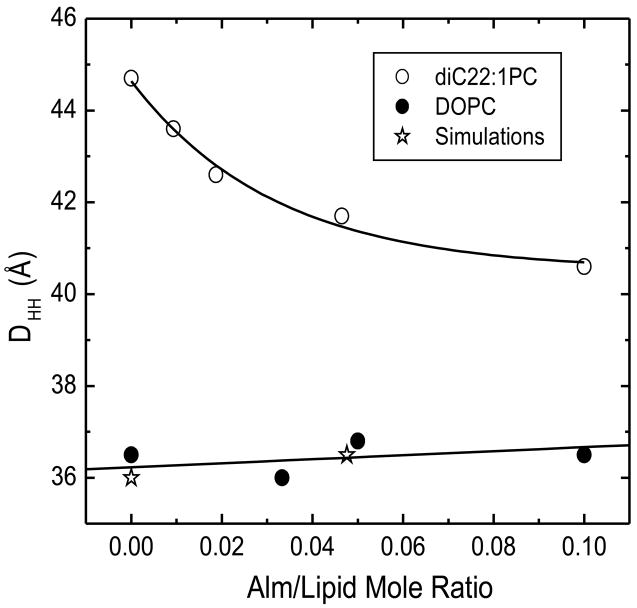
When the experimental form factors in Fig. 11 were fit to the HB model of the electron density, using an inserted transmembrane model for the Alm, electron density profiles were obtained, as shown in Fig. 12. The distance between the maximum intensities across the membrane profile, variously called DHH or DPP, is one measure of bilayer thickness. As Alm is added to diC22:1PC, the maximum electron density moves towards the center of the bilayer located at zero, indicating a thinning of the lipid bilayer by 4 Å at the highest Alm/lipid ratio. For DOPC, no significant movement of the bilayer thickness is obtained, although a shoulder appears with increasing Alm, resulting from the electron density of Alm which extends to −15 Å. Figure 13 plots the changes in bilayer thickness obtained from the electron density profiles in Fig. 12.
Figure 12.
Figure 13.
4. Discussion
4. A. Preference for inserted model
The first result of this paper is that the inserted model used in the MD simulations of Alm/DOPC (1/20) fits the experimental |F(qz)| better than either surface model, S1 or S2, as is shown in Table 1. This preference for inserted Alm is consistent with the results from oriented circular dichroism which showed that the surface state at low concentrations and low humidity converted to a predominantly inserted state as concentration and humidity were raised [15,40,41]. However, in those experiments the humidity was not high enough to provide enough water between bilayers to accommodate an S2 surface state which hypothetically could have been the biologically relevant state. Our result eliminates this possibility; any further transition from an inserted state to an S2 surface state as full hydration is approached is not indicated.
As mentioned in the Introduction, the complimentary use of our x-ray technique with atomic level MD simulations clearly provides the result that Alm is inserted. We suggest that it may be fruitful to study other kinds of model systems by a similar combination of experimental and simulation techniques.
4. B. Molecular Dynamics Controls
The area/lipid that best corresponds to the simulated |F(qz)| is 67.5 Å2, as reported in Table 4. This result disagrees with the area of ~72 Å2 reported in previous x-ray papers [17,18,38,42]. To obtain this larger area in our simulations, we had to apply a lateral surface tension, but then there was poorer agreement between the simulated |F(qz)| and the experimental |F(qz)|. In contrast, it may be noted that Charmm potentials yielded excellent agreement with |F(qz)| when the area for DOPC was constrained to 72 Å2 [43]. We also note that, in a recent work that used neutron scattering data to determine the area/lipid for DOPC, an area of 67.4 Å2 was obtained [44]. In the neutron study, a key distance (DH1) between the phosphate headgroup and the start of the hydrophobic region in the area determination used in modeling our x-ray scattering data was questioned, so the area per molecule for DOPC is being questioned. Nevertheless, the condition of no lateral surface tension works best for the current GROMACS simulations on the control DOPC bilayer, so this is the condition that was also used when Alm was added.
4. C. Effect of Alm on the thickness of bilayers
Our MD simulation gives no change in any of the variously defined bilayer thicknesses when Alm is inserted into a DOPC bilayer. While there is inadequate time for Alm to laterally diffuse or to move to a different state such as the S1 or S2 state, there is ample time for the lipids to accommodate to the Alm because the equilibration time for lipid bilayer structure is shorter than our 100ns simulation time scale. This MD result that Alm does not change the thickness of DOPC is directly supported by our |F(qz)| x-ray scattering data (Fig. 11).
In contrast, we find that the effect of Alm on bilayer thickness is considerably different for the thicker diC22:1PC bilayers than for DOPC bilayers. Our |F(qz)| x-ray scattering data for Alm in diC22:1PC strongly indicate thinning. These x-ray results were quantified by fitting electron density models (Fig. 12) to the |F(qz)| x-ray scattering data. Although there are too many parameters for robust parameter determination of many of the quantities that one would like to know, the head-head thickness DHH is a quantity that is robustly determinable from x-ray data. This allows us to determine that a high concentration of Alm thins the head-head thickness DHH of the diC22:1PC bilayer by 4 Å (Fig. 13) which corresponds to a hydrophobic thickness of 30.4 Å. Our modeling result for Alm in DOPC is consistent with no thinning or at most 1 Å increase in thickness.
We interpret our membrane thickness results in terms of hydrophobic matching [45,46]. The lipid hydrocarbon chains are fluid and it is assumed that, with relatively small free energy costs, they can more readily adapt their local hydrophobic thickness to inserted peptides than can more rigid peptide alpha helices adapt to the preferred local hydrophobic thickness of the chains. The hydrophobic thicknesses have been reported to be 2DC = 26.8 Å for DOPC and 2DC = 34.4 Å for diC22:1PC [18]. Our result for diC22:1PC provides an upper bound of DAlm=30.4 Å for the hydrophobic thickness of Alm because a larger DAlm would not thin the diC22:1PC bilayer by 4 Å. Our result for DOPC provides a lower bound DAlm=26.8 Å because a smaller hydrophobic thickness of Alm would thin the DOPC bilayer. Within the bounded range, we suggest that the smaller end is more likely. To achieve the upper bound would require not only that the bilayer be infinitely more flexible than Alm, but also that all the lipids have the same decreased thickness as those lipids proximal to Alm. The upper bound would also require Alm to tilt by an average angle of 28° in DOPC which seems rather large, although tilt angles of 10–20 degrees have been proposed [10,47]. An average tilt angle of 15° would give DAlm=27.7 Å. If the entire Alm peptide with 20 amino acids is a straight alpha helix, its length would be 30 Å. A length of 32 Å was reported from the crystal structure even though the Alm helix was bent at proline 14 [48]. However, the C-terminal end contains a glutamic acid and so it might be expected to have some hydrophilic character, which would make a smaller hydrophobic thickness more appropriate. We therefore suggest an effective hydrophobic thickness DAlm~27–28 Å, which may be compared to the upper bounds of 26.2 Å and 27.7 Å proposed by Lee et al. [49] using two different lipid systems.
Huang [15] has reviewed his group’s data for the DHH thickness for several peptides. DHH decreased linearly as concentration of peptide/lipid P/L increased to a value P/L*, which depended upon both the peptide and the lipid, and it was shown using OCD that the peptides were in surface states in this low concentration regime P/L<P/L*. This behavior of DHH makes good theoretical sense because surface peptide states require the hydrocarbon chains near the center of the bilayer to occupy additional area; and since the hydrocarbon chain volume can not change significantly, this makes the membrane thinner [50]. Our observation of lack of thining induced by Alm in DOPC suggests that P/L* is small for Alm/DOPC, consistent with a suggested bound of P/L*<1/200 [49].
For higher concentrations, Chen et al. [51] presented a theory which predicts a transition regime P/L*<P/L<P/L** in which the inserted fraction φ increases from 0 to 1 and it was later emphasized [15] that the thickness is predicted to be constant in this transition regime. The high concentration end of this transition regime is given by P/L*/P/L**=β, where the parameter β = the ratio of the thinning of a bilayer due to an inserted peptide to that of a surface state peptide. These theory papers do not specifically predict thickness changes for the fully inserted regime, P/L>P/L**, but it seems clear that thinning would be predicted in this regime provided that β> 0. As discussed above, our results for DOPC are consistent with this theory with a small value of P/L* and a nearly zero value of β. Our result that mixtures of simulated S1 and Ins states gave poorer fits than the pure Ins simulation also supports a small P/L*.
Our results for diC22:1PC and our interpretation in terms of hydrophobic matching are also consistent with the theory [15], provided that there is a small value of P/L* and a value of β substantially greater than 0 so that P/L** is also small. The observed thinning then occurs in the P/L>P/L** regime. The observed decrease in the rate of thinning as the concentration of Alm increases is consistent with the picture that Alm at low concentration thins a local circular domain, but at higher concentrations the domains overlap which causes less thinning. An alternative interpretation of our diC22:1PC data in Fig. 13 that might be considered, is a linearly decreasing portion for P/L < P/L*~ 0.03 followed by a roughly constant portion for P/L>0.03, but we do not favor that interpretation. Lee et al. [49] have shown that P/L* systematically decreases when the lipid shape parameter, which they describe as the ratio of head to tail areas AH/AL, increases. Both DOPC and diC22:1PC have the same headgroup and diC22:1PC has the smaller AL, so this would suggest that diC22:1PC would have a smaller P/L* than DOPC which has already been established to be very small. On the other hand, a larger value of P/L* for diC22:1PC would be expected theoretically from the hydrophobic mismatch which would raise the insertion free energy because the lipids would have to be perturbed. Direct evidence that P/L* is small for diC22:1PC comes from analysis of in-plane scattering; this will be presented in another paper that focuses on peptide organization rather than the effect of the peptide on the bilayer.
Pabst et al. [13] recently reported that Alm decreases the thickness of DOPC by 1.8 Å for 1/25 Alm/DOPC, which disagrees with our result for DOPC. They emphasized that their data do not support the theory [15] because their decrease, both in thickness and in other properties, was exponential rather than linear. They also criticized the theory because it ignores differences in translational entropy between monomeric surface peptides and aggregated inserted peptides. Inclusion of entropy will indeed result in more gradual changes near P/L*, similar to what happens in a critical micelle model, also considered by Lee et al. [49] and very recently by Huang [52] but this is unlikely to make a major difference in our interpretation in this paper. Like us, Pabst et al. [13] also measured diffuse x-ray scattering with the difference that their MLV samples did not give as much information to use in modeling the thickness changes. We describe the similarities and differences in these techniques more fully in Supplementary Material.
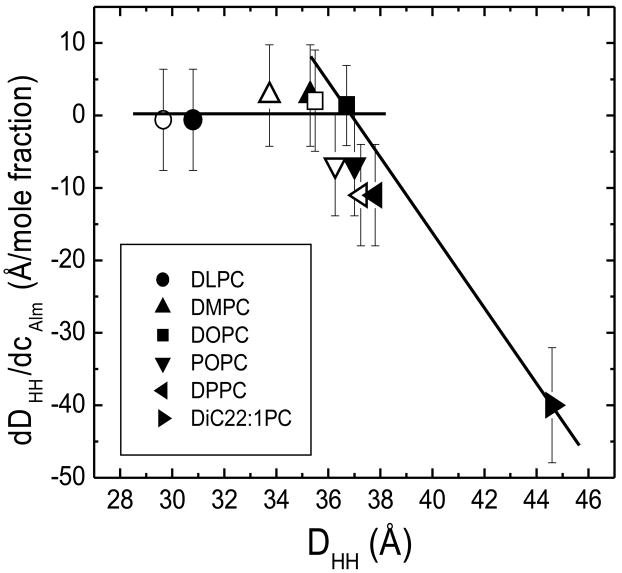
In another x-ray study, Li and Salditt [14] reported a thinning of ~2 Å in 1/25 Alm/DOPC (their Table 1) but wrote that there was no clear thinning in DOPC (p. 3293) and their Fig. 7A indicates a slightly positive value of dDHH/dcAlm. Although their experiments were done at low humidity (see Supplementary Material for more detail comparing their experimental method with ours), their results for DHH for several lipids fit nicely into our hydrophobic matching analysis. Fig. 14 shows that Alm does not thin DLPC and DMPC bilayers (dDHH/dcAlm is essentially zero) that have thickness DHH smaller than that of DOPC. This first implies that P/L* is small for DLPC and DMPC as well as for DOPC. The result that Alm neither thins nor thickens these three bilayers that differ in thickness by 6 Å is then consistent with tilting of Alm in bilayers that have a smaller hydrophobic thickness than Alm because tilting would likely require even less energy than bilayer thickening. However, Alm tilting is not an energetically favorable response for thicker bilayers, which would then be expected to have negative values of dDHH/dcAlm. Although Li and Salditt [14] did not consider this interpretation, their data for POPC and DPPC are consistent with it, although the error bars are too large to make a convincing case. Our new result in Fig. 14 for Alm in diC22:1PC does allow a strong case to be made that there are two regimes when P/L* is small, an Alm tilting regime for thinner bilayers and a bilayer thinning regime for thicker bilayers. Recent MD simulations are consistent with this (see Fig. 7 in Monticelli et al., [53]). Of course, bilayers with a substantially non-zero value of P/L* would be expected to thin due to Alm on the surface, even though they are thinner than the hydrophobic thickness of Alm; this accounts for the observed thinning of DPhyPC, which has been reported to be about 1 Å thinner than DOPC [15].
Figure 14.
4. D. Bending modulus KC
Our work shows that Alm reduces the bending modulus of DOPC by a factor of 2 and even more, by a factor ~10, for diC22:1PC (Fig. 6). A similar factor of ~2 for a 1/25 P/L mole ratio of Alm in DOPC membranes was reported by Pabst et al. [13] although their result was obtained indirectly because it is only possible to obtain the product KCB from scattering data from isotropic samples. Comparison between their method and ours is made in Supplementary Material. Another study [54] measured fluctuations directly on giant vesicles by confocal microscopy and reported a factor of 4 decrease in KC for both diphytanoylPC and DLPC membranes, although the concentration of Alm could only be estimated based on partition coefficients.
A priori, we expected inserted Alm to act as a bilayer rigidifier and we did not expect it to decrease KC. Regarding the possible origin of the decrease in the bending modulus, Bivas and Méléard [55] suggested that lateral placement of additives in the membrane could produce spontaneous curvature, which could then roughen the membrane which would give an apparent decrease in KC. This could have played a role in our study of the HIV fusion peptide which may not extend all the way across the bilayer and would therefore likely induce local spontaneous curvature; there we found an even greater decrease in KC (a factor of ~13 for diC22:1PC and a factor of ~3 for DOPC membranes) [56]. However, local spontaneous curvature would seem much less likely for transmembrane Alm which would presumably affect both monolayers nearly equally and not lead to artifactual interpretation of KC. The much greater decrease in KC in diC22:1PC than in DOPC would be partly due to decreased thickness, although that alone would only account for a 22% decrease assuming the usual quadratic dependence of KC on the hydrophobic thickness [57]. More importantly, the local curvature induced by hydrophobic matching would induce disorder in proximal lipids that would provide low free energy hinges for bending.
4. E. Interactions between bilayers
Since our model system consists of a stack of ~2000 bilayers, we can also obtain information about the interactions between bilayers. Besides obtaining the bending modulus, KC, which is a single bilayer property, we also obtain an interbilayer compressibility modulus, B, which is a harmonic approximation for the energy of fluctuations in the interbilayer spacing [36]. The B modulus decays exponentially as the interbilayer water spacing increases (Fig. 7) implying that the fluctuational free energy and the fluctuational pressure also decrease exponentially, in agreement with the theory of soft confinement [58]. The decay lengths λfl = 6.0 Å for Alm/DOPC and λfl = 5.0 Å for Alm/diC22:1PC are independent of Alm concentration and larger than predicted by the theory in agreement with earlier experimental results [36]. Alm does affect the fluctuation free energy Ffl as plotted in Fig. 8, since Ffl is also affected by changes in KC.
We then calculated the Hamaker parameter H by requiring the attractive van der Waals pressure PvdW to balance with the repulsive fluctuational pressure Pfl and the hydration pressure Phyd at full hydration where the osmotic pressure Posm =0. Our calculation ignored any repulsive electrostatic pressure Pelec, which might have been expected to increase D to infinity (unbinding), but unbinding was not observed; inclusion of Pelec would increase our values of H. The result in Fig. 9 indicates that Alm may increase H for DOPC by about 20% although the uncertainties would also allow for no increase in H, as was assumed by Pabst et al. [13] in their analysis. An increase in H can be explained conceptually as our measuring an apparent H that applies to a system where the water spacing fluctuates around an average value rather than the conventional H that would apply to flat membranes separated by the same average water spacing. The basic idea is that the magnitude of the van der Waals interaction is increased more for those bilayers that approach each other than by those bilayers that move apart by the same amount. This concept is included in rigorously derived formulae for a model of corrugated sheets where there were sinusoidal deviations [37, 59]; our use of those results treats the effect of smaller KC by increasing the amplitude of the corrugations and that gives values consistent with ~20% increase for DOPC. However, the probability distribution function for sinusoidal corrugations is artificial, so we have also used the more accurate asymmetrical probability distribution function obtained from Monte Carlo simulations [60], but with simple pairwise interactions. That gives ~18% increase in H for DOPC.
Unlike the good agreement of the theoretical H with the experimental H for DOPC, we have not been able to justify theoretically the very large experimental increases in H for diC22:1PC shown in Fig. 9. Although the larger decrease in KC causes an even larger spread in the probability distribution function for the water spacing between neighboring Alm/diC22:1PC membranes, the concomitantly larger water spacing acts to nullify that factor for increasing H. A different explanation is that the large increase in H might be an artifact from applying an analysis to our diffuse scattering data that does not include other forms of disorder that might be induced in the diC22:1PC bilayer by the hydrophobicly mismatched Alm. Additional disorder could lead to an artifactually large decrease in KC. Because the most robustly determined quantity from diffuse scattering is the product KCB (which is also most important for the structural data analysis), this would make B, Ffl and Pfl too large. Then, balancing the van der Waals pressure would yield an artifactually larger H. This issue can perhaps be resolved in future work which collects both osmotic pressure data and x-ray data for diC22:1PC, especially under higher osmotic pressure where Pfl becomes negligible.
Acknowledgments
We thank Drs. Georg Pabst and Huey Huang for helpful discussions. This research was supported by NIH grant GM 44976 (JFN) and a CIHR operating grant (DPT), and DPT received salary support from CIHR and AHFMR. X-ray data were collected at the Cornell High Energy Synchrotron Source (CHESS), which is supported by the NSF and the NIH/NIGMS under NSF grant DMR-0225180.
Footnotes
Publisher's Disclaimer: This is a PDF file of an unedited manuscript that has been accepted for publication. As a service to our customers we are providing this early version of the manuscript. The manuscript will undergo copyediting, typesetting, and review of the resulting proof before it is published in its final citable form. Please note that during the production process errors may be discovered which could affect the content, and all legal disclaimers that apply to the journal pertain.
References
- 1.Woolley GA, Wallace BA. Model ion channels: Gramicidin and alamethicin. J Memb Biol. 1992;129:109–136. doi: 10.1007/BF00219508. [DOI] [PubMed] [Google Scholar]
- 2.Bechinger B. Structure and functions of channel-forming peptides: magainins, cecropins, melittin and alamethicin. J Memb Biol. 1997;156:197–211. doi: 10.1007/s002329900201. [DOI] [PubMed] [Google Scholar]
- 3.Cafiso DS. Alamethicin: a peptide model for voltage gating and protein-membrane interactions. Annu Rev Biophys Biomol Struct. 1994;23:141–165. doi: 10.1146/annurev.bb.23.060194.001041. [DOI] [PubMed] [Google Scholar]
- 4.Sansom MSP. Structure and function of channel-forming peptaibols. Quat Rev Biophys. 1993;26:365–421. doi: 10.1017/s0033583500002833. [DOI] [PubMed] [Google Scholar]
- 5.Cantor RS. Alamethicin: A peptide model for voltage gating and protein-membrane interactions. Annu Rev Biophys Biomol Struct. 2002;23:141–165. doi: 10.1146/annurev.bb.23.060194.001041. [DOI] [PubMed] [Google Scholar]
- 6.Rizzo V, Stankowski S, Schwarz G. Alamethicin incorporation in lipid bilayers: a thermodynamic study. Biochemistry. 1987;26:2751–2759. doi: 10.1021/bi00384a015. [DOI] [PubMed] [Google Scholar]
- 7.He K, Ludtke SJ, Heller WT, Huang HW. Mechanism of alamethicin insertion into lipid bilayers. Biophys J. 1996a;71:2669–2679. doi: 10.1016/S0006-3495(96)79458-4. [DOI] [PMC free article] [PubMed] [Google Scholar]
- 8.He K, Ludtke SJ, Worcester DL, Huang HW. Neutron scattering in the plane of membranes; structure of alamethicin pores. Biophys J. 1996b;70:2659–2666. doi: 10.1016/S0006-3495(96)79835-1. [DOI] [PMC free article] [PubMed] [Google Scholar]
- 9.Baumann G, Mueller P. A molecular model of membrane excitability. J Supramol Struct. 1974;2:538–557. doi: 10.1002/jss.400020504. [DOI] [PubMed] [Google Scholar]
- 10.Spaar A, Münster C, Salditt T. Conformation of peptides in lipid membranes studied by x-ray grazing incidence scattering. Biophys J. 2004;87:396–407. doi: 10.1529/biophysj.104.040667. [DOI] [PMC free article] [PubMed] [Google Scholar]
- 11.Sansom MSP. The biophysics of peptide models of ion channels. Prog Biophys Mol Biol. 1991;55:139–236. doi: 10.1016/0079-6107(91)90004-c. [DOI] [PubMed] [Google Scholar]
- 12.Vodyanoy I, Hall JE, Balasubramanian TM. Alamethicin-induced current-voltage curve asymmetry in lipid bilayers. Biophys J. 1983;42:71–82. doi: 10.1016/S0006-3495(83)84370-7. [DOI] [PMC free article] [PubMed] [Google Scholar]
- 13.Pabst G, Danner S, Podgornik R, Katsaras John. Entropy-driven softening of fluid lipid bilayers by alamethicin. Langmuir. 2007;23:11705–11711. doi: 10.1021/la701586c. [DOI] [PubMed] [Google Scholar]
- 14.Li C, Salditt T. Structure of magainin and alamethicin in model membranes studied by x-ray reflectivity. Biophys J. 2006:3285–3300. doi: 10.1529/biophysj.106.090118. [DOI] [PMC free article] [PubMed] [Google Scholar]
- 15.Huang HW. Molecular mechanism of antimicrobial peptides: The origin of cooperativity. Biochim Biophys Acta. 2006;1758:1292–1302. doi: 10.1016/j.bbamem.2006.02.001. [DOI] [PubMed] [Google Scholar]
- 16.Lyatskaya Y, Liu Y, Tristram-Nagle S, Katsaras J, Nagle JF. Method for obtaining structure and interactions from oriented lipids. Bilayers Phys Rev E. 2001;63:0119071(1–9. doi: 10.1103/PhysRevE.63.011907. [DOI] [PMC free article] [PubMed] [Google Scholar]
- 17.Liu Y, Nagle JF. Diffuse scattering provides material parameters and electron density profiles of biomembranes. Phys Rev, E. 2004;69(1–4):040901. doi: 10.1103/PhysRevE.69.040901. [DOI] [PMC free article] [PubMed] [Google Scholar]
- 18.Kucerka N, Tristram-Nagle S, Nagle JF. Structure of fully hydrated fluid phase lipid bilayers with monounsaturated chains. J Memb Biol. 2005a;208:193–202. doi: 10.1007/s00232-005-7006-8. [DOI] [PubMed] [Google Scholar]
- 19.Tristram-Nagle S, Kucerka N, Tieleman DP, Nagle JF. Increase in area/unit cell of Alamethicin in DOPC seen by XRD and MD simulations. 2005 Biophysical Society Meeting Abstracts, BJ Supplement; 2005. p. 252a. Abstract, 1241-Pos. [Google Scholar]
- 20.Tristram-Nagle S, Liu Y, Legleiter J, Nagle JF. Structure of gel phase DMPC determined by x-ray diffraction. Biophys J. 2002;83:3324–3335. doi: 10.1016/S0006-3495(02)75333-2. [DOI] [PMC free article] [PubMed] [Google Scholar]
- 21.Tristram-Nagle S. Preparation of oriented, fully hydrated lipid samples for structure determination using x-ray scattering. In: Dopico A, editor. Methods in Molecular Biology. Vol. 400. Humana Press; Totowa, N.J.: 2007. pp. 63–75. (Methods in Membrane Lipids) [DOI] [PMC free article] [PubMed] [Google Scholar]
- 22.Kucerka N, Liu Y, Chu N, Petrache HI, Tristram-Nagle S, Nagle JF. Structure of fully hydrated fluid phase DMPC and DLPC lipid bilayers using X-ray scattering from oriented multilamellar arrays and from unilamellar vesicles. Biophys J. 2005b;88:1–12. doi: 10.1529/biophysj.104.056606. [DOI] [PMC free article] [PubMed] [Google Scholar]
- 23.Klauda JB, Kucerka N, Brooks BR, Pastor RW, Nagle JF. Simulation-based methods for interpreting x-ray data from lipid bilayers. Biophys J. 2006;90:2796–2807. doi: 10.1529/biophysj.105.075697. [DOI] [PMC free article] [PubMed] [Google Scholar]
- 24.Kucerka N, Nagle JF, Feller SE, Balgavy P. Models to analyze small angle neutron scattering from unilamellar lipid vesicles. Phys Rev E. 2004;69(1–9):051903. doi: 10.1103/PhysRevE.69.051903. [DOI] [PubMed] [Google Scholar]
- 25.Kandt C, Ash WL, Tieleman DP. Setting up and running membrane protein simulations. Methods. 2007;41:475–488. doi: 10.1016/j.ymeth.2006.08.006. [DOI] [PubMed] [Google Scholar]
- 26.Tieleman DP, Berendsen HJC, Sansom MSP. An alamethicin channel in a lipid bilayer: Molecular dynamics simulations. Biophys J. 1999a;76:1757–1769. doi: 10.1016/s0006-3495(99)77337-6. [DOI] [PMC free article] [PubMed] [Google Scholar]
- 27.Tieleman DP, Sansom MSP, Berendsen HJC. Alamethicin helices in a bilayer and in solution: Molecular dynamics simulations. Biophys J. 1999b;76:40–49. doi: 10.1016/S0006-3495(99)77176-6. [DOI] [PMC free article] [PubMed] [Google Scholar]
- 28.Berger O, Edholm O, Jahnig F. Molecular dynamics simulations of a fluid bilayer of dipalmitoylphosphatidycholine at full hydration, constant pressure and constant temperature. Biophys J. 1997;72:2002–2013. doi: 10.1016/S0006-3495(97)78845-3. [DOI] [PMC free article] [PubMed] [Google Scholar]
- 29.Berendsen HJC, Postma JPM, van Gunsteren WF, Hermans J. Interaction models for water in relation to protein hydration. In: Pullman B, editor. Intermolecular Forces. Dordrecht, The Netherlands: D. Reidel; 1981. pp. 331–342. [Google Scholar]
- 30.Lindahl E, Hess B, van der Spoel D. GROMACS 3.0: a package for molecular simulation and trajectory analysis. J Mol Model. 2001;7:306–317. [Google Scholar]
- 31.Essmann U, Perera L, Berkowitz ML, Darden T, Lee H, Pedersen LG. A smooth particle mesh Ewald method. J Chem Phys. 1995;103:8577–8593. [Google Scholar]
- 32.Berendsen HJC, Postma JPM, van Gunsteren WF, DiNola A, Haak JR. Molecular dynamics with coupling to an external bath. J Chem Phys. 1984;81:3684–3690. [Google Scholar]
- 33.Hess B, Bekker H, Berendsen HJC, Fraaije J. LINCS: A linear constraint solver for molecular simulations. J Comput Chem. 1997;18:1463–1472. [Google Scholar]
- 34.Miyamoto S, Kollman PA. Settle – an analytical version of the shake and rattle algorithm for rigid water models. J Comput Chem. 1992;13:952–962. [Google Scholar]
- 35.Humphrey W, Dalke A, Schulten K. VMD: Visual molecular dynamics. J Mol Graphics. 1996;14:33–38. doi: 10.1016/0263-7855(96)00018-5. [DOI] [PubMed] [Google Scholar]
- 36.Petrache HI, Gouliaev N, Tristram-Nagle S, Zhang R, Suter RM, Nagle JF. Interbilayer interactions from high-resolution x-ray scattering. Phys Rev E. 1998;57:7014–7024. [Google Scholar]
- 37.Parsegian VA, Van der Waals VA. Forces: A handbook for biologists, chemists, engineers, and physicists. Cambridge University Press; New York: 2006. [Google Scholar]
- 38.Tristram-Nagle S, Petrache HI, Nagle JF. Structure and interactions of fully hydrated dioleoylphosphatidylcholine bilayers. Biophys J. 1998;75:917–925. doi: 10.1016/S0006-3495(98)77580-0. [DOI] [PMC free article] [PubMed] [Google Scholar]
- 39.Petrache HI, Feller SE, Nagle JF. Determination of component volumes of lipid bilayers from simulations. Biophys J. 1997;70:2237–2242. doi: 10.1016/S0006-3495(97)78867-2. [DOI] [PMC free article] [PubMed] [Google Scholar]
- 40.Huang HW, Wu Y. Lipid-alamethicin interactions influence alamethicin orientation. Biophys J. 1991;60:1079–1087. doi: 10.1016/S0006-3495(91)82144-0. [DOI] [PMC free article] [PubMed] [Google Scholar]
- 41.Huang HW. Action of antimicrobial peptides: two-state model. Biochemistry. 2000;39:3751–3758. doi: 10.1021/bi000946l. [DOI] [PubMed] [Google Scholar]
- 42.Pan J, Tristram-Nagle S, Nagle JF. Temperature dependence of structure, bending rigidity and bilayer interactions of DOPC bilayers. Biophys J. 2008;94:117–124. doi: 10.1529/biophysj.107.115691. [DOI] [PMC free article] [PubMed] [Google Scholar]
- 43.Tristram-Nagle S, Nagle JF. Lipid bilayers: thermodynamics, structure, fluctuations and interactions. Chem Phys Lipids. 2004;127:3–14. doi: 10.1016/j.chemphyslip.2003.09.002. [DOI] [PMC free article] [PubMed] [Google Scholar]
- 44.Kucerka N, Nagle JF, Sachs JN, Feller SE, Pencer J, Jackson A, Katsaras J. Lipid bilayer structure determined by the simultaneous analysis of neutron and X-ray scattering data. Biophys J. 2008;95:2356–2367. doi: 10.1529/biophysj.108.132662. [DOI] [PMC free article] [PubMed] [Google Scholar]
- 45.Killian A. Hydrophobic mismatch between proteins and lipids in membranes. Biochim Biophys Acta. 1998;1376:401–416. doi: 10.1016/s0304-4157(98)00017-3. [DOI] [PubMed] [Google Scholar]
- 46.Lee AG. Lipid-protein interactions in biological membranes: a structural perspective. Biochim Biophys Acta. 2003;1612:1–40. doi: 10.1016/s0005-2736(03)00056-7. [DOI] [PubMed] [Google Scholar]
- 47.Bak M, Bywater RP, Hohwy M, Thomsen JK, Adelhorst K, Jakobsen HJ, SØrensen OW, Nielsen NC. Conformation of alamethicin in oriented phospholipid bilayers determined by 15N solid state nuclear magnetic resonance. Biophys J. 2001;81:1684–1698. doi: 10.1016/S0006-3495(01)75822-5. [DOI] [PMC free article] [PubMed] [Google Scholar]
- 48.Fox RO, Richards FM. A voltage-gated ion channel model inferred from the crystal-structure of Alamethicin at 1.5 Å resolution. Nature. 1982:325–330. doi: 10.1038/300325a0. [DOI] [PubMed] [Google Scholar]
- 49.Lee MT, Chen FY, Huang HW. Energetics of pore formation induced by membrane active peptides. Biochemistry. 2004;43:3590–3599. doi: 10.1021/bi036153r. [DOI] [PubMed] [Google Scholar]
- 50.Huang HW. Elasticity of lipid bilayer interacting with amphiphilic helical peptides. J Phys II France. 1995;5:1427–1431. [Google Scholar]
- 51.Chen FY, Lee MT, Huang HW. Evidence for membrane thinning effect as the mechanism for peptide-induced pore formation. Biophys J. 2003;84:3751–3758. doi: 10.1016/S0006-3495(03)75103-0. [DOI] [PMC free article] [PubMed] [Google Scholar]
- 52.Huang HW. Free Energies of Molecular Bound States in Lipid Bilayers: Lethal Concentrations of Antimicrobial Peptides. Biophys J. 2009 doi: 10.1016/j.bpj.2009.01.030. in press. [DOI] [PMC free article] [PubMed] [Google Scholar]
- 53.Monticelli L, Kandasamy SK, Periole X, Larson RG, Tieleman DP, Marrink SJ. The MARTINI coarse-grained force field: extension to proteins. J Chem Theory and Comput. 2008;4:819–834. doi: 10.1021/ct700324x. [DOI] [PubMed] [Google Scholar]
- 54.Vitkova V, Méléard P, Pott T, Bivas I. Alamethicin influence on the membrane bending elasticity. Eur Biophys J. 2006;35:281–286. doi: 10.1007/s00249-005-0019-5. [DOI] [PubMed] [Google Scholar]
- 55.Bivas I, Méléard P. Bending elasticity of a lipid bilayer containing an additive. Phys Rev E. 2003;67(1–4):012901. doi: 10.1103/PhysRevE.67.012901. [DOI] [PubMed] [Google Scholar]
- 56.Tristram-Nagle S, Nagle JF. HIV-1 fusion peptide decreases bending energy and promotes curved fusion intermediates. Biophys J. 2007;93:2048–2055. doi: 10.1529/biophysj.107.109181. [DOI] [PMC free article] [PubMed] [Google Scholar]
- 57.Rawicz W, Olbrich KC, McIntosh TJ, Needham D, Evans E. Effect of chain length and unsaturation on elasticity of lipid bilayers. Biophys J. 2000;79:328–339. doi: 10.1016/S0006-3495(00)76295-3. [DOI] [PMC free article] [PubMed] [Google Scholar]
- 58.Podgornik R, Parsegian VA. Thermal mechanical fluctuations of fluid membranes in confined geometries – the case of soft confinement. Langmuir. 1992;8:557–562. [Google Scholar]
- 59.Emig T, Hanke A, Golestanian R, Kardar M. Normal and lateral Casimir forces between deformed plates. Phys Rev A. 2003;67(1–15):022114. [Google Scholar]
- 60.Gouliaev N, Nagle JF. Simulations of interacting membranes. Phys Rev Letts. 1998;81:2610–2613. doi: 10.1103/PhysRevLett.81.2610. [DOI] [PMC free article] [PubMed] [Google Scholar]


