Abstract
We demonstrate laser-scanning coherent anti-Stokes Raman scattering (CARS) imaging with two excitation laser beams delivered by a large-mode-area photonic crystal fiber. The group-velocity dispersion and self-phase modulation effects are largely suppressed due to the large mode area of the fiber and the use of pico-second pulses. The fiber delivery preserves the signal level and image spatial resolution well. High-quality images of live spinal cord tissues are acquired using the fiber-delivered laser source. Our method provides a basic platform for developing a flexible and compact CARS imaging system.
Coherent anti-Stokes Raman scattering (CARS) microscopy is an emerging multiphoton vibrational imaging technique.1 In CARS microscopy, two pulsed beams at pump frequency ωp and Stokes frequency ωs (ωp>ωs) are tightly focused into a sample to generate a signal at anti-Stokes frequency ωas=2ωp−ωs. Precise spatial and temporal overlap of the pump and Stokes pulses are needed to generate the CARS signal. Currently CARS microscopy involves challenging free-space alignment between the two-beam source and the microscope. Because they provide the flexibility of sending light to a remote location, optical fibers have been widely used in confocal fluorescence microscopy,2 optical coherence tomography,3,4 and in vivo optical imaging.5 The major obstacles to fiber delivery of ultrafast laser pulses arise from group-velocity dispersion (GVD) and self-phase modulation (SPM).6 Recently multimode fibers, large-mode-area photonic crystal fibers (PCFs), high-order mode fibers, and single-mode fiber with adaptive dispersion compensation have been used to deliver femtosecond pulses with little distortion.7–11 Nevertheless, delivery of two ultrafast pulsed beams in the same fiber has not been reported. Here we demonstrate CARS imaging with two picosecond (ps) beams delivered by a large-mode-area PCF. We show that both GVD and SPM are negligible in this method and that high-quality CARS images can be acquired at a high speed.
We theoretically estimated the GVD and SPM effects for the two fibers used in our experiments. The first is a large-mode-area polarization-maintaining PCF (LMA-PM-16, Crystal Fibre). The PCF is single mode with a low loss of <0.02 dB/m in the 750–1300 nm region. The second is a normal single-mode fiber (SMF; 780HP, Thorlabs, Inc). The lengths of both fibers were L=1 m. We first calculated the pulse broadening due to GVD. In the near-IR region where the pump (~710 nm) and Stokes (~880 nm) lasers reside, the waveguide dispersion in the fiber is negligible compared with the material dispersion of silica (360 fs2 /cm at 800 nm).6 For a 100 fs pulse commonly used in two-photon fluorescence imaging, the pulse broadening was calculated to be 367 fs, more than 3 times the input pulse width. Therefore, prefiber chirp compensation or working at zero-dispersion wavelength is needed for distortion-free fiber delivery.8,9 However, for the 2 ps pulses used in our CARS setup, the pulse broadening was calculated to be 18 fs, which is only 1% of the pulse width. In estimating the SPM effect we assume a pulse duration of 2 ps and pulse energy of 0.5 nJ. For the SMF with 5 µm mode field diameter, the pulse peak intensity was calculated to be I=1.27 GW/cm2. By using n2=2.67×10⁻²⁰ m2 /W for the nonlinear index coefficient of silica7,12 and an incident wavelength of λ =710 nm, the SPM-induced phase shift was calculated to be (2πn2/λ)×L×I=3.0, which is sufficient to cause broadening and generate wings in the spectral profile.12 For the PCF with the 13 µm mode field diameter, the laser intensity at pulse peak was calculated to be 0.188 GW/cm2. The SPM-induced phase shift was calculated to be 0.44, which is considered a weak effect.12 Thus the quality of ps pulses can be well preserved during transmission in the large-mode-area PCF. Below we test these calculations experimentally.
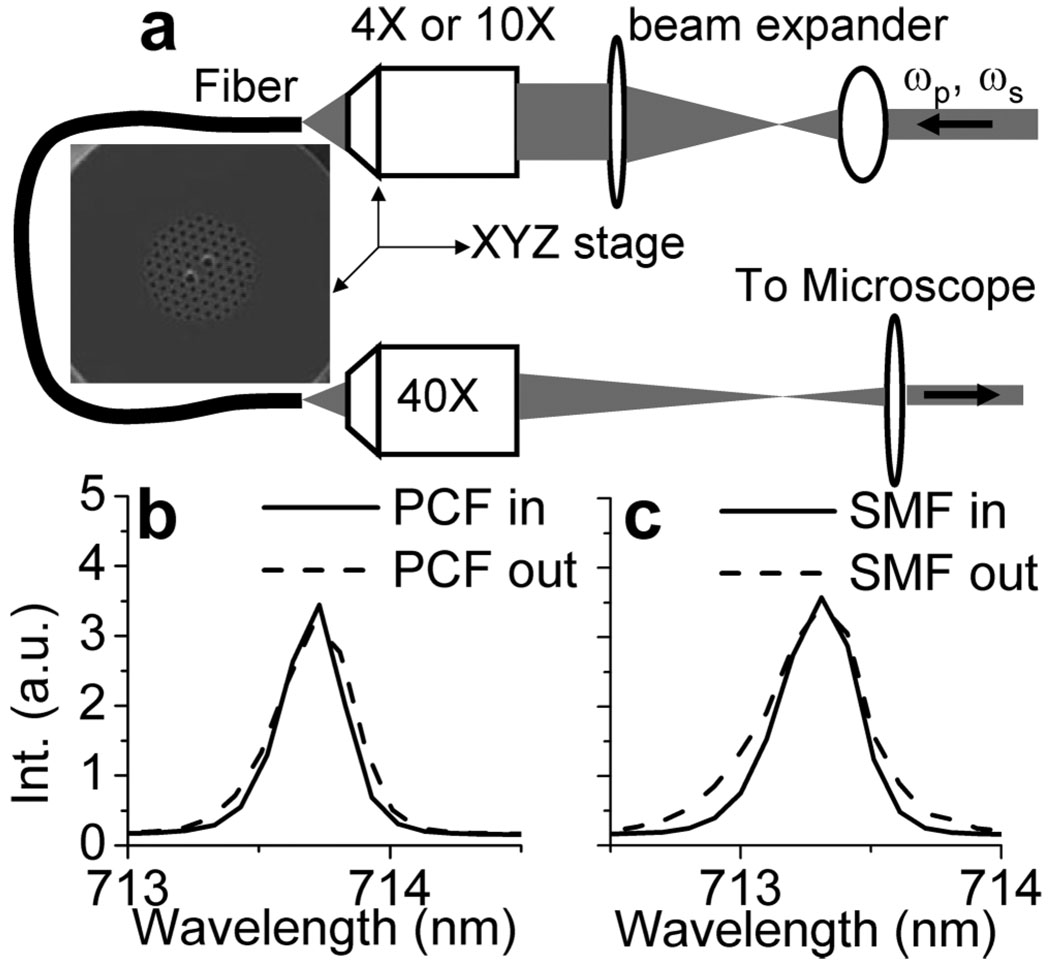
Our fiber delivery device is shown in Fig. 1a. The pump and Stokes beams are provided by two synchronized Ti:sapphire oscillators (Mira900, Coherent, Inc.) at a repetition rate of 78 MHz, with pulse widths around 2.0 and 3.0 ps, respectively. The two laser beams were collinearly combined and coupled into the 1 m PCF (numerical aperture NA=0.05) or SMF (NA=0.13) through a 4× beam expander and then a 4× (NA=0.1, Olympus) or 10× (NA=0.25, Leica) microscope objective, both being infinity corrected and achromatic. The objectives were mounted on an XYZ stage (Melles Griot Nanomax) to optimize the coupling efficiency. The output of the fiber was collimated by an infinity corrected achromatic 40× objective (NA=0.66, Leica) that has 90% transmission for both lasers. An f=250 mm lens was used in combination with the 40× objective to adjust the output beams to an appropriate size for our laser-scanning microscope (IX700/FV300, Olympus, Inc.). The collimating objective was carefully aligned with respect to the fiber core to overlap the two beams laterally into the same focus. Both forward CARS (F-CARS) and epi (backward) CARS (E-CARS) signals were detected with photomultiplier tubes.
Fig. 1.
Examination of SPM effects in different fibers. a, fiber coupling setup. The inset shows the PCF cross section. b, Pump laser spectra before and after the large mode area PCF. c, Pump laser spectra with the normal SMF.
The coupling efficiency was measured as the percentage ratio of the fiber output to input laser power. For a single beam, efficiency higher than 30% was achieved, but the coupling could not be simultaneously optimized for both beams because of the residual aberration of the objectives. For the 4× objective, which has a 45 mm focal length, the focal points for the pump and Stokes beams were found to be 0.36 mm apart. To optimize the CARS signal generation, we chose to generate similar coupling efficiencies for both beams. For the SMF, we obtained 16% efficiency for the pump beam and 7% for the Stokes beam by use of the 10× objective. For the PCF, we obtained 9% efficiency for both beams by use of the 10× objective. A higher efficiency, 15% (pump) and 13% (Stokes), was obtained with the 4× objective. The current coupling efficiencies are sufficient for our CARS imaging experiments.
To analyze the GVD and SPM effects, we measured the autocorrelation traces and spectral profiles of the laser beams before and after the PCF or SMF. The autocorrelation traces of the input pump and Stokes beams showed FWHM of 2.8 and 4.7 ps, corresponding to a pulse width of 2.0 and 3.3 ps, respectively. The average laser power at the fiber exit was 39 mW for the pump and 17 mW for the Stokes, corresponding to pulse energy of 0.5 and 0.22 nJ, respectively. The fiber input and output spectra were measured with a spectrometer (HR2000, Ocean Optics). For the PCF, the input and output Stokes laser spectra at 880 nm were identical (data not shown); the output spectrum of the pump laser near 713 nm was similar to the input but seemed slightly broadened (Fig. 1b). The autocorrelation traces of both lasers showed the same FWHM as the input. These results showed good preservation of the pulse quality in the PCF.
For the SMF, the output spectrum and the autocorrelation trace of the Stokes beam were found to be the same as the input (data not shown). However, the output spectrum of the pump beam showed two elevated wings (Fig. 1c), consistent with our theoretical estimation. Additionally, the autocorrelation trace of the output pump pulse was broadened by 10%, rendering a FWHM of 3.1 ps (Note that SPM may also reduce pulse duration, depending on the chirp of the input pulse.13) These results indicate that the pump pulse was distorted by SPM. We also measured the spectra of a 200 fs beam at 780 nm before and after the PCF (data not shown). With an average power of 100 mW inside the PCF, the spectral FWHM was broadened from 5 to 12 nm after the PCF. Thus, the use of ps pulses and the large-mode-area PCF are both critical for minimizing the SPM effect.
We also inspected the beam polarization after the fiber. The input pump and Stokes beams were both horizontally polarized. By rotating the polarization-maintaining PCF, the output pump and Stokes lasers were kept linearly polarized along the same direction. For the SMF, the output Stokes beam was nearly linearly polarized, while the pump beam became elliptically polarized with a 10:1 extinction ratio. This depolarization may cause a slight decrease of the CARS signal.
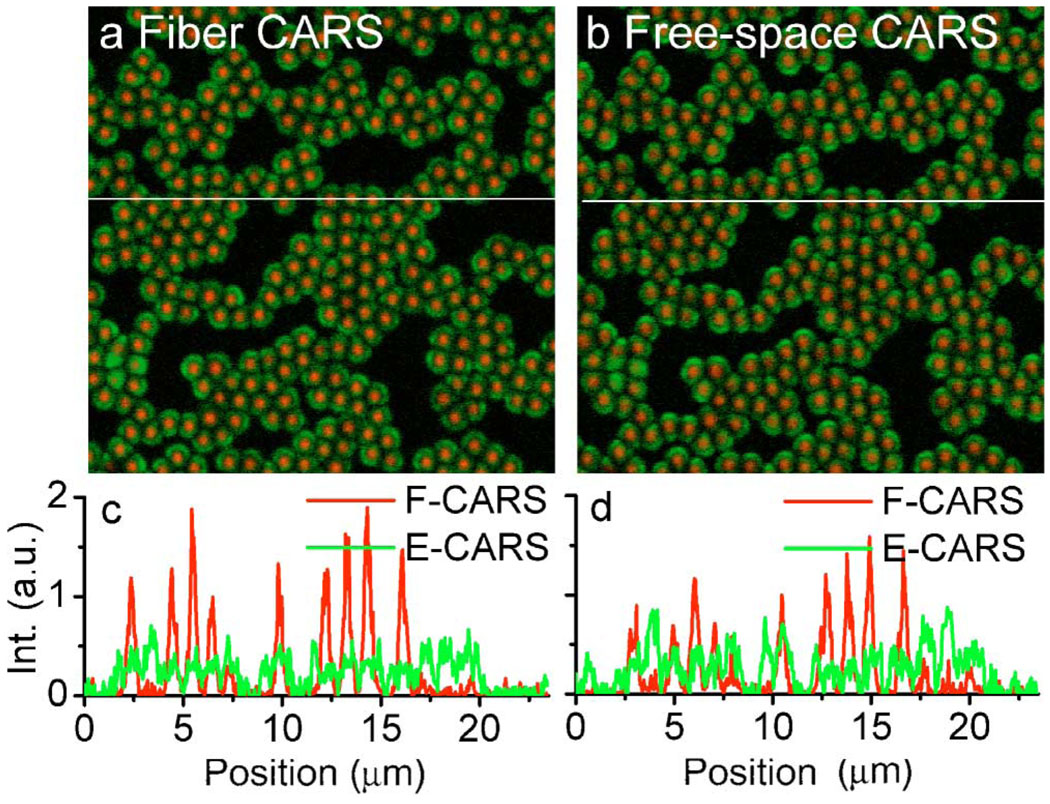
To examine the impact of fiber delivery on CARS signal generation, we have acquired CARS images of 1 µm melamine beads used as a standard sample with the PCF- or SMF-delivered laser source and with the free-space laser source at the same average power. The overlaid E- and F-CARS images taken with the PCF-delivered sources and free-space sources are shown in Figs. 2a and 2b. The F-CARS and E-CARS signals arose from the central region and the edges of the beads, respectively. Figures 2a and 2b have the same signal level, indicating that PCF delivery did not reduce the imaging sensitivity. However, the CARS signal from the SMF-delivered source was only half of that from the PCF delivered sources (data not shown), indicating that the pulse distortion caused by SPM seriously lowered the CARS efficiency.
Fig. 2.
(Color online) Comparison of CARS signal between PCF and free-space delivery. a, CARS image of 1–µm melamine beads with PCF delivered laser source. Pump 14170 cm–1, 39 mW; Stokes 11330 cm–1, 17 mW. Red color: F-CARS; green color: E-CARS. b, CARS image with free space lasers of same frequency and power. c,d, Line profile for a and b, respectively.
To check whether the PCF delivery affects the axial overlap of the two beams, we acquired depth CARS images of a poly(ethyl vinyl acetate) (PEVA) film spin coated on a coverglass (data not shown). From the depth profiles we measured the axial resolution of free-space and PCF-delivered E-CARS to be 0.75 and 0.80 µm, respectively. These results show that the axial overlap of the two beams was well maintained with the PCF delivery.
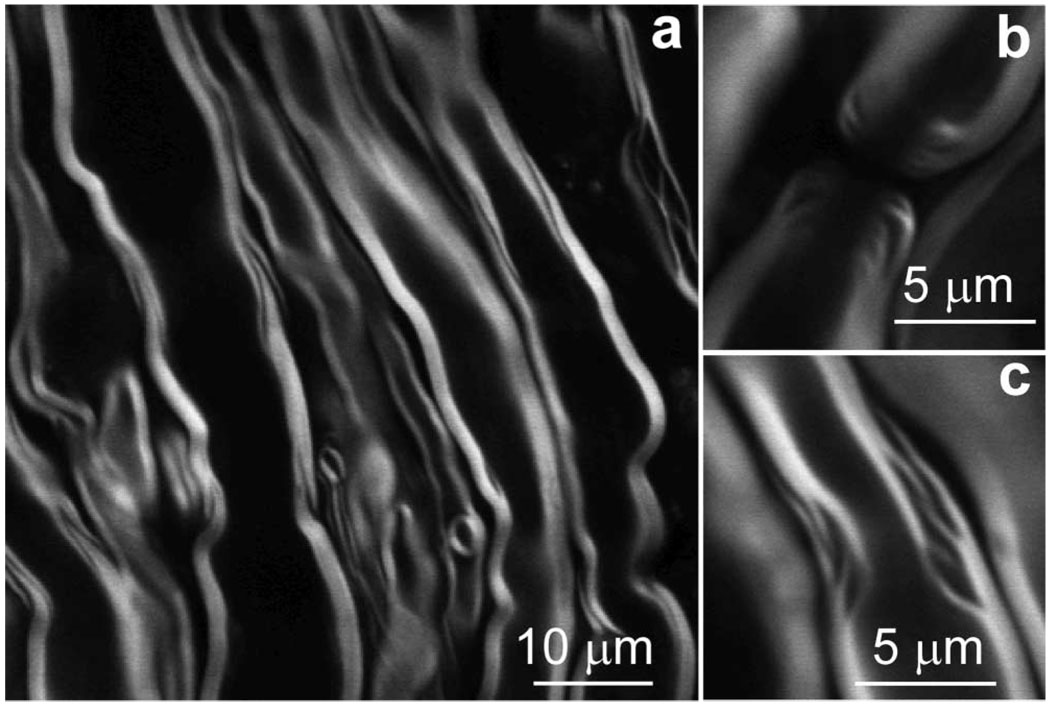
Using the PCF-delivered laser source, we performed CARS imaging of spinal cord tissues isolated from rats. The sample preparation procedure can be found in Ref. 14. The myelin sheath surrounding the axons produces a strong CARS signal at a CH2 symmetrical stretching frequency of 2840 cm−1.14 Figure 3a shows the E-CARS image of parallel myelinated axons. The acquisition speed was 1.1 s per frame. We were able to resolve detailed myelin structures including the node of Ranvier (Fig. 3b) and Schmidt–Lanterman incisure (Fig. 3c).
Fig. 3.
E-CARS images of axonal myelin sheath with PCF delivered laser source. Pump 14170 cm–1, 60 mW; Stokes 11330 cm–1, 20 mW. a, Image of parallel myelinated axons. b, Node of Ranvier. c, Schmidt-Lanterman incisure.
In summary, we have studied the delivery of two ps laser pulses by the same optical fiber for CARS imaging. When a normal SMF is used, the SPM effect can cause pulse distortion and significantly reduce the CARS signal. By use of a PCF that performs as a large-mode-area SMF within a broad wavelength region (750–1300 nm), the SPM effects can be largely suppressed so that the CARS signal level and the spatial resolution are well preserved. Using the PCF-delivered laser sources, we are able to acquire high-quality CARS images of axonal myelin in live spinal tissues at high speed. Although fiber delivery inevitably introduces loss of the laser power, it allows many applications, including the development of CARS endoscopy. In general, our method provides a basis for building a flexible and compact CARS imaging system.
Acknowledgment
We are grateful for Yan Fu’s help with the tissue sample preparation. This work was supported by NIH R21 grant EB004966-01.
Footnotes
OCIS codes: 110.0180, 110.2350, 300.6230.
References
- 1.Cheng JX, Xie XS. J. Phys. Chem. B. 2004;108:827. [Google Scholar]
- 2.Laemmel E, Genet M, Le Goualher G, Perchant A, Le Gargasson JF, Vicaut E. J. Vasc. Res. 2004;41:400. doi: 10.1159/000081209. [DOI] [PubMed] [Google Scholar]
- 3.Sharma U, Fried NM, Kang JU. IEEE J. Sel. Top. Quantum Electron. 2005;11:799. [Google Scholar]
- 4.Tearney GJ, Brezinski ME, Bouma BE, Boppart SA, Pitris C, Southern JF, Fujimoto JG. Science. 1997;276:2037. doi: 10.1126/science.276.5321.2037. [DOI] [PubMed] [Google Scholar]
- 5.Flusberg BA, Cocker ED, Piyawattanametha W, Jung JC, Cheung ELM, Schnitzer MJ. Nat. Methods. 2005;2:941. doi: 10.1038/nmeth820. [DOI] [PMC free article] [PubMed] [Google Scholar]
- 6.Agrawal G. Nonlinear Fiber Optics. 2001 Academic. [Google Scholar]
- 7.Helmchen F, Tank DW, Denk W. Appl. Opt. 2002;41:2930. doi: 10.1364/ao.41.002930. [DOI] [PubMed] [Google Scholar]
- 8.Ouzounov DG, Moll KD, Foster MA, Zipfel WR, Webb WW, Gaeta AL. Opt. Lett. 2002;27:1513. doi: 10.1364/ol.27.001513. [DOI] [PubMed] [Google Scholar]
- 9.Gobel W, Nimmerjahn A, Helmchen F. Opt. Lett. 2004;29:1285. doi: 10.1364/ol.29.001285. [DOI] [PubMed] [Google Scholar]
- 10.Ramachandran S, Yan MF, Jasapara J, Wisk P, Ghalmi S, Monberg E, Dimarcello FV. Opt. Lett. 2005;30:3225. doi: 10.1364/ol.30.003225. [DOI] [PubMed] [Google Scholar]
- 11.Lee SH, Cavalieri AL, Fritz DM, Myaing M, Reis DA. Opt. Lett. 2004;29:2602. doi: 10.1364/ol.29.002602. [DOI] [PubMed] [Google Scholar]
- 12.Stolen RH, Lin C. Phys. Rev. A. 1978;17:1448. [Google Scholar]
- 13.Gomes ASL, Sibbett W, Taylor JR. Appl. Phys. B. 1986;39:43. [Google Scholar]
- 14.Wang H, Fu Y, Zickmund P, Shi R, Cheng JX. Biophys. J. 2005;89:581. doi: 10.1529/biophysj.105.061911. [DOI] [PMC free article] [PubMed] [Google Scholar]


