

Abstract
The cerebral accumulation of β-amyloid (Aβ) is a consistent feature of and likely contributor to the development of Alzheimer’s Disease (AD). In addition to dysregulated production, increasing experimental evidence suggests reduced catabolism also plays an important role in Aβ accumulation. We have previously shown that neprilysin (NEP), the major protease which cleaves Aβ in vivo, is modified by 4-hydroxy-nonenal (HNE) adducts in the brain of AD patients. In order to determine if these changes affected Aβ, SH-SY5Y cells were treated with HNE or Aβ, and then NEP mRNA, protein levels, HNE adducted NEP, NEP activity and secreted Aβ levels were determined. Intracellular NEP developed HNE adducts after 24 h of HNE treatment as determined by immunoprecipitation, immunoblotting and double immunofluorescence staining. HNE-modified NEP showed decreased catalytic activity, which was associated with elevations in Aβ1-40 in SH-SY5Y and H4 APP695wt cells. Incubation of cells with Aβ1-42 also induced HNE adduction of NEP. In an apparent compensatory response, Aβ treated cells showed increased NEP mRNA and protein expression. Despite elevations in NEP protein, the activity was significantly lower compared to the NEP protein level. The present study demonstrates that NEP can be inactivated by HNE-adduction, which is associated with, at least partly, reduced Aβ cleavage and enhanced Aβ accumulation.
Keywords: Neprilysin (NEP), 4-hydroxy-nonenal (HNE), oxidative stress, beta-amyloid, degradation, Alzheimer’s disease
Introduction
Alzheimer’s disease (AD) is a progressive neurodegenerative disorder that gradually damages the neocortex and hippocampus, reducing memory, learning and reasoning (Selkoe 2001). AD is characterized by extensive amyloid deposition, neurofibrillary tangles (NFT), inflammation, and ultimately synaptic and neuronal loss (Wang et al. 2006, 2008). A large body of evidence suggests that the accumulation of β-amyloid (Aβ) is a crucial event in the initiation and maintenance of neuronal degeneration in AD (Bard et al. 2000; Selkoe 2001; Hardy and Selkoe 2002; Forman et al. 2004). Aβ neurotoxicity has been demonstrated both in vitro (Yankner et al. 1990; Pike et al. 1995) and in vivo (Kowall et al. 1992; Frautschy et al. 1996; Hardy 1997). Although the mechanisms that contribute to abnormal Aβ accumulation are not fully understood, both increased production and decreased degradation have been observed. Despite its importance Aβ catabolism remains understudied (Saido and Iwata 2006).
In normal brain, rapid proteolysis attenuates Aβ accumulation. The degradation process occurs primarily through the action of a group of peptidases including neprilysin (NEP), insulysin (insulin degrading enzyme, IDE) and endothelin converting enzyme (ECE). NEP appears to be the predominant Aβ protease (Carson and Turner 2002; Eckman and Eckman 2005; Vardy et al. 2005; Wang et al. 2006). NEP (also known as neutral endopeptidase, EC3.4.24.11, enkephalinase, and CD10) is a 97 kDa type II membrane-bound zinc metalloendopeptidase. NEP is ubiquitously expressed by neurons, and is capable of degrading both monomeric and oligomeric forms of Aβ and several other neuropeptides (Higuchi et al. 2005). NEP expression is reduced in the hippocampus and cortex of aged mice (Iwata et al. 2002; Apelt et al. 2003; Caccamo et al. 2005) while Aβ is elevated in NEP KO mice or those treated with NEP inhibitors (Iwata et al. 2001; Marr et al. 2004; Turner et al. 2004). Conversely, over-expression of NEP reduced Aβ levels in a dose-dependent manner (Iwata et al. 2004; Marr et al. 2004) and protected neurons from Aβ toxicity in vitro (El-Amouri et al. 2007).
In addition to age-dependent changes, neurons in the vicinity of abundant plaques showed reduced NEP mRNA and protein levels when compared to age-matched normal controls (Yasojima et al. 2001b; Yasojima et al. 2001a; Wang et al. 2003; Caccamo et al. 2005; Wang et al. 2005). We showed that NEP was selectively decreased in AD brains but not in pathological aging (PA) (Wang et al. 2005). The greatest reductions occurred in regions most vulnerable to AD pathology, such as hippocampus and association cortex while the cerebellum or peripheral organs were spared (Yasojima et al. 2001b; Caccamo et al. 2005). NEP levels were inversely correlated with senile plaque counts and total Aβ levels in cortical homogenates and positively correlated with clinical cognitive scores (Wang et al. 2005). These data support the hypothesis that decreased NEP contributes to Aβ deposition and neuronal dysfunction in AD.
Oxidative stress has long been recognized as a contributing, early factor in AD (Smith et al. 1991; Harman 1993; Olanow 1993; Smith et al. 1995; Smith et al. 2000; Varadarajan et al. 2000). Aβ induces free radical generation (Smith et al. 1991; Montine et al. 1996; Sayre et al. 1997; Pratico et al. 1998; Nunomura et al. 2001; Nunomura et al. 2004; David et al. 2005; Schuessel et al. 2005; Shi and Gibson 2007) and elevated 4-hydroxynonenal (4-HNE), a marker of lipid peroxidation, is present in plaques (Ando et al. 1998). HNE can interact with and inactivate a variety of enzymes including NEP (Wang et al. 2003). Here, we show that NEP can be modified in vitro by exogenous HNE or by HNE induced by Aβ from cultured human neuroblastoma cell lines. HNE-adduction reduced NEP activity and attenuated Aβ turnover. Stressed neuroblastoma cells showed compensatory increases in NEP expression but lower total activity. Therefore, the effects of oxidative stress on NEP and Aβ accumulation can be modeled in vitro.
Materials and Methods
Chemicals and Reagents
Synthetic human β-amyloid peptide 1-42 were purchased from BACHEM. Dithiothreitol (DTT), protease inhibitors cocktail (P8430) were obtained from Sigma-Aldrich. 4-Hydroxy-2-nonenal (HNE) was obtained from A.G. Scientific, Inc. Mac-R-P-P-G-F-S-A-F-K (Dnp)-OH Fluorogenic Peptide Substrate V, RNAse-free DNase came from R&D and Promega, respectively. GE nitrocellulose membrane was purchased from ISC BioExpress. An enhanced emiLuminescence (ECL) kit and Seize® Classic (G) Immunoprecipitation Kit were obtained from Pierce. Human neprilysin ELISA kit and Aβ1-40 protein ELISA kit are from R&D and Invitrogen, respectively. Other general chemicals and reagents were from Fisher Scientific.
Antibodies were from the following sources: Rabbit anti-HNE and Rabbit anti-NEP antibody (Chemicon); CD10 clonal 56C6 (Thermo Scientific). Anti-human/mouse Rhodamine conjugated affinity purified secondary antibody, goat anti-rabbit fluorescein conjugated secondary antibody, HRP conjugated secondary antibody were purchased from Chemicon.
Cell culture
SH-SY5Y neuroblastoma cells, obtained from the American Type Culture Collection (ATCC), were maintained in a humidified atmosphere of 95% air and 5% CO2 at 37°C. Cells were seeded into plates or dishes in DMEM/F12 (1:1) medium, supplemented with 10% (v/v) fetal bovine serum (FBS), 100 U/ml penicillin and 100 μg/ml streptomycin.
Human neuroglioma H4 cell line was obtained from ATCC (item number: HTB-148). H4 cells stably transfected with human βAPP695wt cDNA under control of a CMV promoter (pcDNA3, Invitrogen) was kindly provided by B.C Eckman’s lab (Mayo Clinic, Jacksonville). H4 were grown in Opti-MEM (Gibco). The media were supplemented with 10% FBS and penicillin/streptomycin. The polyclonal H4 APP695wt line was maintained in 500 μg/ml geneticin (Gibco).
Cell treatments with HNE and β-amyloid peptide
SH-SY5Y cells were seeded into 100 mm dishes at a density of 2 × 10⁴ cells per ml. Experiments were carried out 24–48 h after cells were seeded. Different concentrations of HNE (dissolved in 3% DMSO) or Aβ (dissolved in 0.4% DMSO) were added to the cultures 24 h before harvest. Final concentrations of DMSO in medium were <0.003%. Vehicles (with same concentrations of DMSO) were added to the cultures as controls.
Real time RT-PCR
Total RNA from a well of 6-wells plate was isolated using the RNeasy kit (Qiagen Inc., Valencia, CA) according to the manufacturer’s instructions. The concentration of nucleic acids was determined spectrophotometrically at 260 nm and 280 nm, taking into account the dilution factor. RQ1 RNase-free DNase (Promega) was used to remove relict of DNA which might interfere the output of PCR. For the PCR first strand synthesis was performed using the Omiscript® RT Kit (Qiagen Inc.). The resulting cDNA was then assayed by real time PCR.
Real time PCR was performed in 0.2 ml thin wall PCR plates using the iCycler thermal cycler (Bio-rad) and carried out with iQ SYBR Green supermix (Bio-rad) according to the manufacturer’s instructions. The standard reaction mix consisted of iQ SYBR Green supermix, forward and reverse primers at a final concentration of 500 nM each, 10 pg DNA template, DNase free water to give final volume of 20 μl. The mixture was heated to 95°C for 3 min followed by 35 cycles with denaturation at 95°C for 30 s, annealing at 60°C for 30 s and extension at 72°C for 30 s. Human S26 was used as reference gene. Primer sequences for real time PCR: S26:5′-CGC AGC AGT CAG GGA CAT TT-3′ (F), 5′-TTC ACA TAC AGC TTG GGA AGC-3′ (R); NEP: 5′-GCC TCA GCC GAA CCT ACA AG-3′ (F), 5′-AGT TTG CAC AAC GTC CTC AAG TT-3′ (R).
Relative quantification of genes expression was carried out by comparative Ct method according to manufacture’s protocol (User Bulletin #2: ABI PRISM 7700 Sequence Detection System). Briefly, the genes mRNA level was expressed in cycle threshold (Ct) value; the Ct values for each sample were averaged from duplicate. Differences between the mean Ct values of NEP and reference gene were calculated as ΔCtsample= Ct NEP−Ct s26 for different treated groups, and that of the ΔCt for the control groups were set for calibrator (ΔCtcalibrator). Final results, the sample-calibrator ratio, expressed as N-fold differences of NEP expression in the HNE or Aβ1-42 groups compared with control, were determined as 2−(ΔCt sample−ΔCt calibrator).
Immunoprecipitation, Immunoblotting and Protein Quantification
After incubation with HNE (5 and 10 μM) or Aβ (1 and 2 μM) for 24 h, cells were harvested, lysed in Passive Lysis Buffer containing protease inhibitors cocktail (Sigma P8430). Lysates were incubated for 30 min on ice, and then centrifuged at 10,000 × g for 10 min at 4 °C. Protein concentration in the supernatant was determined by Coomassie blue protein binding method using protein quantification Kit-rapid (Sigma/Fluka) with bovine serum albumin as standard. The same amount of protein from HNE-treated, Aβ1-42 and vehicle-treated cells were used for western blotting assay and immunoprecipitation.
For NEP protein levels detection, samples containing equal amounts of protein were denatured in protein sample buffer (100 mM Tris-Cl pH 6.8, 4% SDS, 0.2% bromophenol blue, 20% glycerol, 20% H2O, 200 mM DTT) at 100°C for 10 min and loaded, separated on 10% SDS–polyacrylamide gels and transferred to nitrocellulose membranes in a Bio-rad electrophoresis system. After blocking with TBST containing 5% non-fat milk, the membranes were kept at 4 °C overnight with primary antibodies (1:5000 for β-actin, 1:1000 for NEP, respectively), followed by HRP-conjugated secondary antibodies (1:5000 to 1:10000 dilution) at room temperature for 2 h. The target protein bands were detected using the ECL Western blotting detection system (Pierce) and autoradiography film (Fisher).
Immunoprecipitation with anti-NEP was performed with Seize® Classic (G) Immunoprecipitation Kit according to the manufacturer’s protocol. For total cell extract preparation, SH-SY5Y cells were lysed in Passive Lysis Buffer containing protease inhibitors cocktail (P8430, Sigma). Lysates were incubated for 30 min on ice, and then centrifuged at 10,000 × g for 15 min at 4°C. Supernatants with same amount of protein were incubated with rabbit anti-NEP polyclonal antibody (Chemicon, 1 μg/ml) at 4°C overnight. After washing Immobilized Protein G by adding 0.4 ml of BupH™ Modified Dulbecco’s PBS twice, the immune complexes were added to the spin cup containing the equilibrated immobilized protein G and incubated for more than 1 hour at 4°C. The samples were centrifuged briefly to remove the flow-through solution. The beads were extensively washed with BupH™ Modified Dulbecco’s PBS. The immunoprecipitated proteins were eluted by adding equal volume of ImmunoPure® Elution Buffer and then analyzed by Western blotting with anti-HNE and anti-NEP antibodies.
The density of the NEP and HNE blotting bands were quantified by ImageJ software (1.37v, Wayne Rasband, National Institutes of Health, USA) as described (Farrer et al. 2004; Wang et al. 2007).
Double immunofluorescence staining
Cells were fixed with 4% paraformaldehyde at room temperature (RT) for 20 min and permeabilized with 0.2% Triton X-100 in PBS. After blocking for 1 h at RT with 1% goat serum/PBS, cells were incubated overnight at 4°C in a humidity chamber with primary anti-NEP (1:200). At the end of the incubation, the cells were rinsed three times with PBS-Tween-20 (0.05%) and incubated with the FITC conjugated goat anti-rat (1:50) for 60 min at room temperature. Then the cells were fixed with 4% paraformaldehyde at RT for 15 min. After rinsing with PBS for 3 times, second primary rabbit anti-HNE (1:200) were added and incubated for 2 h at RT or overnight at 4°C. Secondary, TRITC conjugated anti-rabbit IgG (1:50) were incubated for another 60 min at RT. All primary and secondary antibodies were diluted in PBS with 1% normal goat serum. After a rinse with PBS, the cells were photographed and analyzed with a fluorescent microscope (Nikon, E600, Japan). The immunofluorescence staining was done at least three times to assess the reproducibility of the results. In order to confirm the specificity of immunostaining for the second cycle, the primary or secondary antibodies were omitted or replaced with preimmue IgG.
Fluorometric assay of NEP activity
NEP activity was determined by Fluorescence Resonance Energy Transfer (FRET). After extraction with a final concentration of 0.1% Triton X-100 in phosphate-buffered saline (PBS; pH 7.4) for 30 minutes on ice, NEP activity in cell lysates was analyzed using a synthetic NEP fluorogenic peptide substrate (Mca-RPPGFSAFK[Dnp]-OH; R&D Systems, Inc., Minneapolis, MN) (Johnson and Ahn 2000) at room temperature in the presence or absence of the NEP inhibitor, thiorphan. Samples dissolved in 50 mM HEPES buffer [pH 7.5] were preincubated with 10 μM thiorphan or PBS for 10 minutes prior to adding fluorogenic peptide substrate (dissolved in HEPES). Fluorescence was read after excitation at 320 nm and emission at 405 nm on a fluorescent ELISA plate reader (Spectra Max Gemini; Molecular Devices, Sunnyvale, CA). For kinetic analysis the cell lysates were incubated with increasing concentrations of substrate (4–20 μM) at room temperature. Fluorescence over the time was measured for 1 hour. The specific NEP activity was determined as the fluorescence difference occurring in the presence or absence of 10 μM thiorphan. Kinetic isotherms (Vmax and Km values) for NEP activity were determined by means of non-linear least squares fitting to the Michaelis-Menten equation using GraphPad Prim software (version 3.0 for Windows, ISI Software San Diego. CA, USA).
To measure the activity of membrane-bound enzyme, cell suspensions were prepared, then washed with PBS. 5 × 10⁴ cells were resuspended in 50 μl of PBS contained in each well of black microtiter plates. The 50 μl substrate (10 μM in 50 mM HEPES) was added, and incubated at room temperature for 60 min. As above, thiorphan was used to determine the specific NEP activity in intact cells.
Sandwich ELISA measurement of NEP protein level and Immunocaptured specific NEP activity assay
Cells treated by vehicles, HNE or Aβ1-42 were lysated with Passive Lysis Buffer containing protease inhibitors cocktail (Sigma P8430). After 30 min incubation on ice, the lysates were centrifuged at 1300 rpm for 15 min at 4°C. Every single sample was assigned to the assays of NEP level (ELISA) and NEP activity (immunocapture-based).
NEP protein level and specific activity were measured by using DuoSet® ELISA kit (R&D). Sandwich ELISA assay of NEP was performed according to the protocol provided by manufacturer. Standard curves were produced from serial dilutions of recombinant human NEP.
For the immunocapure-based NEP activity (Miners et al, 2008), 96-well high binding ELISA plates (BD) were coated with 100 μl capture NEP (goat anti-human, 1.6 μg/mL) antibody diluted in PBS (137 mM NaCl, 2.7 mM KCl, 8.1 mM Na2HPO4, 1.5 mM KH2PO4, pH 7.2) and left for 18 h at room temperature. The plates were washed with PBS containing 0.05% tween-20 for 3 times. After 60 min blocking with PBS containing 1% BSA fraction V, 100 μL of standards or supernatants were added and incubated at 4°C overnight. After 3 washes, the fluorogenic peptide (10 μM) diluted in 100 mM Tris-HCl pH 7.5, 50 mM NaCl and 10 μM ZnCl2 was added and incubated at 37°C in dark. Fluorescent readings were taken after 60 min. Control wells included in each plate contained PBS and fluoregenic peptide..
Sandwich ELISA measurement of Aβ
3 ml of SH-SY5Y and H4 APP695wt cells suspensions were seeded into 6-well plates. The cells were then allowed to grow to confluence (resting phase). The medium in each well was replaced with 1 ml of the appropriate fresh media and treated with 5, 10 and 20 μM HNE for 24 h after which the media were collected. Sandwich ELISAs for the detection of Aβ was performed according to the protocol provided by manufacturer (Biosource). In brief, 50 μl of Aβ peptide standards, controls and dilutions of samples were added into wells pre-coated with primary antibody specific for the NH2-terminus of Human Aβ (capture antibody) and allowed to incubate overnight at 4°C. 50 μl/well of secondary (detection) antibody was allowed to bind 4 h at room temperature. After 4 washes with buffer, 100 μl/well anti-rabbit Ig’s-HRP solution was added and continuously incubated for 30 min at room temperature. Developing was performed using stabilized chromogen (TMB) and the reaction stopped by the addition of 100 μl of stop solution. Plates were read at 450 nm in a SpectraMax Plus spectrophotometer (Molecular Devices) and analyzed by SOFTmax® PRO software. Aβ values in the unknowns were calculated by comparison to the values obtained for the synthetic Aβ standards analyzed on the same plate.
Statistical analysis
All results are given as mean ± SEM. Statistical analyses were performed with One-way ANOVA followed by least significant difference post hoc analysis (multiple comparisons) and t-test with threshold of P < 0.05.
Results
HNE and Aβ treatment induce NEP modification
First we evaluated the effects of HNE and Aβ on intracellular NEP mRNA and protein expression. Vehicle, HNE or Aβ treated SH-SY5Y cells were analyzed by real-time PCR analysis for NEP mRNA. Cells exposed to HNE (5 and 10 μM) for 6 hours showed a marked reduction in NEP expression, which rebounded after 12 hours (Figure 1A). Treatment for 6 hours with Aβ had no effect, but significantly up-regulated NEP mRNA expression at 12 hours (Figure 1B). NEP protein levels as determined by western blotting displayed no change after HNE treatments, but significantly increased (P < 0.05) in Aβ1-42-treated cells (Figure 2).
Figure 1.

NEP mRNA is altered in SH-SY5Y cells after HNE and Aβ1-42. SH-SY5Y cells were untreated or treated with HNE (5, 10 μM) (Panel A) or Aβ1-42 (1, 2 μM) (Panel B) for 6 and 12 hours, respectively. Total RNA were analyzed by real-time PCR and normalized to S26 mRNA levels. Shown are means ± SEM of relative mRNA level. #, * represent P < 0.05 versus control at same time points.
Figure 2.

NEP shows variable changes after HNE or Aβ1-42. After incubation with vehicle, HNE (5 and 10 μM) or Aβ (1 and 2 μM) for 24 h, SH-SY5Y cells were harvested and equal amounts of protein were western blotted. (A) is a representative western blot. (B) is quantification of 3 independent experiments. *P < 0.05 compared to vehicle-treated control.
In order to determine if HNE-modification to NEP occurred in the cultured SH-SY5Y cells treated with HNE or Aβ1-42, NEP protein was immunoprecipitated with rabbit polyclonal anti-NEP antibody followed by western blot with an anti-HNE and anti-NEP antibody respectively (Figure 3). The data suggests that NEP was modified by HNE in both HNE- and Aβ-treated cells (Figure 3A). Quantification showed that NEP in HNE-treated cells was similar to the control, but approximately 60% higher in Aβ-treated cell. HNE levels in both HNE- and Aβ-treated cell were about 200% higher than in control. The ratio of HNE to NEP was 180% and 140% higher to control respectively after HNE and Aβ-treated cell (Figure 3B).
Figure 3.

NEP shows HNE adduction after HNE or Aβ1-42 treatment. (A) SH-SY5Y cells were incubated with HNE and Aβ1-42 for 24 h. Cell lysates were prepared and immunoprecipitated with monoclonal anti-NEP antibody. Immunoprecipitates were analyzed by immunoblotting with the polyclonal HNE and NEP antibodies. CON, vehicle control; HNE (10 μM); Aβ1-42 (1 μM). (B) Immunoblots quantification of 3 independent experiments. * P < 0.05, ** P < 0.01 compared to vehicle-treated control. The results are representative of three independent replicates. Values are the mean ± SEM expressed as the percentage of control value. C, vehicle control; H, HNE (10 μM) treated; A, Aβ1-42 (1 μM) treated.
In order to determine the subcellular location of modified protein, we performed double fluorescence staining followed by confocal analysis of oxidatively stressed SH-SY5Y cells (Figure 4). HNE was undetectable in controls (Figure 4b) but positive in a punctal pattern both in HNE and Aβ treated cells (Figure 4e, h). Merged images revealed NEP and HNE colocalized in cells treated with HNE or Aβ (Figure 4f, i) consistent with the results observed after western blotting and immunoprecipitation. Therefore, NEP is modified by exogenously added or endogenously produced HNE induced by Aβ (Figure 4). Furthermore, these results suggest that SH-SY5Y cell is a valid system to study these events at a molecular level.
Figure 4.

NEP and HNE colocalize in oxidatively stressed SH-SY5Y cells. Cells were untreated (a–c), treated with 10 μM HNE (d–f) or 1 μM Aβ1-42 (g–i) for 24 h, prior to fixation and staining with anti-NEP (green) (a, d, g) or anti-HNE (red) (b, e, h) Colocalization was determined by confocal imaging (c, f, I) and is represented by yellow.
NEP activity is altered after HNE and Aβ treatment
Given the substantial adduction of NEP, we hypothesized its proteolytic activity would be attenuated. Therefore, NEP activity in lysates or intact SH-SY5Y cells treated for 24h was determined with a commercially available fluorogenic substrate. The activity assay was highly sensitive, linear over-time (up to 60 min examined, data not shown) and sensitive to the NEP inhibitor, thiorphan (data not shown). Treatment of cells with HNE led to a concentration dependent loss of total NEP activity, particularly in intact cells (Figure 5A). Specific NEP activity in cell lysates was decreased ~25% (P < 0.05) (data not shown) while intact cells showed up to a 50% reduction (Figure 5B). Despite adduction, samples treated with Aβ showed increased NEP activity (Figure 5C–D).
Figure 5.
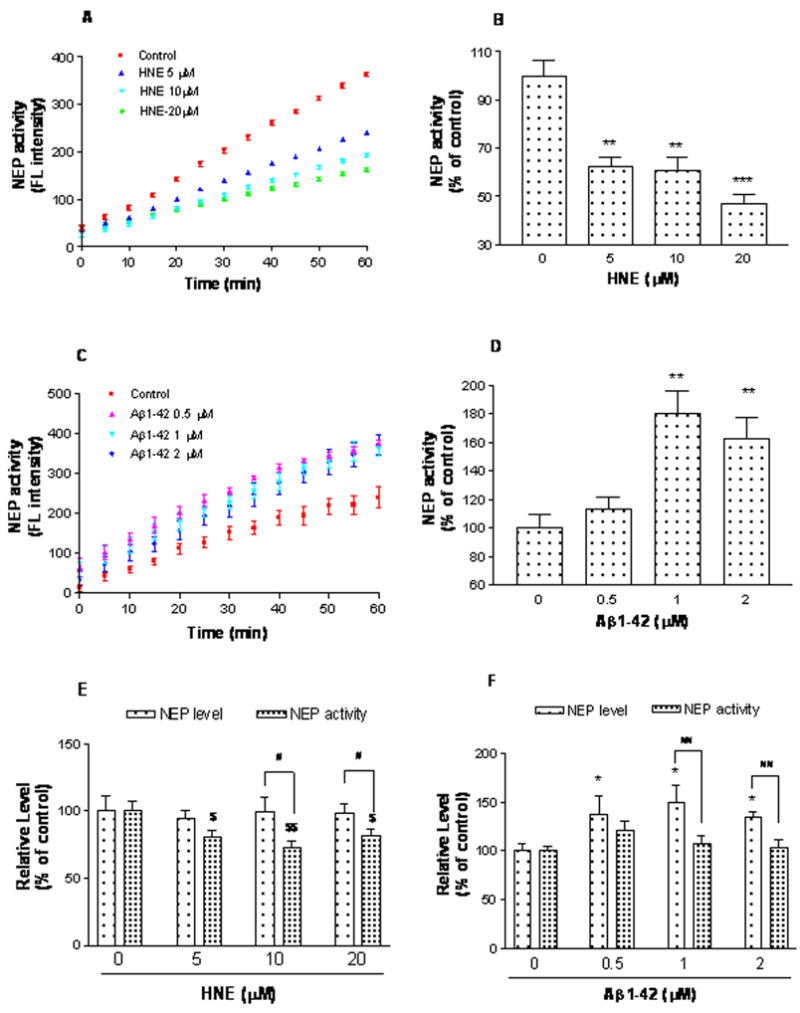
HNE or Aβ reduce NEP specific activity in SH-SY5Y cells. After 24 h incubation with vehicle, HNE (5, 10 and 20 μM) (A and B) or Aβ (0.5, 1 and 2 μM) (C and D), whole cells were harvested and NEP activity was analyzed for each group by Fluorescence Resonance Energy Transfer (FRET). Average NEP activity represented by fluorescence intensity was measured from 0 to 60 minutes with a reading interval of 5 minutes. Specific NEP activity was calculated by subtracting residual fluorescent intensity after incubation with the NEP inhibitor thiorphan. Values are the mean ± SEM expressed as the percentage of control value (B and D). Three independent experiments were performed in triplicate. * P < 0.05, ** P < 0.01, *** P < 0.001 vs control. E and F, HNE and Aβ decreased the specific NEP activity compared to its protein level determined using ELISA and immunocaptured NEP activity assay and compared in pairs. Two independent experiments were performed in triplicates. Values are expressed as mean ± SEM, presented as percentage of vehicle control. For NEP protein levels, * P < 0.05, ** P < 0.01 vs vehicle control (0 μM). For NEP specific activity, $ P < 0.05, $$ P < 0.01 vs vehicle control (0 μM). # P < 0.05, ## P < 0.01 for in-pairs comparation of NEP protein vs immunocaptured activity of same treatment (same concentration),
To further analyze these results, NEP activity was compared over a range of substrate concentrations (4–16μM) in SH-SY5Y cells. Activity was saturable, and followed Michealis-Menten kinetics in all cell lysates treated with vehicle, HNE and Aβ peptide. Lineweaver-Burk double-reciprocal plots of reaction velocities and substrate concentrations allowed calculation of the apparent Michaelis Constant (Km) for the enzyme in all samples (Table 1, KFigure 6). After HNE treatment, the m was significantly increased compared to control which implies that the enzyme affinity for substrate was decreased (Table 1). There was no significant effect on the Km (Table 1) at any of the three concentrations of Aβ. Vmax was unchanged after HNE but tended to increase after Aβ which likely reflects increased concentration of NEP.
Table 1.
Km and Vmax values alteration after treated by HNE and Aβ peptide in SH-SY5Y cells
| Treatments | Vmax (% of control) | Km (μM) |
|---|---|---|
| HNE (μM) | ||
| 0 | 99.99 ± 0.00a | 4.18 ± 1.29 |
| 5 | 102.1 ± 5.12 | 9.09 ± 3.65 |
| 10 | 106.42 ± 6.59 | 10.11 ± 4.59* |
| 20 | 111.78 ± 10.03 | 9.53 ± 4.38* |
|
| ||
| Aβ1-42 (μM) | ||
| 0 | 100 ± 0.00 | 4.14 ± 0.44 |
| 0.5 | 134.31 ± 31.40 | 4.30 ± 0.96 |
| 1 | 112.93 ± 23.70 | 4.24 ± 0.35 |
| 2 | 133.22 ± 15.61 | 4.75 ± 0.73 |
Data represent mean ± SEM. All assays were performed in duplicate for three to five independent experiments. Cells were treated with HNE (5, 10 and 20 μM) and Aβ1-42 (0.5, 1 and 2 μM) for 24 h.
Kinetics isotherms (Vmax and Km values) for NEP activity were determined by means of non-linear least squares fitting to the Michaelis-Menten equation using GraphPad Prim software.
Basal control value of Vmax was 2.016±1.233 μmol/min.
P < 0.05 vs control (0 μM of HNE).
Figure 6.
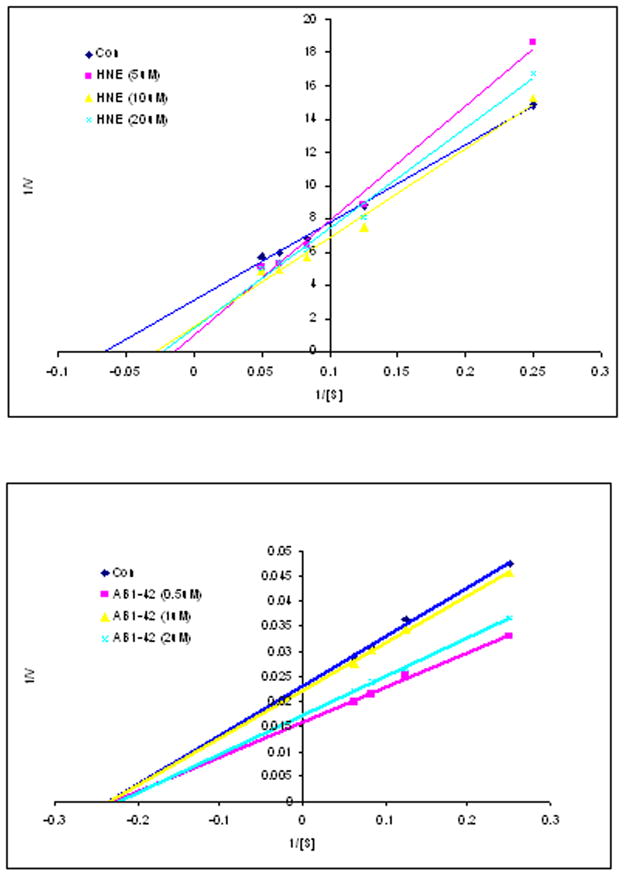
Lineweaver-Burk double-reciprocal plots in HNE and Aβ1-42 peptide treatment. The graphical plots were conducted at four different concentrations of the fluorogenic peptide substrate V (4–16 μM). Three to five independent experiments were carried out in duplicate.
The unexpected results from Aβ treatments prompted us to further explore the underlying mechanisms. Using NEP ELISA assay and immuno-captured activity approach, we measured and compared NEP protein level and specific NEP activity in the same samples and compared in pairs. NEP protein did not show obvious changes in HNE treated cells, but obviously increased in Aβ treatments. This conclusion is consistent with the moderate increases in NEP levels seen by immunoblot and immunofluorescence staining.
Consistent with the alteration of activity directly measured in cell lysates and intact cells, HNE at different concentration significantly lowered the NEP activity. In Aβ treated group, NEP activity showed moderate increase when compared to the vehicle control, but there was no statistical significance. However, the activities were all lower than protein levels when compare NEP protein and NEP activity in pairs (Figure 5E and F), which further confirmed the modification of NEP after HNE and Aβ treatments.
Aβ accumulates in the supernatant of SH-SY5Y and H4 APPwt cells after HNE treatment
The above results predict that oxidative inactivation of NEP would reduce Aβ catabolism. We tested this using SH-SY5Y and human H4 APPwt cells. The latter are stably transfected with human APP695 cDNA driven by a CMV promoter. As shown in Figure 7, HNE treatment over a range of concentrations increased Aβ levels in the supernatant of both cell lines. Similar effects were seen in H4 APPwt cells despite the much higher basal expression of Aβ (11.01 ± 0.33 pg/ml vs 59.18 ± 0.90 pg/ml).
Figure 7.
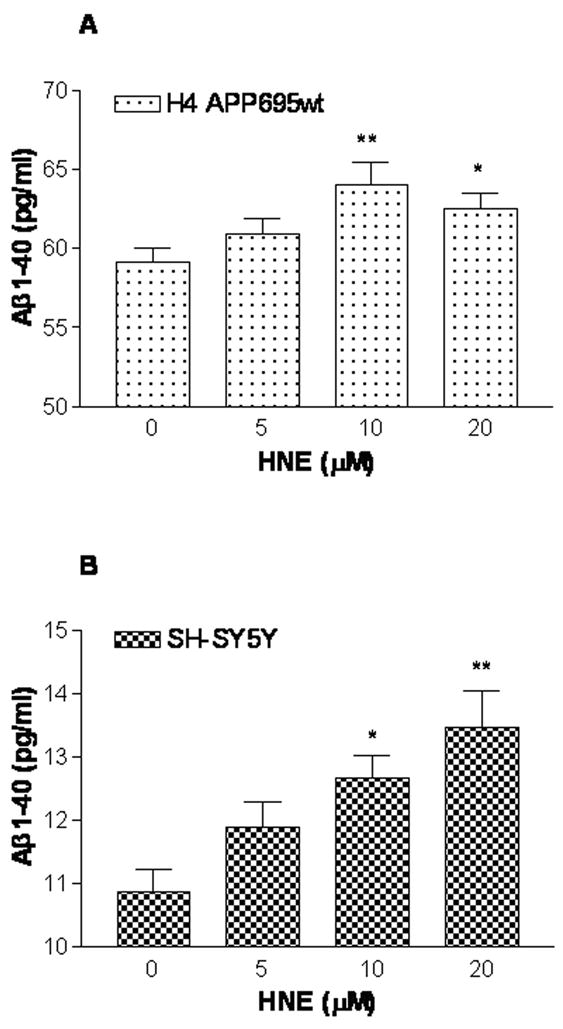
HNE treatment increases secreted Aβ1-40 by SH-SY5Y and H4 βAPP695wt cells. After 24 h treatment with 5–20 μM HNE, soluble, extracellular Aβ1-40 was measured by sandwich ELISA for H4 βAPP695wt (Panel A) and SH-SY5Y (Panel B) cell lines, respectively. Three independent experiments were performed in duplicate. Data are expressed as mean ± SEM. * P < 0.05, ** P < 0.01 vs control (0 μM).
Discussion
The formation of HNE is initiated by oxidative stress and culminates in membrane lipid, DNA and protein peroxidation. The HNE–macromolecular adducts are abundant in the brain of patients with AD consistent with a role for oxidative damage in disease pathogenesis (Sayre et al. 1997; Ando et al. 1998; Takeda et al. 2000). NEP is clearly one of the targets of HNE mediated modification in AD brain which likely contributed to accelerated NEP catabolism and reduced levels compared to controls (Wang et al. 2003). The data also suggested that dysregulated NEP function may compromise Aβ degradation. However, as AD typically develops over decades, the data from post-mortem samples provides little mechanistic insights into how HNE or Aβ can alter NEP. Recently, Shinall et al. reported that recombinant NEP could be oxidatively inactivated (Shinall et al. 2005), which prompted us to explore whether HNE or Aβ could inactivate NEP in cultured cells. The data in this study show that exogenous HNE mediates NEP modification in a concentration-dependent manner which is associated with increased Aβ accumulation in culture media. These results, along with prior analysis of human brain tissue, implicate NEP oxidation as a possible cause of Aβ accumulation in AD brain.
Real-time RT-PCR indicated that NEP mRNA level was down-regulated at 6 hour which rebounded by 12 hours after HNE treatment. Western blotting did not show statistically significant changes in NEP protein levels. These data imply that NEP mRNA expression is more sensitive than protein to HNE treatment. The up-regulation of NEP mRNA may reflect compensation to reduced NEP (protein levels and catalytical activity) induced by HNE modifications. In addition, the non-significant alteration of NEP protein level at 24 h after HNE treatment may also reflect the consequences of up-regulation of NEP mRNA. These results suggest that NEP has a prolonged, in vitro half-life (>12h) and that NEP gene expression is sensitive to both HNE and Aβ, but in temporally distinct ways.
We also evaluated if HNE adduction altered NEP activity. Vmax, and Km revealed that NEP activity in SH-SY5Y cells followed Michealis-Menten kinetics, and demonstrated a hyperbolic dependence of v (velocity) on substrate concentration. The Km of NEP after HNE treatment of cell lysates was significantly increased when compared to control (Table 1), which implies that substrate affinity was decreased. The Vmax was unchanged in HNE incubated cells compared to controls, consistent with unchanged NEP concentration. The Lineweaver-Burk double-reciprocal plots are consistent with competitive inhibition by exogenous HNE treatment (data not shown). Overall, these kinetic parameters suggest a loss of enzymatic activity after HNE adduction, possibly by HNE mediated active site modification.
Unlike HNE treatment, Aβ up-regulated both NEP mRNA and protein levels (Figure 1B and Figure 2). Despite increased HNE adduction, there were no significant differences in NEP Km between control and Aβ peptide-treated cells (Table 1). However, Vmax tended to increase in the Aβ treated groups. These results are consistent with the double-reciprocal plots of Aβ versus HNE treated cells (Figure 6). Alternatively, Aβ induced HNE modifies NEP at a different intracellular location than exogenous HNE, accounting for dissimilar changes in enzymatic activity. Despite these differences, the specific activity of NEP showed reductions after either HNE or Aβ treatments. Detection of NEP protein and activity from the same samples by using ELISA and immunocaptured activity assay indicated that NEP activities are lower than the protein levels not only in HNE but also in Aβ treatments, even though Aβ actually increased the NEP protein level. The results are thus consistent with the in vivo inactivation of NEP observed in AD (Russo et al, 2005; Sakai et al, 2004). At this time, the mechanism for NEP upregulation is unknown. Whether this occurs early in vivo during early, evolving AD is also unknown. Since there are total of 70 amino acid residues including cysteine (C) (Esterbauer et al. 1991), histidine (H) (Uchida and Stadtman 1992, 1993) and lysine (K) (Szweda et al. 1993; Uchida and Stadtman 1993) in NEP could potentially be modified by HNE, it is very likely that synthetic HNE added to the cultured medium, which is at much higher concentrations, and HNE induced by Aβ1-42 modified NEP at the different percentage of the total NEP protein in any single cell. It is also possible that a single NEP molecule could be modified at the different extent under different pathophysiological conditions, which may affect NEP’s activity at the different level. There are several ongoing studies to explore this question in this laboratory.
Previous studies indicated that Aβ increase the production of free radicals by neurons (Butterfield et al. 2001; Butterfield and Lauderback 2002; Canevari et al. 2004; Crouch et al. 2008). Consistent with previous reports (Mark et al. 1997), we also show that Aβ induced HNE production within 24 hours. As seen with exogenous HNE treatment, Aβ increased HNE-NEP conjugates as measured by immunoprecipitation - western blotting and double immunofluorescence staining. Interestingly, acute treatment with Aβ peptide significantly induced NEP mRNA and protein, which was different from the findings in AD brain (Sakai et al. 2004; Russo et al. 2005). In AD transgenic mice (TgCRND8), which overexpress human mutant APP (KM670/671NL+V717F), Aβ deposition correlated with total neprilysin immunoreactivity. While the relative NEP signals were generally greater in the transgenic than in control mice, NEP was localized to and surrounded a subpopulation of plaques (Sato et al. 1991). This suggests that NEP may be induced as a consequence of Aβ deposition as we observed here in vitro. Similarly, human postmortem brains showed slightly increased total NEP in mild cognitive impairment (MCI) compared to age-matched normal control (Wang et al. 2003; Wang et al. 2005). Results from this study showed that specific NEP activities were lower in both HNE- and Aβ-treated cells, and indicated that oxidative modifications demonstrated by the increased ratio of HNE/NEP, decreased Aβ-catabolic activity might be contribute, at least partly, to the reduced Aβ cleavage and enhanced accumulation during the AD pathogenesis. The experiments on cell viability after the treatments with increasing concentrations of HNE or Aβ performed along with other experiments reported in this manuscripts showed that there was a significant decrease in overall cell and neurite number as the concentration of HNE or Aβ was increased. The cells lost neurites, rounded and detached from the plate. Cell viability as determined by MTT reduction was markedly decreased after exposure to HNE or Aβ, consistent with cell death (data not shown). Although both HNE and Aβ are known to be toxic to cultured neuronal cells, it is possible that other mechanisms also involved in neuronal cell death induced by Aβ in addition to the induction of HNE.
Acknowledgments
This work is supported by NIH grants AG025722 and AG029972 (to DSW), and an Alzheimer Association Grant IIRG-08-90524 (to DSW), and the start fund from the Department of Pathology and Laboratory Medicine, University of Wisconsin and Public Health, Madison, Wisconsin (to DSW).
References
- Ando Y, Brannstrom T, Uchida K, Nyhlin N, Nasman B, Suhr O, Yamashita T, Olsson T, El Salhy M, Uchino M, Ando M. Histochemical detection of 4-hydroxynonenal protein in Alzheimer amyloid. J Neurol Sci. 1998;156:172–176. doi: 10.1016/s0022-510x(98)00042-2. [DOI] [PubMed] [Google Scholar]
- Apelt J, Ach K, Schliebs R. Aging-related down-regulation of neprilysin, a putative beta-amyloid-degrading enzyme, in transgenic Tg2576 Alzheimer-like mouse brain is accompanied by an astroglial upregulation in the vicinity of beta-amyloid plaques. Neurosci Lett. 2003;339:183–186. doi: 10.1016/s0304-3940(03)00030-2. [DOI] [PubMed] [Google Scholar]
- Bard F, Cannon C, Barbour R, Burke RL, Games D, Grajeda H, Guido T, Hu K, Huang J, Johnson-Wood K, Khan K, Kholodenko D, Lee M, Lieberburg I, Motter R, Nguyen M, Soriano F, Vasquez N, Weiss K, Welch B, Seubert P, Schenk D, Yednock T. Peripherally administered antibodies against amyloid beta-peptide enter the central nervous system and reduce pathology in a mouse model of Alzheimer disease. Nat Med. 2000;6:916–919. doi: 10.1038/78682. [DOI] [PubMed] [Google Scholar]
- Butterfield DA, Lauderback CM. Lipid peroxidation and protein oxidation in Alzheimer’s disease brain: potential causes and consequences involving amyloid beta-peptide-associated free radical oxidative stress. Free radical biology & medicine. 2002;32:1050–1060. doi: 10.1016/s0891-5849(02)00794-3. [DOI] [PubMed] [Google Scholar]
- Butterfield DA, Drake J, Pocernich C, Castegna A. Evidence of oxidative damage in Alzheimer’s disease brain: central role for amyloid beta-peptide. Trends Mol Med. 2001;7:548–554. doi: 10.1016/s1471-4914(01)02173-6. [DOI] [PubMed] [Google Scholar]
- Caccamo A, Oddo S, Sugarman MC, Akbari Y, LaFerla FM. Age- and region-dependent alterations in Abeta-degrading enzymes: implications for Abeta-induced disorders. Neurobiol Aging. 2005;26:645–654. doi: 10.1016/j.neurobiolaging.2004.06.013. [DOI] [PubMed] [Google Scholar]
- Canevari L, Abramov AY, Duchen MR. Toxicity of amyloid beta peptide: tales of calcium, mitochondria, and oxidative stress. Neurochem Res. 2004;29:637–650. doi: 10.1023/b:nere.0000014834.06405.af. [DOI] [PubMed] [Google Scholar]
- Carson JA, Turner AJ. Beta-amyloid catabolism: roles for neprilysin (NEP) and other metallopeptidases? J Neurochem. 2002;81:1–8. doi: 10.1046/j.1471-4159.2002.00855.x. [DOI] [PubMed] [Google Scholar]
- Crouch PJ, Harding SM, White AR, Camakaris J, Bush AI, Masters CL. Mechanisms of A beta mediated neurodegeneration in Alzheimer’s disease. Int J Biochem Cell Biol. 2008;40:181–198. doi: 10.1016/j.biocel.2007.07.013. [DOI] [PubMed] [Google Scholar]
- David DC, Hauptmann S, Scherping I, Schuessel K, Keil U, Rizzu P, Ravid R, Drose S, Brandt U, Muller WE, Eckert A, Gotz J. Proteomic and functional analyses reveal a mitochondrial dysfunction in P301L tau transgenic mice. The Journal of biological chemistry. 2005;280:23802–23814. doi: 10.1074/jbc.M500356200. [DOI] [PubMed] [Google Scholar]
- Eckman EA, Eckman CB. Abeta-degrading enzymes: modulators of Alzheimer’s disease pathogenesis and targets for therapeutic intervention. Biochem Soc Trans. 2005;33:1101–1105. doi: 10.1042/BST20051101. [DOI] [PubMed] [Google Scholar]
- El-Amouri SS, Zhu H, Yu J, Gage FH, Verma IM, Kindy MS. Neprilysin protects neurons against Abeta peptide toxicity. Brain Res. 2007;1152:191–200. doi: 10.1016/j.brainres.2007.03.072. [DOI] [PMC free article] [PubMed] [Google Scholar]
- Esterbauer H, Schaur RJ, Zollner H. Chemistry and biochemistry of 4-hydroxynonenal, malonaldehyde and related aldehydes. Free radical biology & medicine. 1991;11:81–128. doi: 10.1016/0891-5849(91)90192-6. [DOI] [PubMed] [Google Scholar]
- Farrer M, Kachergus J, Forno L, Lincoln S, Wang DS, Hulihan M, Maraganore D, Gwinn-Hardy K, Wszolek Z, Dickson D, Langston JW. Comparison of kindreds with parkinsonism and alpha-synuclein genomic multiplications. Ann Neurol. 2004;55:174–179. doi: 10.1002/ana.10846. [DOI] [PubMed] [Google Scholar]
- Forman MS, Trojanowski JQ, Lee VM. Neurodegenerative diseases: a decade of discoveries paves the way for therapeutic breakthroughs. Nat Med. 2004;10:1055–1063. doi: 10.1038/nm1113. [DOI] [PubMed] [Google Scholar]
- Frautschy SA, Yang F, Calderon L, Cole GM. Rodent models of Alzheimer’s disease: rat A beta infusion approaches to amyloid deposits. Neurobiol Aging. 1996;17:311–321. doi: 10.1016/0197-4580(95)02073-x. [DOI] [PubMed] [Google Scholar]
- Hardy J. Amyloid, the presenilins and Alzheimer’s disease. Trends Neurosci. 1997;20:154–159. doi: 10.1016/s0166-2236(96)01030-2. [DOI] [PubMed] [Google Scholar]
- Hardy J, Selkoe DJ. The amyloid hypothesis of Alzheimer’s disease: progress and problems on the road to therapeutics. Science. 2002;297:353–356. doi: 10.1126/science.1072994. [DOI] [PubMed] [Google Scholar]
- Harman D. Free radical involvement in aging. Pathophysiology and therapeutic implications. Drugs Aging. 1993;3:60–80. doi: 10.2165/00002512-199303010-00006. [DOI] [PubMed] [Google Scholar]
- Higuchi M, Iwata N, Saido TC. Understanding molecular mechanisms of proteolysis in Alzheimer’s disease: progress toward therapeutic interventions. Biochim Biophys Acta. 2005;1751:60–67. doi: 10.1016/j.bbapap.2005.02.013. [DOI] [PubMed] [Google Scholar]
- Iwata N, Takaki Y, Fukami S, Tsubuki S, Saido TC. Region-specific reduction of A beta-degrading endopeptidase, neprilysin, in mouse hippocampus upon aging. J Neurosci Res. 2002;70:493–500. doi: 10.1002/jnr.10390. [DOI] [PubMed] [Google Scholar]
- Iwata N, Tsubuki S, Takaki Y, Shirotani K, Lu B, Gerard NP, Gerard C, Hama E, Lee HJ, Saido TC. Metabolic regulation of brain Abeta by neprilysin. Science. 2001;292:1550–1552. doi: 10.1126/science.1059946. [DOI] [PubMed] [Google Scholar]
- Iwata N, Mizukami H, Shirotani K, Takaki Y, Muramatsu S, Lu B, Gerard NP, Gerard C, Ozawa K, Saido TC. Presynaptic localization of neprilysin contributes to efficient clearance of amyloid-beta peptide in mouse brain. J Neurosci. 2004;24:991–998. doi: 10.1523/JNEUROSCI.4792-03.2004. [DOI] [PMC free article] [PubMed] [Google Scholar]
- Johnson GD, Ahn K. Development of an internally quenched fluorescent substrate selective for endothelin-converting enzyme-1. Anal Biochem. 2000;286:112–118. doi: 10.1006/abio.2000.4772. [DOI] [PubMed] [Google Scholar]
- Kowall NW, McKee AC, Yankner BA, Beal MF. In vivo neurotoxicity of beta-amyloid [beta(1–40)] and the beta(25–35) fragment. Neurobiol Aging. 1992;13:537–542. doi: 10.1016/0197-4580(92)90053-z. [DOI] [PubMed] [Google Scholar]
- Mark RJ, Lovell MA, Markesbery WR, Uchida K, Mattson MP. A role for 4-hydroxynonenal, an aldehydic product of lipid peroxidation, in disruption of ion homeostasis and neuronal death induced by amyloid beta-peptide. J Neurochem. 1997;68:255–264. doi: 10.1046/j.1471-4159.1997.68010255.x. [DOI] [PubMed] [Google Scholar]
- Marr RA, Guan H, Rockenstein E, Kindy M, Gage FH, Verma I, Masliah E, Hersh LB. Neprilysin regulates amyloid Beta peptide levels. J Mol Neurosci. 2004;22:5–11. doi: 10.1385/JMN:22:1-2:5. [DOI] [PubMed] [Google Scholar]
- Montine TJ, Amarnath V, Martin ME, Strittmatter WJ, Graham DG. E-4-hydroxy-2-nonenal is cytotoxic and cross-links cytoskeletal proteins in P19 neuroglial cultures. Am J Pathol. 1996;148:89–93. [PMC free article] [PubMed] [Google Scholar]
- Nunomura A, Chiba S, Lippa CF, Cras P, Kalaria RN, Takeda A, Honda K, Smith MA, Perry G. Neuronal RNA oxidation is a prominent feature of familial Alzheimer’s disease. Neurobiol Dis. 2004;17:108–113. doi: 10.1016/j.nbd.2004.06.003. [DOI] [PubMed] [Google Scholar]
- Nunomura A, Perry G, Aliev G, Hirai K, Takeda A, Balraj EK, Jones PK, Ghanbari H, Wataya T, Shimohama S, Chiba S, Atwood CS, Petersen RB, Smith MA. Oxidative damage is the earliest event in Alzheimer disease. J Neuropathol Exp Neurol. 2001;60:759–767. doi: 10.1093/jnen/60.8.759. [DOI] [PubMed] [Google Scholar]
- Olanow CW. A radical hypothesis for neurodegeneration. Trends Neurosci. 1993;16:439–444. doi: 10.1016/0166-2236(93)90070-3. [DOI] [PubMed] [Google Scholar]
- Pike CJ, Walencewicz-Wasserman AJ, Kosmoski J, Cribbs DH, Glabe CG, Cotman CW. Structure-activity analyses of beta-amyloid peptides: contributions of the beta 25–35 region to aggregation and neurotoxicity. J Neurochem. 1995;64:253–265. doi: 10.1046/j.1471-4159.1995.64010253.x. [DOI] [PubMed] [Google Scholar]
- Pratico D, V MYL, Trojanowski JQ, Rokach J, Fitzgerald GA. Increased F2-isoprostanes in Alzheimer’s disease: evidence for enhanced lipid peroxidation in vivo. Faseb J. 1998;12:1777–1783. doi: 10.1096/fasebj.12.15.1777. [DOI] [PubMed] [Google Scholar]
- Russo R, Borghi R, Markesbery W, Tabaton M, Piccini A. Neprylisin decreases uniformly in Alzheimer’s disease and in normal aging. FEBS Lett. 2005;579:6027–6030. doi: 10.1016/j.febslet.2005.09.054. [DOI] [PubMed] [Google Scholar]
- Saido TC, Iwata N. Metabolism of amyloid beta peptide and pathogenesis of Alzheimer’s disease. Towards presymptomatic diagnosis, prevention and therapy. Neurosci Res. 2006;54:235–253. doi: 10.1016/j.neures.2005.12.015. [DOI] [PubMed] [Google Scholar]
- Sakai A, Ujike H, Nakata K, Takehisa Y, Imamura T, Uchida N, Kanzaki A, Yamamoto M, Fujisawa Y, Okumura K, Kuroda S. Association of the Neprilysin gene with susceptibility to late-onset Alzheimer’s disease. Dement Geriatr Cogn Disord. 2004;17:164–169. doi: 10.1159/000076351. [DOI] [PubMed] [Google Scholar]
- Sato M, Ikeda K, Haga S, Allsop D, Ishii T. A monoclonal antibody to common acute lymphoblastic leukemia antigen (neutral endopeptidase) immunostains senile plaques in the brains of patients with Alzheimer’s disease. Neurosci Lett. 1991;121:271–273. doi: 10.1016/0304-3940(91)90702-u. [DOI] [PubMed] [Google Scholar]
- Sayre LM, Zelasko DA, Harris PL, Perry G, Salomon RG, Smith MA. 4-Hydroxynonenal-derived advanced lipid peroxidation end products are increased in Alzheimer’s disease. J Neurochem. 1997;68:2092–2097. doi: 10.1046/j.1471-4159.1997.68052092.x. [DOI] [PubMed] [Google Scholar]
- Schuessel K, Schafer S, Bayer TA, Czech C, Pradier L, Muller-Spahn F, Muller WE, Eckert A. Impaired Cu/Zn-SOD activity contributes to increased oxidative damage in APP transgenic mice. Neurobiol Dis. 2005;18:89–99. doi: 10.1016/j.nbd.2004.09.003. [DOI] [PubMed] [Google Scholar]
- Selkoe DJ. Alzheimer’s disease: genes, proteins, and therapy. Physiol Rev. 2001;81:741–766. doi: 10.1152/physrev.2001.81.2.741. [DOI] [PubMed] [Google Scholar]
- Shi Q, Gibson GE. Oxidative stress and transcriptional regulation in Alzheimer disease. Alzheimer Dis Assoc Disord. 2007;21:276–291. doi: 10.1097/WAD.0b013e31815721c3. [DOI] [PMC free article] [PubMed] [Google Scholar]
- Shinall H, Song ES, Hersh LB. Susceptibility of amyloid Beta Peptide degrading enzymes to oxidative damage: a potential Alzheimer’s disease spiral. Biochemistry. 2005;44:15345–15350. doi: 10.1021/bi050650l. [DOI] [PubMed] [Google Scholar]
- Smith CD, Carney JM, Starke-Reed PE, Oliver CN, Stadtman ER, Floyd RA, Markesbery WR. Excess brain protein oxidation and enzyme dysfunction in normal aging and in Alzheimer disease. Proceedings of the National Academy of Sciences of the United States of America. 1991;88:10540–10543. doi: 10.1073/pnas.88.23.10540. [DOI] [PMC free article] [PubMed] [Google Scholar]
- Smith MA, Sayre LM, Monnier VM, Perry G. Radical AGEing in Alzheimer’s disease. Trends Neurosci. 1995;18:172–176. doi: 10.1016/0166-2236(95)93897-7. [DOI] [PubMed] [Google Scholar]
- Smith MA, Rottkamp CA, Nunomura A, Raina AK, Perry G. Oxidative stress in Alzheimer’s disease. Biochim Biophys Acta. 2000;1502:139–144. doi: 10.1016/s0925-4439(00)00040-5. [DOI] [PubMed] [Google Scholar]
- Szweda LI, Uchida K, Tsai L, Stadtman ER. Inactivation of glucose-6-phosphate dehydrogenase by 4-hydroxy-2-nonenal. Selective modification of an active-site lysine. The Journal of biological chemistry. 1993;268:3342–3347. [PubMed] [Google Scholar]
- Takeda A, Smith MA, Avila J, Nunomura A, Siedlak SL, Zhu X, Perry G, Sayre LM. In Alzheimer’s disease, heme oxygenase is coincident with Alz50, an epitope of tau induced by 4-hydroxy-2-nonenal modification. J Neurochem. 2000;75:1234–1241. doi: 10.1046/j.1471-4159.2000.0751234.x. [DOI] [PubMed] [Google Scholar]
- Turner AJ, Fisk L, Nalivaeva NN. Targeting amyloid-degrading enzymes as therapeutic strategies in neurodegeneration. Ann N Y Acad Sci. 2004;1035:1–20. doi: 10.1196/annals.1332.001. [DOI] [PubMed] [Google Scholar]
- Uchida K, Stadtman ER. Modification of histidine residues in proteins by reaction with 4-hydroxynonenal. Proceedings of the National Academy of Sciences of the United States of America. 1992;89:4544–4548. doi: 10.1073/pnas.89.10.4544. [DOI] [PMC free article] [PubMed] [Google Scholar]
- Uchida K, Stadtman ER. Covalent attachment of 4-hydroxynonenal to glyceraldehyde-3-phosphate dehydrogenase. A possible involvement of intra- and intermolecular cross-linking reaction. The Journal of biological chemistry. 1993;268:6388–6393. [PubMed] [Google Scholar]
- Varadarajan S, Yatin S, Aksenova M, Butterfield DA. Review: Alzheimer’s amyloid beta-peptide-associated free radical oxidative stress and neurotoxicity. J Struct Biol. 2000;130:184–208. doi: 10.1006/jsbi.2000.4274. [DOI] [PubMed] [Google Scholar]
- Vardy ER, Catto AJ, Hooper NM. Proteolytic mechanisms in amyloid-beta metabolism: therapeutic implications for Alzheimer’s disease. Trends Mol Med. 2005;11:464–472. doi: 10.1016/j.molmed.2005.08.004. [DOI] [PubMed] [Google Scholar]
- Wang DS, Dickson DW, Malter JS. beta-Amyloid Degradation and Alzheimer’s Disease. J Biomed Biotechnol. 2006;2006:58406. doi: 10.1155/JBB/2006/58406. [DOI] [PMC free article] [PubMed] [Google Scholar]
- Wang DS, Dickson DW, Malter JS. Tissue Transglutaminase, Protein Cross-linking and Alzheimer’s Disease: Review and Views. Int J Clin Exp Pathol. 2008;1:5–18. [PMC free article] [PubMed] [Google Scholar]
- Wang DS, Iwata N, Hama E, Saido TC, Dickson DW. Oxidized neprilysin in aging and Alzheimer’s disease brains. Biochem Biophys Res Commun. 2003;310:236–241. doi: 10.1016/j.bbrc.2003.09.003. [DOI] [PubMed] [Google Scholar]
- Wang DS, Lipton RB, Katz MJ, Davies P, Buschke H, Kuslansky G, Verghese J, Younkin SG, Eckman C, Dickson DW. Decreased neprilysin immunoreactivity in Alzheimer disease, but not in pathological aging. J Neuropathol Exp Neurol. 2005;64:378–385. doi: 10.1093/jnen/64.5.378. [DOI] [PubMed] [Google Scholar]
- Wang S, Simon BP, Bennett DA, Schneider JA, Malter JS, Wang DS. The significance of pin1 in the development of Alzheimer’s disease. J Alzheimers Dis. 2007;11:13–23. doi: 10.3233/jad-2007-11105. [DOI] [PubMed] [Google Scholar]
- Yankner BA, Duffy LK, Kirschner DA. Neurotrophic and neurotoxic effects of amyloid beta protein: reversal by tachykinin neuropeptides. Science. 1990;250:279–282. doi: 10.1126/science.2218531. [DOI] [PubMed] [Google Scholar]
- Yasojima K, McGeer EG, McGeer PL. Relationship between beta amyloid peptide generating molecules and neprilysin in Alzheimer disease and normal brain. Brain Res. 2001a;919:115–121. doi: 10.1016/s0006-8993(01)03008-6. [DOI] [PubMed] [Google Scholar]
- Yasojima K, Akiyama H, McGeer EG, McGeer PL. Reduced neprilysin in high plaque areas of Alzheimer brain: a possible relationship to deficient degradation of beta-amyloid peptide. Neurosci Lett. 2001b;297:97–100. doi: 10.1016/s0304-3940(00)01675-x. [DOI] [PubMed] [Google Scholar]