

Abstract
Objectives:
Magnetic resonance (MRI) studies rely on sulcal boundaries to delineate the human entorhinal cortex (EC) and typically show that EC size is reduced in Alzheimer's disease (AD) and a predictor of future dementia. However, it is unknown if variations in the EC sulcal patterns are associated with AD. We classified the lateral EC sulcal boundary as either a rhinal or collateral pattern and tested the hypotheses that the rhinal pattern was (1) more common in AD and (2) associated with a smaller EC size.
Experimental Design:
MRI was used to determine the prevalence of the rhinal and collateral EC patterns in 421 subjects (212 AD, 107 old normal (ONL), and 102 young NL (YNL). Anatomical validation studies of normal subjects were conducted at postmortem in 34 brain hemispheres and in vivo with 21 MRI volume studies. EC pattern reliability was studied with MRI in both cross‐sectional and longitudinal designs.
Principal Observations:
The rhinal pattern was more frequent in the right hemisphere in AD (47%) compared with ONL (28%, odds ratio = 2.25, P = 0.001). EC pattern was not related to ApoE genotype. The validations showed that the EC sulcal pattern was not associated with the neuronal number, surface area, or volume of the EC. In patients with antemortem MRI studied at postmortem it was equivalently determined, that EC patterns are reliably determined on MRI and do not change with the progressive atrophy of AD.
Conclusions:
The data indicate that the right hemisphere rhinal pattern is over represented in AD as compared with control. However, in normal subjects the EC rhinal pattern is not associated with a diminished EC tissue size. It remains to be demonstrated if the right EC rhinal sulcus pattern association with AD reflects genetic or developmental influences. Hum Brain Mapp, 2009. © 2008 Wiley‐Liss, Inc.
Keywords: Alzheimer's disease, entorhinal cortex, rhinal sulcus, collateral sulcus, postmortem, MRI, diagnosis
INTRODUCTION
Entorhinal cortex (EC) neuropathology, neuronal loss, and gross size reduction is an early feature of Alzheimer's disease (AD) (Braak and Braak, 1991; Bobinski et al., 1999) and important in the early imaging diagnosis of AD (de Leon et al., 2001; Goncharova et al., 2001; Juottonen et al., 1998). The EC is located in the anterior parahippocampal gyrus and is part of the hippocampal formation (Amaral and Insausti, 1990). Laterally adjacent to the EC is the perirhinal cortex (PRC) without a gross anatomical border between them. Imaging studies use sulcal landmarks to estimate the lateral boundary of the EC, the boundary at anterior levels is the rhinal sulcus (RS), and at posterior levels the collateral sulcus (CS) (Bobinski et al., 1999; de Leon et al., 2004; Insausti et al., 1995). However, it is widely acknowledged that there is considerable variability in the appearance and extent of these two sulci (Goncharova et al., 2001; Hanke, 1997; Insausti et al., 1995; Ono et al., 1990; Pruessner et al., 2002; Van Hoesen, 1995). On the basis of the descriptions by Ono et al., (Ono et al., 1990) we considered two major pattern types: a continuous rhinal‐collateral sulcus running the length of the EC and a discontinuous boundary type with an anterior rhinal sulcus and a separate and more posterio‐lateral collateral sulcus boundary. Our observations suggested that the “rhinal sulcus pattern” was overrepresented in AD, and that this feature could account for the often reported smaller EC surface areas or volumes in AD. However, neither the prevalence of EC sulcal patterns in AD nor the contribution of the EC pattern type to estimates of EC size had been previously examined. Our study was designed to test two hypotheses: (1) that the rhinal sulcus pattern is associated with the diagnosis of AD; and (2) in normal subjects the rhinal sulcus pattern is associated with both smaller EC size as measured in vivo with magnetic resonance (MRI) and at postmortem with fewer cell counts and smaller structure sizes.
MATERIALS AND METHODS
Subjects
Three groups of subjects were studied in cross‐section for a total n = 421. These included 212 AD patients (53–96 years), 107 old normal controls (ONL, 74–90 years), and 102 young normal (YNL, 19–40 years) subjects (see Table I). A postmortem anatomical validation study was conducted with 34 normal control hemispheres, aged from 4 to 102 years, (25 left and 9 right hemispheres). Reliability studies were performed with 54 cross‐sectional and a separate group of 54 longitudinal MRI studies (see later).
Table I.
Cross‐sectional study demographics grouped by diagnosis
| YNL (n = 102) | ONL (n = 107) | AD (n = 212) | |
|---|---|---|---|
| Gender—M/F (%F) | 51/51 (50) | 30/77 (72)* | 89/123 (58) |
| Age (years) | 28.2 ± 6.1** | 79.8 ± 3.8** | 76.8 ± 8.2 |
| Education (years) | 16.7 ± 2.2** | 15.5 ± 2.5** | 14.2 ± 3.2 |
| ApoE e4+/e4 (%e4+) | 33/42 (44) | 20/54 (27)** | 95/86 (52) |
| GDS score | 1.1 ± .4** | 1.9 ± .4** | 4.2 ± .5 |
| MMSE score | 29.4 ± .8** | 29.2 ± 1.0** | 24.3 ± 2.4 |
Values are the mean ± SD.
YNL, young normal; ONL, old normal; AD, Alzheimer's disease; ApoE, Apolipoprotein E; e4+, carrier; e4−, non‐carrier; GDS, Global Deterioration Scale; MMSE, Mini‐Mental State Examination.
Significantly different from AD P < 0.05.
Significantly different from AD P < 0.01.
All subjects were enrolled in the NIH supported NYU Alzheimer Disease Center (ADC). The clinical records and MRI scans were randomly selected from study archives in accordance with the inclusion and exclusion criteria (below). MRI scans were examined at the NYU Center for Brain Heath and the postmortem specimens at the ADC associated neuropathology laboratory at the Institute for Basic Research. All participants signed IRB approved consent for research study participation. Individuals with medical conditions or histories of significant conditions other than AD that could affect brain structure or cognition (e.g., stroke, insulin‐dependent diabetes, head trauma, other neurodegenerative disease, or normal pressure hydrocephalus) were excluded.
All subjects enrolled received the full diagnostic evaluation and the research group assignments were determined by an expert consensus panel that reviewed medical, neurological, psychiatric, neuropsychological, MRI, and laboratory studies. Apolipoprotein E genotype was also determined (Main et al., 1991) and carriers were distinguished as having one or two E4 alleles.
The level of cognitive functioning was determined on the basis of the Global Deterioration Scale (GDS) score (Reisberg et al., 1982), the Brief Clinical Rating Scale (BCRS) (Reisberg and Ferris, 1988), and the Mini‐mental State Examination (Folstein, 1983). NL subjects were identified as having no impairments in memory, concentration, orientation, language, executive function, and activities of daily life, as determined by detailed psychometric evaluation. Patients with mild cognitive impairment (MCI) were excluded from this study. MCI was identified following a clinical interview and discussion with a knowledgeable informant and defined on the basis of a change in the cognitive functioning of the patient in the absence of dementia, depression, or other medical causes of cognitive complaint. AD was defined using the definitions of the Diagnostic and Statistical Manual of Mental Disorders (DSM‐IV) criteria for dementia of the Alzheimer type and the National Institute of Neurological and Communicative Disorders and Stroke‐Alzheimer's Disease and Related Disorders Association (NINCDS‐ADRDA) criteria (McKhann et al., 1984). All investigators involved with MRI or postmortem analyses were blinded to the clinical diagnostic information. In the longitudinal MRI studies, the order of presentation of the materials was randomized.
Magnetic Resonance Imaging Acquisition Protocol
MRI scans were acquired on the same 1.5 T GE Signa imager (General Electric, Milwaukee, USA). All subjects received a diagnostic and a research MRI study. The diagnostic study was performed using contiguous 3 mm axial T2‐weighted and Fluid‐attenuated Inversion‐Recovery (FLAIR) images which are used to identify and exclude patients with either NPH or space occupying lesions. The research scan was a 124 slice T1‐weighted fast gradient‐echo acquired in a coronal orientation with a 1.3–1.7 mm slice thickness which encompasses the entire brain without gap or wrap artifact. (FOV = 25 cm, NEX = 1, matrix = 256 × 192, TR = 35 ms, TE = 9 ms and FA = 60°).
All file names were assigned sequential code numbers and image headers were stripped of demographic information. Images were transferred to our central image data bank and then to satellite Sun workstations for further processing. Image analysis was done using MIDAS software running on a UNIX operating system (Tsui et al., 2001).
Image Analysis
Image preprocessing
The original images were reformatted in one sinc interpolation step to a standard “pathological angle” coronal plane with a 1.5 mm slice thickness. The standard coronal plane was perpendicular to the plane running through the inferior surfaces of the frontal and occipital lobes and was designed to match the sections obtained at postmortem (Bobinski et al., 1999).
General MRI boundary definitions
EC sulcal terminology was based on the Ono (Ono et al., 1990) and Hanke (1997) descriptions and our prior MRI validation study of EC boundaries (Bobinski et al., 1999). The anterior limit of the EC was defined as 4.5 mm posterior to the frontal‐temporal junction (FTJ) or limen insulae; the posterior EC limit was demarcated by the anterior pole of the lateral geniculate body (LGB). Within these limits, we observed the presence and anterior to posterior transitional relationships between the rhinal and collateral sulci which mark the lateral (inferior) boundary. The lateral boundary was marked at the depth of the rhinal and collateral sulci.
At anterior levels, the medial (superior) boundary is the sulcus semianularis of the semilunar gyrus and posteriorly, (generally corresponding with the uncal sulcus of the pes hippocampus), the boundary was the medial extent of the dorsal curve of the parahippocampal gyrus.
Definition of the EC sulcal patterns on MRI
Over the anterior to posterior extent of the EC, when the lateral limit of the EC was formed by a continuous rhinal‐collateral sulcus, this was referred to as the rhinal pattern. When the two sulci were discontinuous, this was referred to as the collateral pattern (see Fig. 1).
Figure 1.
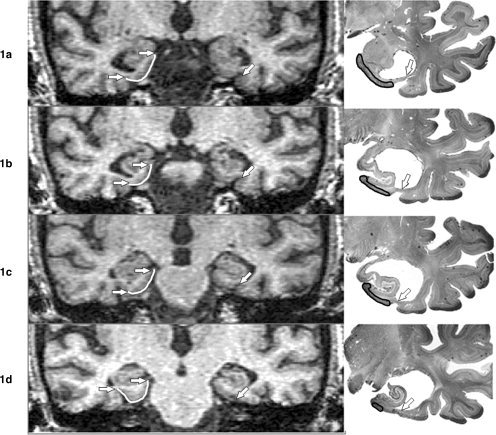
(a–d). Coronal In vivo T1‐Weighted MRI Images and corresponding coronal cresyl violet‐stained postmortem tissue sections of 78‐year‐old AD patient. The serial MRI images in the left column, depict the EC from anterior to posterior (top to bottom). A rhinal pattern can be observed in the left EC (right side of figure) and a collateral pattern is present in the right hemisphere. In the right hemisphere, white lines mark the EC surface and arrows indicate the medial and lateral EC boundaries. In the right hemisphere, the rhinal sulcus is present at anterior levels and terminates in 1c. After a discontinuity there is a collateral sulcus boundary in 1d, anterior to the lateral geniculate body. In the left hemisphere, the transition from rhinal to collateral sulcus is indistinguishable. The two sulci are continuous through the A‐P dimension (arrows). At postmortem, 2.25 mm cresyl violet‐stained histological sections from the left hemisphere were obtained from the same patient (right column). The serial histological sections like the MRI, demonstrate the continuous rhinal‐collateral sulcus pattern (arrows). The region of interest outlined with a black line shows the EC region as determined by histological criteria.
MRI‐EC surface area and volume estimation
The surface area was estimated as the sum across all coronal EC slices of the distances on the pial surface of the brain between the most medial and most lateral EC points. These end points were determined using the boundaries described earlier (Bobinski et al., 1999). The EC volume was estimated using the modified method of Killiany (Killiany et al., 2002). Briefly, the EC was manually outlined on three consecutive coronal MR images, centered at the level of the mamillary bodies. To normalize the MRI EC measurements, the total intradural‐supratentorial cranial volume was estimated using our previously published procedures (Bobinski et al., 1999).
EC Pattern Validation Studies
Three EC pattern validation studies were run. (1) 34 postmortem hemispheres from normal subjects aged from 4 to 102 years, (25 left and 9 right hemispheres) were examined for the relationships between the EC sulcal pattern type and EC volume, EC surface area (pial surface), total number of EC neurons, the number of layer 2 EC neurons, and the volume of the PRC. For these determinations, we used coronal cresyl violet‐stained histological sections spaced every 2.25 mm. For normalization of structure volume and surface area sizes estimated at postmortem, the fresh brain weight was used. The numbers of EC neurons were counted using the unbiased dissector method (West, 1993). Counting of cells with a nucleolus eliminated risk of inclusion of glial cells into the entorhinal cortex neuronal population. (2). For an in vivo ONL group (n = 21), using MRI, the EC surface area and volume measurements were examined in both hemispheres as a function of EC sulcal pattern type. (3). For 6 deceased AD patients with antemortem MRI, we examined the correspondence between the postmortem determined EC sulcal pattern using standardized digital photographs and the pattern observed with in vivo MRI (see Fig. 1).
EC Pattern Reliability Studies
Two reliability studies were conducted
(1) The longitudinal stability of the EC sulcal patterns in the presence of progressive brain atrophy was examined with MRI in a randomly selected group of 54 AD subjects (108 hemispheres). These AD patients underwent a follow‐up MRI study 3.7 ± 2.3 years after initial baseline scan. The baseline and follow‐up MRI scans were separately examined in random order; (2) Inter‐rater reliability was examined by randomly selecting from the ADC database 54 cross‐sectional scans from another cohort of ONL (n = 27) and AD (n = 27) subjects that were not included in the primary data analysis or the longitudinal reliability study. The raters were blinded to all clinical data and the presentation order of the MRI scans was randomized. Training of the second observer was conducted on materials that were not part of the primary or reliability data sets.
Statistics
Univariate and multivariate analyses of covariance (ANCOVA) with post hoc Tukey‐tests were used to examine the MRI, histological, and demographic data between the clinical groups. When necessary, demographic confounds were controlled for. Chi‐Square tests were used to examine the relationships between the sulcal pattern, diagnosis, gender, and APOE genotype. Cohen's kappa measure was used to examine the intra‐ and inter‐rater reliability. Logistic regression was used to examine the sulcal patterns and the EC surface area in the classification of the normal and AD groups. Results were considered significant at P < 0.05. All analyses were performed with SPSS 12.0 (SPSS, Chicago, IL 2004).
RESULTS
Cross‐Sectional Study Demographics
The demographic characteristics of the three study groups are shown in Table I. Significant age, education, ApoE genotype and gender distribution differences were noted between the ONL and AD groups and these were subsequently treated as confounds.
Prevalence of Sulcal Patterns
Over all subject groups, in the right hemisphere the collateral pattern was the most frequent EC sulcal pattern, present in 61% (256/421) of subjects. For the left hemisphere, there was no predominant EC pattern. The collateral pattern present in 48% of cases. Overall, there were no significant relationships between sulcal pattern by hemisphere, gender, or handedness (see Table II).
Table II.
Prevalence of EC sulcal patterns by handedness (% within group)
| Hemisphere/handedness | Left (%) | Right (%) | Ambidextrous (%) |
|---|---|---|---|
| Right hemisphere | |||
| Rhinal pattern | 6 | 84 | 10 |
| Collateral pattern | 5 | 86 | 10 |
| Left hemisphere | |||
| Rhinal pattern | 4 | 83 | 13 |
| Collateral pattern | 6 | 87 | 7 |
Comparison of AD with ONL subjects showed that a greater proportion of AD subjects (47%, 99/212) as compared with the ONL (28%, 30/107) had a rhinal pattern in the right hemisphere ([χ2 (1,319) = 10.28, P = 0.001], odds ratio = 2.25, 95% CI = 1.36–3.71, see Table III). The YNL subjects showed a rhinal pattern prevalence intermediate between the AD and ONL groups (35%, 36/102). Also as compared with YNL, the AD group demonstrated an increased prevalence of the right rhinal pattern ([χ2 (1,319) = 3.84, P = 0.05], odds ratio = 1.71, 95% CI = 0.997–2.923). No significant differences were found between YNL and ONL. For the left hemisphere, there were no group differences in the distributions of the sulcal pattern types.
Table III.
Prevalence (%) of EC sulcal patterns by hemisphere and group
| Hemisphere by pattern/group | YNL (n = 102) | ONL (n = 107) | AD (n = 212) |
|---|---|---|---|
| Right hemisphere | |||
| Rhinal pattern | 35 | 28 | 47 |
| Collateral pattern | 65 | 72 | 53 |
| Left hemisphere | |||
| Rhinal pattern | 53 | 47 | 53 |
| Collateral pattern | 47 | 52 | 46 |
After correcting for age, education, and gender, logistic regression analysis classifying AD and ONL showed that the right hemisphere EC sulcal pattern classified the AD and ONL groups with 68% sensitivity and 60% specificity, the overall accuracy was 65% [χ2 (1) = 10.7, P ≤ 0.01]. After age‐balancing the AD and ONL groups by limiting the sample to subjects >74 years, n = 155 AD, and n = 107 ONL subjects were retained for analysis. This selection had no effect on the rhinal sulcal frequencies. The results for the right and left hemispheres remained unchanged (right hemisphere: ONL: 28% and AD: 49%, χ2 = 11.6, P = 0.001 and left hemisphere: ONL: 48% and AD: 54%, χ2 = 0.9, ns).
Anatomical Validations
The results for the EC pattern validation studies are as follows: (1) For the 34 normal subjects studied at postmortem (25 left and 9 right hemispheres), no EC pattern differences were found for: EC neuron counts; EC layer 2 neuron counts; EC surface area; EC volume; or PRC volume (see Table IV). Sample sizes did not permit examination of hemisphere by pattern type interactions; (2) For the ONL group (n = 21) studied in vivo with MRI, the EC surface area and volume measurements did not differ between the two sulcal pattern types for either right or left hemisphere (P > 0.05; see Table V); (3) For 6 AD cases where EC patterns were determined at both at postmortem (4 left and 2 right hemispheres) and compared with those determined using in vivo MRI scans, there was 100% EC sulcal pattern agreement for 2 rhinal and 4 collateral patterns.
Table IV.
Post mortem EC neuron counts and surface area by sulcal pattern in NL
| Measurement/EC pattern | Rhinal pattern (n = 19) | Collateral pattern (n = 15) |
|---|---|---|
| Neuron counts (×106) | 21.2 ± 5.2 | 20.7 ± 5.0 |
| Layer 2 neuron counts (×106) | 1.3 ± .52 | 1.3 ± .41 |
| EC surface area (cm2) | 4.81 ± 2.56 | 5.27 ± 2.00 |
| EC volume (cm3) | 0.73 ± 0.21 | 0.67 ± 0.21 |
| PRC volume (cm3) | 0.60 ± 0.37 | 0.61 ± 0.27 |
| Brain weight (grams) | 1260 ± 160 | 1310 ± 176 |
Values are the mean ± SD.
Table V.
MRI‐EC surface area and volume by sulcal pattern in NL
| EC surface area (cm2) | EC volume (cm3) | |
|---|---|---|
| Right side | ||
| Rhinal pattern (n = 10) | 6.99 ± 2.40 | .21 ± .06 |
| Collateral pattern (n = 11) | 6.82 ± 1.52 | .20 ± .05 |
| Left side | ||
| Rhinal pattern (n = 12) | 6.76 ± 1.38 | .21 ± .05 |
| Collateral pattern (n = 9) | 6.11 ± .91 | .19 ± .02 |
Values are the mean ± SD.
APOE Effects
Over all study subjects, analysis of the APOE effects showed that there was no APOE effect on EC pattern prevalence in either hemisphere. Moreover, there were no significant interactions between study group membership (YNL, ONL, AD) and APOE carrier groups on the frequency of EC pattern types.
Reproducibility
For the 54 AD subjects with longitudinal MRI, the patterns at baseline (right rhinal: 48%, left rhinal: 61%) were essentially unchanged over the 4‐year follow‐up (right rhinal: 46% and left rhinal: 63%), 99%, κ = 0.98. The change in one subject presumably reflected the difficulty of ascertaining the anterior boundary of the LGB in the presence of head movement. For the sample of 54 AD patients studied at cross‐section, both intra‐rater and inter‐rater agreements for pattern type were high: (intra‐rater 107/108 hemispheres (99%), κ = 0.98) and (inter‐rater 98/108 (91%), κ = 0.80.
DISCUSSION
There is no known brain morphology variant associated with AD. In this study, we examined the prevalence of two EC sulcal patterns from the MRI scans of YNL, ONL, and AD patients. We report that the frequency of a continuous EC rhinal sulcal pattern in the right hemisphere is more prevalent in AD as compared with normal controls. Further, we demonstrate that the EC patterns are unrelated to the ApoE genotype or to dominant handedness, they are reliably determined, and the patterns do not change with progressive atrophy. Our quantitative MRI and postmortem validation studies showed that the EC patterns are not related to EC surface, volume or the number of EC neurons. Overall, these data suggest that a rhinal sulcal pattern in the right hemisphere is a possible risk factor for AD. However, the anatomical substrate and developmental basis of the added risk remains unknown.
Among healthy individuals there is an evidence of normal “right‐greater‐than‐left” medial temporal lobe (MTL) volume asymmetry (Mega et al., 2002). In AD, the left hemisphere particularly the left MTL and other cortical regions seems to be more vulnerable to atrophy (Rusinek et al., 2004; Thompson et al., 1998, 2001). It has been shown that among MCI subjects worse cognitive performance is associated with left hippocampal atrophy (Dickerson et al., 2004). Although our study did not attempt to characterize the laterality of the hippocampal formation atrophy associated with AD, speculatively, our finding may be consistent with the above observations. With the left hippocampal formation presumably affected earlier, the additional burden of a right hemisphere anatomical variation may further contribute to increased risk of expressing cognitive symptoms.
Coronal MRI images are commonly used to measure the EC size in AD (Petrella et al., 2003) as it is believed to be a site of early NFT pathology and tissue atrophy (Braak and Braak 1991). Based on prior postmortem validation studies, the MRI defined lateral margin of the EC is defined anteriorly by the rhinal sulcus and posteriorly by the collateral sulcus (Bobinski et al., 1999; Insausti et al., 1995). It is well known that there is variability in the patterns of the rhinal and collateral sulci (Goncharova et al., 2001; Hanke, 1997; Insausti et al., 1995; Ono et al., 1990; Pruessner et al., 2002; Van Hoesen, 1995). Specifically, some authors describe distinct rhinal and collateral sulci (Bobinski et al., 1999; Goncharova et al., 2001; Xu et al., 2000) and others define the sulci in the EC region as a double collateral sulcus (Insausti et al., 1995; Juottonen et al., 1998). The apparent discrepancy reflects naming of the posterior extent of the lateral boundary of the EC. However, despite different names, our classification relies on the continuity versus discontinuity of two sulci and is unaffected by the naming. Prior work has not examined whether the variability in the continuity of the rhinal and collateral sulci is associated with disease.
In a prior anatomical study, we demonstrated that the rhinal and collateral sulcal boundaries enable sampling of a region that is predominantly EC with some PRC tissue included. However, this rule caused uncertainty because in a pilot study, both the rhinal sulcal pattern and a smaller EC surface area were associated with an increased risk for decline (unpublished observation). Thus, we were unable to conclude that the smaller EC observed in AD patients was due to atrophy, to an anatomical variant, or to an interaction between them.
The data from the present study confirm the hypothesis that the right hemisphere rhinal pattern is over‐represented in AD as compared with elderly controls. However, we did not confirm the second hypothesis that EC pattern type is related to EC surface area or volume either as estimated at postmortem or in vivo. The quantitative histology data shows no relationship between EC pattern and either EC neuronal counts or EC size or PRC size. Further, the MRI data show no relationships between EC pattern and either EC surface area or EC volume. As all these validations were conducted in brains from normal subjects, the results suggest that the increased risk for AD conferred by the EC rhinal sulcus pattern is not simply due to a premorbid reduction in tissue reserve. The biological basis for the increased AD risk associated with the rhinal sulcus pattern remains unknown.
Nevertheless, evidence from other disease studies show that distinctive sulcal and gyral patterns are related to cognitive performance (Fornito et al., 2004) and confer increased life‐long risk. Morphological variability in cortical sulcal and gyral patterns has been linked to schizophrenia (Le Provost et al., 2003; Yucel et al., 2001). Global measurements (fractal dimensions) of the cortical convolutions have also indicated decreased shape complexity in schizophrenia, obsessive‐compulsive (Ha et al., 2005) and bipolar disorders (Bullmore et al., 1994). Variability in the intraparietal sulcus was associated with dyscalculia in Turner syndrome (Molko et al., 2003) and duplicate Heschl's gyri were related to reading disabilities (Leonard et al., 2001). Twin studies have indicated significant genetic contributions to paralimbic brain structures consistent with the hypothesis that common genetic risk factors could contribute to both the EC sulcal pattern and the risk for AD (Wright et al., 2002). The genetic and possible intrauterine environmental influences contributing to these morphology findings remain obscure. Moreover, it remains unknown if the EC rhinal sulcal pattern is associated with early brain development or AD related biological changes.
Gyral development starts early in fetal life and is under genetic control (Gilbert et al., 2005). The time of appearance of the different cortical sulci is orderly (Garel et al., 2001). Deeper primary sulci emerge first and the collateral sulcus appears at about week 23 of gestation (Chi et al., 1977) followed by more shallow secondary and tertiary branches (Lohmann et al., 1991). The timing for the smaller rhinal sulcus is not known but it is potentially later than the collateral. Overall, the later in development a sulcus appears, the stronger are potential environmental causes of variability.
Therefore, there are at least three explanations for our findings. First, there may be common genetic factors which contribute to both the entorhinal cortex rhinal sulcus variant and to late‐onset AD. To date, one genetic risk factor for late‐onset AD is characterized, the ApoE4 allele, but we did not observe any relationship between this and the EC pattern. However, genetic epidemiological analysis has suggested that there may be at least 4–7 other genes that influence late‐onset AD (Hardy, 2006). Recently, a late onset gene was identified (Rogaeva et al., 2007) but there is no known relationship to brain morphology. Second, proteomic analysis of gene expression in the EC of MCI patients has shown significant alterations of a number of genes that are involved in cell cycle/proliferation and cytoskeletal maintenance, which could also influence sulcal patterns (Ho et al., 2005). It remains unknown when in the course of development these proteomic effects are expressed. Furthermore presenilin, a gene associated with early onset AD, is also involved in the regulation of brain development (Fischer et al., 2005) but there is no information about a possible association between presenilin mutations to any EC pattern types. Third, epigenetic factors can contribute to the variability of gyral patterns (Bartley et al., 1997; Lohmann et al., 1991). Cortical folding approximately doubles from birth to early adult life (Armstrong et al., 1995), thus environment‐associated modifications can possibly influence postnatal development.
There were several weaknesses and limitations with this study. The postmortem validation was done on a small sample n = 34 and the majority of data were from the left hemisphere. This limited ascertaining the relationships between pattern and size by hemisphere. Our longitudinal study (limited to 3 years) revealed that the progression of atrophy in AD patients did not alter the classification of the sulcal pattern. However, we did not examine subjects in the transitions between normal and cognitive impairment or between MCI and AD, so that we cannot exclude the possibility that EC pattern changes in the right hemisphere occur early in the atrophic changes of AD. Thus, earlier and longer duration observations are warranted. Finally, there are potential biases related to the normal subjects selected for study. These biases include: (1) old normal subjects who volunteer for memory research may be a product of sampling from two distributions, a proportion of self‐referred individuals at greater risk than a randomly sampled cohort as compared with “randomly recruited” normal controls. Potentially this would have a conservative effect when compared with AD, but the actual extent of this bias is unknown; and (2) a young group which includes subjects, perhaps enriched with a family history for AD, that are destined to decline in the future to AD, but have not reached the ages for expression of symptoms. Nevertheless, our observation of an elevated prevalence of the rhinal sulcal patterns in AD and in young normal controls relative to old normal subjects is consistent with a brain characteristic that is determined early in life and which confers a risk late in life. In other words, young controls fully reflect the distributions of EC sulcal patterns. Older controls show reductions in the prevalence of the rhinal sulcal pattern presumably due to a disproportionate number transitioning to AD.
In summary, we found that a right hemisphere rhinal sulcus pattern is more common in AD than in normal controls. The entorhinal cortex sulcus pattern determination is highly reliable, patterns do not change over time and are equivalently determined in vivo with MRI and from postmortem sections. The rhinal sulcus pattern is not related to ApoE e4 genotype (a known genetic risk factor for AD) and in normal subjects we did not find any in vivo MRI or postmortem histological evidence of an association between EC pattern types and EC size or neuronal numbers. It appears that the risk for AD associated with EC pattern type is not associated with decreased neuronal counts or MRI volume reductions. Overall, our results suggest further inquiry into the genetic or early developmental origin of the rhinal sulcus pattern as a potential factor in AD pathogenesis would be worthwhile.
Acknowledgements
The authors thank Ms. Schantel Williams and Ms. Catherine Cianci for study coordination and neuropsychological testing; and Ms Terry Heyman for assisting with the MRI procedures. The authors also thank Drs. Juan Li and Kenneth Rich for their discussions.
REFERENCES
- Amaral DG,Insausti R ( 1990): Hippocampal formation In: Paxinos G,editor. The Human Nervous System. San Diego: Academic Press; pp 711–755. Ref ID: 6710. [Google Scholar]
- Armstrong E,Schleicher A,Omran H,Curtis M,Zilles K ( 1995): The ontogeny of human gyrification. Cereb Cortex (New York, NY: 1991) 5: 56–63. [DOI] [PubMed] [Google Scholar]
- Bartley AJ,Jones DW,Weinberger DR ( 1997): Genetic variability of human brain size and cortical gyral patterns. Brain 120: 257–269. [DOI] [PubMed] [Google Scholar]
- Bobinski M,de Leon MJ,Convit A,De Santi S,Wegiel J,Tarshish CY,Saint‐Louis LA,Wisniewski HH ( 1999): MRI of entorhinal cortex in mild Alzheimer's disease. Lancet 353: 38–40. [DOI] [PubMed] [Google Scholar]
- Braak H,Braak E ( 1991): Neuropathological stageing of Alzheimer‐related changes. Acta Neuropathol 82: 239–259. [DOI] [PubMed] [Google Scholar]
- Bullmore E,Brammer M,Harvey I,Persaud R,Murray R,Ron M ( 1994): Fractal analysis of the boundary between white matter and cerebral cortex in magnetic resonance images: A controlled study of schizophrenic and manic‐depressive patients. Psychol Med 24: 771–781. [DOI] [PubMed] [Google Scholar]
- Chi JG,Dooling EC,Gilles FH ( 1977): Gyral development of the human brain. Ann Neurol 1: 86–93. [DOI] [PubMed] [Google Scholar]
- de Leon MJ,Convit A,Wolf OT,Tarshish CY,De Santi S,Rusinek H,Tsui W,Kandil E,Scherer AJ,Roche A,Imossi A,Thorn E,Bobinski M,Caraos C,Lesbre P,Schlyer D,Poirier J,Reisberg B,Fowler J ( 2001): Prediction of cognitive decline in normal elderly subjects with 2‐[18F]fluoro‐2‐deoxy‐d‐glucose/positron‐emission tomography (FDG/PET). Proc Natl Acad Sci USA 98: 10966–10971. [DOI] [PMC free article] [PubMed] [Google Scholar]
- de Leon MJ,De Santi S,Zinkowski R,Mehta PD,Pratico D,Segal S,Clark C,Kerkman D,DeBernardis J,Li J,Lair L,Reisberg B,Tsui W,Rusinek H ( 2004). MRI and CSF studies in the early diagnosis of Alzheimer's disease. J Intern Med 256: 205–223. [DOI] [PubMed] [Google Scholar]
- Dickerson B,Salat D,Bates JF,Atiya M, Killiany, RJ ,Greve DN,Dale AM,Stern CE,Blacker D,Albert MS,Sperling RA ( 2004). Medial temporal lobe function and structure in mild cognitive impairment. Ann Neurol 56: 27–35. [DOI] [PMC free article] [PubMed] [Google Scholar]
- Fischer DF,van Dijk R,Sluijs JA,Nair SM,Racchi M,Levelt CN,van Leeuwen FW,Hol EM ( 2005). Activation of the Notch pathway in Down syndrome: Cross‐talk of Notch and APP. FASEB J 19: 1451–1458. [DOI] [PubMed] [Google Scholar]
- Folstein M ( 1983). The Mini‐Mental State Examination In Crook T,Ferris SH,Bartus R, editors. Assessment in Geriatric Psychopharmacology. Mark Powley Associates: New Canaan; pp 47–51. Ref ID: 765. [Google Scholar]
- Fornito A,Yucel M,Wood S,Stuart GW,Buchanan JA,Proffitt T,Anderson V,Velakoulis D,Pantelis C ( 2004): Individual differences in anterior cingulate/paracingulate morphology are related to executive functions in healthy males. Cereb Cortex 14: 424–431. [DOI] [PubMed] [Google Scholar]
- Garel C,Chantrel E,Brisse H,Elmaleh M,Luton D,Oury J F.,Sebag G,Hassan M ( 2001): Fetal cerebral cortex: Normal gestational landmarks identified using prenatal MR imaging. AJNR Am J Neuroradiol 22: 184–189. [PMC free article] [PubMed] [Google Scholar]
- Gilbert SL,Dobyns WB,Lahn BT ( 2005): Genetic links between brain development and brain evolution. Nat Rev Genet 6: 581–590. [DOI] [PubMed] [Google Scholar]
- Goncharova II,Dickerson BC,Stoub TR, Detoledo‐Morrell, L ( 2001): MRI of human entorhinal cortex: A reliable protocol for volumetric measurement. Neurobiol Aging 22: 737–745. [DOI] [PubMed] [Google Scholar]
- Ha TH,Yoon U,Lee KJ,Shin YW,Lee JM,Kim IY,Ha KS,Kim SI,Kwon JS ( 2005): Fractal dimension of cerebral cortical surface in schizophrenia and obsessive‐compulsive disorder. Neurosci Lett 384: 172–176. [DOI] [PubMed] [Google Scholar]
- Hanke J ( 1997): Sulcal pattern of the anterior parahippocampal gyrus in the human adult. Ann Anat 179: 335–339. [DOI] [PubMed] [Google Scholar]
- Hardy J ( 2006): A hundred years of Alzheimer's disease research. Neuron 52: 3–13. [DOI] [PubMed] [Google Scholar]
- Ho L,Sharma N,Blackman L,Festa E,Reddy G,Pasinetti GM ( 2005): From proteomics to biomarker discovery in Alzheimer's disease. Brain Res Rev 48: 360–369. [DOI] [PubMed] [Google Scholar]
- Insausti R,Tunon T,Sobreviela T,Insausti AM,Gonzalo LM ( 1995): The human entorhinal cortex: A cytoarchitectonic analysis. J Comp Neurol 355: 171–198. [DOI] [PubMed] [Google Scholar]
- Juottonen K,Laakso MP,Insausti R,Lehtovirta M,Pitkanen A,Partanen K,Soininen H ( 1998): Volumes of the entorhinal and perirhinal cortices in Alzheimer's disease. Neurobiol Aging 19: 15–22. [DOI] [PubMed] [Google Scholar]
- Killiany RJ,Hyman BT,Gomez‐Isla T,Moss MB,Kikinis R,Jolesz F,Tanzi R,Jones K,Albert MS ( 2002): MRI measures of entorhinal cortex vs hippocampus in preclinical AD. Neurology 58: 1188–1196. [DOI] [PubMed] [Google Scholar]
- Le Provost JB,Bartres‐Faz D,Paillere‐Martinot ML,Artiges E,Pappata S,Recasens C,Perez‐Gomez M,Bernardo M,Baeza I,Bayle F,Martinot JL ( 2003). Paracingulate sulcus morphology in men with early‐onset schizophrenia. Br J Psychiatry 182: 228–232. [DOI] [PubMed] [Google Scholar]
- Leonard CM,Eckert MA,Lombardino LJ,Oakland T,Kranzler J,Mohr CM,King WM,Freeman A ( 2001): Anatomical risk factors for phonological dyslexia. Cereb Cortex (New York, NY: 1991) 11: 148–157. [DOI] [PubMed] [Google Scholar]
- Lohmann G,von Cramon DY,Steinmetz H ( 1991): Sulcal variability of twins. Cereb Cortex (New York, NY: 1991) 9: 754–763. [DOI] [PubMed] [Google Scholar]
- Main BF,Jones PJ,MacGillivray RT,Banfield DK ( 1991): Apolipoprotein E genotyping using the polymerase chain reaction and allele‐specific oligonucleotide primers. J Lipid Res 32: 183–187. [PubMed] [Google Scholar]
- McKhann G,Drachman D,Folstein M,Katzman R,Price D,Stadlan EM ( 1984): Clinical diagnosis of Alzheimer's disease: Report of the NINCDS‐ADRDA work group under the auspices of department of Health and human services task force on Alzheimer's disease. Neurology 34: 939–944. [DOI] [PubMed] [Google Scholar]
- Mega MS,Small GW,Xu M,Felix J,Manese M,Tran N,Dailey JI,Ercoli LM ( 2002): Hippocampal atrophy in persons with age‐associated memory impairment: Volumetry within a common space. Psychosom Med 64: 487–492. [DOI] [PubMed] [Google Scholar]
- Molko N,Cachia A,Riviere D,Mangin JF,Bruandet M,Le Bihan D,Cohen L,Dehaene S ( 2003): Functional and structural alterations of the intraparietal sulcus in a developmental dyscalculia of genetic origin. Neuron 40: 847–858. [DOI] [PubMed] [Google Scholar]
- Ono M,Kublik S,Abernathey CD ( 1990): Atlas of the Cerebral Sulci. New York: Thieme Medical Publishers. Ref ID: 8777. [Google Scholar]
- Petrella JR,Coleman RE,Doraiswamy PM ( 2003): Neuroimaging and early diagnosis of Alzheimer disease: A look to the future. Radiology 226: 315–336. [DOI] [PubMed] [Google Scholar]
- Pruessner JC,Kohler S,Crane J,Pruessner M,Lord C,Byrne A,Kabani N,Collins DL,Evans AC ( 2002): Volumetry of Temporopolar, perirhinal, entorhinal and parahippocampal cortex from high‐resolution MR images: Considering the variability of the collateral sulcus. Cereb Cortex 12: 1342–1353. [DOI] [PubMed] [Google Scholar]
- Reisberg B,Ferris SH ( 1988). The Brief Cognitive Rating Scale (BCRS). Psychopharmacol Bull 24: 629–636. [PubMed] [Google Scholar]
- Reisberg B,Ferris SH,de Leon MJ,Crook T ( 1982). The Global Deterioration Scale for assessment of primary degenerative dementia. Am J Psychiatry 139: 1136–1139. [DOI] [PubMed] [Google Scholar]
- Rogaeva E,Meng Y,Lee JH,Gu Y,Kawarai T,Zou F,Katayama T,Baldwin CT,Cheng R,Hasegawa H,Chen F,Shibata N,Lunetta KL,Pardossi‐Piquard R,Bohm C,Wakutani Y,Cupples LA,Cuenco KT,Green RC,Pinessi L,Rainero I,Sorbi S,Bruni A,Duara R,Friedland RP,Inzelberg R,Hampe W,Bujo H,Song YQ,Andersen OM,Willnow TE,Graff‐Radford N,Petersen RC,Dickson D,Der SD,Fraser P E,Schmitt‐Ulms G,Younkin S,Mayeux R,Farrer LA,George‐Hyslop P ( 2007): The neuronal sortilin‐related receptor SORL1 is genetically associated with Alzheimer disease. Nat Genet 39: 168–177. [DOI] [PMC free article] [PubMed] [Google Scholar]
- Rusinek H,Endo Y,De Santi S,Frid D,Tsui WH,Segal S,Convit A,de Leon MJ ( 2004). Atrophy rate in medial temporal lobe during progression of Alzheimer disease. Neurology 63: 2354–2359. [DOI] [PubMed] [Google Scholar]
- Thompson PM,Mega MS,Woods RP,Zoumalan CI,Lindshield CJ,Blanton RE,Moussai J,Holmes CJ,Cummings JL,Toga A W ( 2001): Cortical change in Alzheimer's disease detected with a disease‐specific population‐based brain atlas. Cereb Cortex 11: 1–13. [DOI] [PubMed] [Google Scholar]
- Thompson PM,Moussai J,Zohoori S,Goldkorn A,Khan A A,Mega MS,Small GW ( 1998): Cortical variability and asymmetry in normal aging and Alzheimer's disease. Cereb Cortex 8: 492–509. [DOI] [PubMed] [Google Scholar]
- Tsui WH,Rusinek H,Van Gelder P,Lebedev S ( 2001): Analyzing multi‐modality tomographic images and associated regions of interest with MIDAS. Proc SPIE Med Imaging: Image Process 4322: 1725–1734. [Google Scholar]
- Van Hoesen GW ( 1995): Anatomy of the medial temporal lobe. Magn Reson Imaging 13: 1047–1055. [DOI] [PubMed] [Google Scholar]
- West MJ ( 1993). New stereological methods for counting neurons. Neurobiol Aging 14: 275–285. [DOI] [PubMed] [Google Scholar]
- Wright IC,Sham P,Murray RM,Weinberger DR,Bullmore ET ( 2002): Genetic contributions to regional variability in human brain structure: Methods and preliminary results. Neuroimage 17: 256–271. [DOI] [PubMed] [Google Scholar]
- Xu Y,Jack CRJ,O'Brien PC,Kokmen E,Smith GE,Ivnik R J,Boeve BF,Tangalos RG,Petersen RC ( 2000). Usefulness of MRI measures of entorhinal cortex versus hippocampus in AD. Neurology 54: 1760–1767. [DOI] [PubMed] [Google Scholar]
- Yucel M,Stuart GW,Maruff P,Velakoulis D,Crowe SF,Savage G,Pantelis C ( 2001): Hemispheric and gender‐related differences in the gross morphology of the anterior cingulate/paracingulate cortex in normal volunteers: An MRI morphometric study. Cereb Cortex (New York, NY: 1991) 11: 17–25. [DOI] [PubMed] [Google Scholar]