

Abstract
Polycythemia vera (PV) is an acquired myeloproliferative clonal disorder, characterized by augmented erythropoiesis. To better define PV pathogenesis, we performed an in vitro erythroid expansion from peripheral blood mononuclear cells of controls and PV patients and evaluated the cells for proliferation, apoptosis, erythroid differentiation, and morphology at the defined time points. PV erythroid progenitors exhibited increased proliferation at days 9~14 and accelerated maturation at days 7~14, with a larger S-phase population (40%) than controls (20%) at day 11; however, the proportion of apoptotic cells was comparable to controls. Previously, we have identified PV-specific dysregulation of several microRNAs (i.e. miR-150, 451, 222, 155, 378). We had analyzed expression profiles of selected target genes of these microRNAs based on in silico prediction and their known function pertinent to the observed PV-specific erythropoiesis differences. p27, cMYB and EPOR showed differential expression in PV erythroid progenitors at the specific stages of erythroid differentiation. In this study, we identified accelerated maturation and hyper-proliferation at early stages of PV erythropoiesis. We speculate that aberrant expression of p27, c-MYB, and EPOR may contribute to these abnormal features in PV erythropoiesis.
Keywords: polycythemia vera, in vitro erythroid expansion, erythroid maturation, erythropoiesis, miRNA in polycythemia vera, p27, c-MYB, erythropoietin receptor genes
INTRODUCTION
Erythropoiesis is a process of production of red blood cells from hematopoietic stem cells resulting from balanced proliferation, apoptosis, and differentiation that are tightly regulated by intrinsic and extrinsic signals in a differentiation stage-specific manner. The imbalance or aberrant activation of these signals has pathological consequences. Polycythemia vera (PV) is a myeloproliferative disorder stemming from somatic mutation(s) of a hematopoietic pluripotent cell leading to clonal hematopoiesis [1; 2; 3]. PV is characterized by hyperactive erythropoiesis resulting in accumulation of phenotypically normal red blood cells. PV progenitors generate increased numbers of erythroid colonies at low concentrations of erythropoietin (Epo) and Epo-independent colonies compared to healthy controls [4; 5]. A greater than 90% of PV patients harbor a somatic mutation JAK2 V617F, which leads to hyperactive Epo signaling [6; 7]. This mutation plays an important role in the pathophysiology of PV cells. However, the growing evidence suggests that JAK2 mutation may not be the initial PV event [2; 8; 9]. In order to study the molecular mechanisms of erythropoiesis, large numbers of cells at the same maturation stage are needed. Several in vitro erythroid expansion methods have been developed [10; 11]. We have developed an improved in vitro erythroid expansion method to obtain synchronized populations of erythroid cells from an easily attainable volume of peripheral blood mononuclear cells (PB-MNCs) [12].
Erythropoiesis requires many factors, including Epo [13], Epo receptor (EpoR) [13], Gata-1 [14; 15; 16], Stat5 [17; 18; 19], Bcl-XL [17; 18; 19], Bnip3L (also called Nix) [20; 21], c-Myb [22; 23], and others including microRNAs (miRNAs) [12; 24; 25; 26]. MicroRNAs are small non-coding RNAs (~22nt) that regulate gene expression. Previously, we have characterized miRNA expression patterns during normal and PV erythropoiesis and identified several miRNAs (miR-150, miR-451, miR-155, miR-222, miR-378) dysregulated in PV cells [12]. In silico prediction showed that these miRNAs may target these erythropoietic regulators.
In the present study, we employed an in vitro erythroid expansion system to characterize unique features of PV erythropoiesis and examine expression profiles of selected erythropoietic regulators to better define the molecular mechanisms of PV pathogenesis and now demonstrate differential expression of p27, cMYB and EPOR.
MATERIALS AND METHODS
Erythroid cell expansion
Eight healthy donors and 13 PV patients donated peripheral blood using a University of Utah Institutional Review Board approved protocol. The PB-MNCs were isolated by a Ficoll-Paque (Sigma, St. Louis, MO) gradient centrifugation according to the manufacturer’s protocol. The PB-MNCs (106 cells/ml) were cultured in StemSpan Serum-Free Expansion Medium (StemCell Technologies, Vancouver, CA) and expanded in a three-phase liquid assay for 21 days, as previously described [12]. Briefly, the medium was changed every 2–3 days and cell density was adjusted at 106 cells/ml. At days 1–7 cells were grown in StemSpan CC110 Cytokine Cocktail (StemCell Technologies, Vancouver, CA); containing 100ng/ml Stem Cell Factor (SCF), 100ng/ml Thrombopoetin (Tpo) and 100ng/ml Fetal Liver Tyrosine Kinase 3 Ligand (Flt3-L), at days 8–14 with 50ng/ml SCF, 50ng/ml Insulin-like Growth Factor I (IGF-I) (R&D Systems, Minneapolis, MN), 3U/ml Epo (Amgen, Thousand Oaks, CA) and at days 15–21 50ng/ml IGF-1 and 3U/ml Epo. The cultured cells were incubated at 37ºC in 5% CO2 atmosphere and collected on the 1st, 7th, 9th, 11th, 14th, 16th, 19th, and 21st days. At each time point, the cells were evaluated for cell growth, maturation stage, and apoptosis/cell cycle.
Flow cytometry
The harvested cells (5×10⁵) were re-suspended in PBS containing 5% fetal bovine serum and double-stained with fluorescein isothyocyanate (FITC)-conjugated anti-CD71 (transferrin receptor) and phycoerythrin (PE)-conjugated anti-CD253a (glycophorin A) monoclonal antibodies (BD Pharmigen, San Jose, CA). Flow cytometric analysis was performed on a FACScan Analyzer instrument (Becton Dickinson, San Jose, CA), as previously described[12].
Erythroid maturation was monitored at defined time points by fluorescent activating cell sorter (FACS) analysis using two differentially-regulated antigens; i.e., CD71 that is up-regulated in erythroid and other rapidly proliferating cells and an erythroid-specific antigen, glycophorin A (CD235a), and by conventional morphologic analysis of Wright-Giemsa-stained maturating erythroid cells. During erythroid maturation, CD71 surface expression is increased in early-expanded erythroid cells and then gradually decreases, while CD235a expression is progressively increased with erythroid maturation.
In the ensuing FACS analysis 6 different regions based on the differential expression levels of CD71 and CD235a are defined, which correspond to those defined in mouse erythropoiesis [27]; region I - CD71midCD235alow, region II - CD71highCD235alow, region III - CD71highCD235ahigh, region IV - CD71midCD235ahigh, region V - CD71lowCD235ahigh, and region VI - CD235amax.
Cell growth and apoptosis/cell cycle analyses
Cell number and viability were determined using CellometerAutoT4 (Nexcelom Bioscience, Lawrence, MA) based on the trypan blue exclusion method. Apoptosis and cell cycle analyses were assessed by propidium iodide (PI) staining [28].
Cell morphology
For cell morphology analyses, the cells were washed twice in PBS and slides (200,000 cells per slide) were prepared by centrifugation at 1,500 rpm for 5 minutes using Cytospin 2 (Shandon Co., Pittsburgh, PA). The cells were stained with Wright-Giemsa stain (Sigma, St. Louis, MO), the slides were randomly labeled, and at least 100 cells on each slide were morphologically evaluated by a hematopathologist.
Quantitative expression analysis of selected genes
Total RNA was isolated from the cells by Tri-Reagent (MRC, Cincinnati, OH). The RNA (500ng) was reverse transcribed into cDNA using SuperScript III First-Strand Synthesis SuperMix for qRT-PCR kit (Invitrogen, Carlsbad, CA) using the following conditions: 25 ºC for 10min, 50 ºC for 30min, 85 ºC for 5min with additional RNase H incubation at 37 ºC for 20min. Expression of the genes was determined by quantitative real time polymerase chain reaction (qRT-PCR) using TaqMan Expression Assays (cMYB: Hs00920571_m1; EPOR: Hs00181092_m1; cKIT: Hs00922209_m1; p27: Hs00153277_m1; BCL-XL: Hs00169141_m1; BNIP3L: Hs00188949_m1) (Applied Biosystems, Foster City, CA). One μl of cDNA was used for qRT-PCR and the reaction was carried out at 95ºC for 10min, followed by 40 cycles of 94ºC for 15s and 60ºC for 1min. Expression level of the genes was normalized to 18S rRNA (Hs99999901_s1, Applied Biosystems). Means of ΔCT with standard error were calculated [29]. JAK2 V617F allelic burden was quantified in purified granulocytes by quantitative AS-PCR methods, as previously described [3].
Statistical evaluation
The statistical significance between controls and PV patients was calculated by Student’s t-test and p-value below 0.05 was considered significant.
RESULTS
Accelerated maturation of PV erythroid cells during early stages of erythropoiesis
We have evaluated the expanded erythroid cells from both controls (n=8) and PV patients (n=13) by a differential surface markers (CD71/CD235a) expression pattern, and cell morphology [11] The expanded erythroid cells from both groups showed a typical differential surface expression pattern of CD71 and CD235a antigens during the in vitro expansion until day 14. However, PV-erythroid cells differed from normals and had accelerated maturation during days 7~11. As shown in Table 1 and Figure 1, the more maturated erythroid cells in PV appeared from days 7 ~ 11, and then from day 14 expanded cells from PV and controls became comparable.
Table 1.
Statistical analysis of percentage of erythroid stage using CD71/CD235a expression profiles during expansion.
| R1 | R2 | R3 | R4 | R5 | |||||||||||
|---|---|---|---|---|---|---|---|---|---|---|---|---|---|---|---|
| CTR | PV | P value | CTR | PV | P value | CTR | PV | P value | CTR | PV | P value | CTR | PV | P value | |
| Day 7 | 7.9±0.74 | 8.4±1.70 | 0.76 | 1.5±0.34 | 1.2±0.38 | 0.55 | 0.58±0.17 | 1.87±0.57 | 0.05* | 0.5±0.11 | 1.5±0.36 | 0.02* | 0.25±0.13 | 0.68±0.23 | 0.16 |
| Day 9 | 5.8±0.64 | 9.8±2.64 | 0.28 | 1.1±0.35 | 2.3±1.71 | 0.56 | 2.3±0.74 | 30.2±6.52 | 0.05* | 0.5±0.08 | 9.6±0.24 | 0.00** | 0.5±0.09 | 0.28±0.11 | 0.40 |
| Day 11 | 6.7±1.28 | 5.6±1.96 | 0.70 | 0.28±0.11 | 0.19±0.65 | 0.66 | 14.3±6.55 | 8.4±6.07 | 0.54 | 14.2±8.44 | 57.9±12.11 | 0.04* | 0.52±0.31 | 0.93±0.40 | 0.47 |
| Day 14 | 9.3±1.70 | 9.9±2.43 | 0.87 | 0.11±0.06 | 0.11±0.09 | 0.99 | 8.1±2.31 | 4.4±1.95 | 0.24 | 37.8±4.15 | 47.8±4.52 | 0.15 | 2.5±0.57 | 2.8±0.60 | 0.76 |
Data are presented as the mean plus standard error. CTR-controls, PV- polycythemia vera patients,
p< 0.05,
p<0.01
Figure 1. Accelerated maturation of PV erythroid progenitors at the early stages of erythropoiesis.

At each time point, the cells were analyzed under microscope for maturation stage by cell morphologies after Wright-Giemsa staining and. cell morphology scores were measured. The percentages of cells were calculated in total evaluated cells at the particular time point. Data are presented as the mean percentage of particular cell type of 8 controls and 13 PV patients. PV-polycythemia vera, d-day, Pro-EryB- proerythroblasts, Baso-EryB- basophilic erythroblasts, Poly-EryB- polychromatophilic erythroblasts.
This accelerated maturation of PV progenitors was validated by the morphological analyses. The de-identified slides were evaluated microscopically and the percentages of each population of erythroid cells from each group were averaged (Figure 1). The basophilic erythroblasts started to appear at day 7 (2.3% in controls versus 21.5% in PV), reached a maximum at day 11 (72.8% in controls versus 55.9% in PV) and thereafter decreased. The polychromatophilic erythroblasts appeared at day 11 in controls (16.9%) and at day 9 in PV (9.8%), and reached peaks at day 16 in controls and day 14 in PV. The morphologically identifiable late (eosinophilic) erythroblasts in both controls and PV increased exponentially from day 16. At day 19, most of expanded cells became polychromatophilic erythroblasts and late normoblasts. At day 21, the majority of cells were late normoblasts with a small fraction of reticulocytes.
This in vitro expansion method did not efficiently support the terminal erythroid maturation, such as enucleation and mitochondrial/ribosome removal, as previously described [10]. However, some reticulocytes from as early as day 14 in PV and day 16 in control cultures were present. High expressing CD235a cells (Region VI) started to appear from day 16 in controls and slightly earlier in PV erythroid cells. Concomitantly, morphological analyses revealed increasing proportions of smudge cells.
To ensure that the expanded cells are erythroid origin, we analyzed the expression of CD3 (marker for T-lymphoid cells) and CD19 (marker for B-lymphoid cells) on the expanded cells. At day 1, 30~55% of cells were lymphoid lineage cells that reflected the composition of the PB-MNC population. However, this lymphoid population was significantly reduced as maturation progressed (at day 7, 16.8% and at day 9, 10.2%). From day 14, we were not able to identify any other lineage cells than erythroid.
Hyper-proliferation of PV erythroid cells at intermediate stages of maturation
PB-MNCs (106 cells/ml) from both controls and PV patients were cultured for 21 days in the presence of selected cytokines, as described in Materials and Methods. The time points were selected based on previously published data [12]. Cell proliferation was expressed as fold change by calculation of cell number at the indicated time point/cell number at day 1 (at day 1 most cells were lymphoid and other non-erythroid cell lineages). The culture conditions resulted in a synchronized expansion of erythroid cells (but not non-erythroid cells), which plateaued at 3.6-fold expansion at day 14 and then decreased to 2.6-fold by day 21. Both control and PV cells had a similar growth rate up to day 9 (Figure 2). However, PV erythroid cells had higher growth rate from day 9 up to day 14 (1.4 to 8.2 fold versus 1.2 to 3.6 fold of normal erythroid cells, p=0.04). At day 21 there was no obvious difference between number of PV and normal erythroid progenitors.
Figure 2. Hyper-proliferation of PV erythroid progenitors.
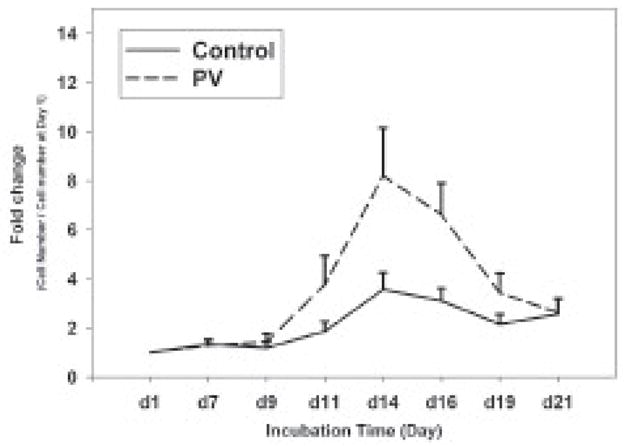
The cell number of expanded cells was determined at each time point by trypan blue exclusion method. Fold change was calculated by cell number at the indicated time/cell number at day 1. Data are presented as the mean plus standard error. PV-polycythemia vera, d-day.
Increased S phase population in PV erythroid cells at day 11
To investigate the mechanism of hyper-proliferation of expanded PV early erythroid progenitors, we performed apoptosis/cell cycle analysis using PI staining followed by FACS analysis. As shown in Figure 3, the proportion of apoptotic cells from both controls and PV erythroid cells were noticeable at the beginning of the culture, then gradually decreased until day 14, and then increased again. During days 7~11, control erythroid cells had a higher proportion of apoptotic cells. Thereafter, PV erythroid cells contained larger apoptotic populations than control erythroid cells. In concordance with the results from Figure 1, the S-phase was significantly increased in PV erythroid cells at day 11 compared to controls (45.4 versus 20.1%, p<0.01), while the G0/G1 phase was reduced in PV cells (24.01 versus 57.2%, p=0.012).
Figure 3. PV erythroid progenitors at day 11 contained high proportion of S phase cells than control progenitors.

Apoptosis (Sub-diploid) and cell cycle phase were analyzed using propidium iodide staining. Data are presented as the mean plus standard error. The statistical significance between control and PV erythroid cells was calculated by Student’s t-test. PV-polycythemia vera, d-day, * and ** represent p <0.05 and p <0.01, respectively.
Expression patterns of selected genes during erythroid maturation
To search for the molecular basis of these PV-specific erythroid expansion (i.e. hyper-proliferation and accelerated maturation), we tested expression levels of selected genes by qRT-PCR, including cell cycle- and apoptosis-related genes (p27, BNIP3L, and BCL-XL) and erythropoiesis-regulating genes (c-MYB and EPOR).
As shown in Figure 4, three distinct expression patterns were observed: a) up-regulation of BCL-XL and BNIP3L, b) biphasic expression of c-MYB and EPOR and c) relatively steady expression of p27. The gene expression of the anti-apoptotic genes BNIP3L and BCL-XL gradually increased as maturation progressed. BNIP3L showed significant differences between controls and PV at days 11 and 14. Expression of p27, cell cycle inhibitor, in control erythroid cells was increased at days 11 and 14, while in PV it remained at the low level throughout maturation. Expression of cMYB was increased until day 11 then reduced, and remained at the low level from day 14 until day 21. However, the level of cMYB expression was significantly decreased in PV at day 11 (p<0.05). The mRNA level of EPOR peaked at day 11, then gradually decreased in both groups; however, the expression of EPOR were significantly higher in controls at days 11 and 14 compared to PV (p<0.01). From day 16, the EPOR mRNA levels became comparable in both controls and PV.
Figure 4. Differential expression of apoptotic and cell cycle regulators at specific stages of PV erythropoiesis.

The expression levels of selected genes were tested during normal and PV erythropoiesis using qRT-PCR. Means of ΔCT with standard error were shown in Y-axis. Data are presented as the mean plus standard error. The statistical significance between control and PV erythroid cells was calculated by Student’s t-test. PV-polycythemia vera, d-day, * and ** represent p <0.05 and p <0.01, respectively. Relative expressions of particular genes as indicated were normalized against the level at day 1.
We then compared levels of the JAK2V617F allelic burden (ranging from 65~99.8%) with PV aberrant expression of the tested genes and no correlation was found (data not shown).
DISCUSSION
The cell proliferation defect of PV has been exemplified using erythroid colony-forming assays (BFU-E and CFU-E) that measure the erythroid progenitors’ proliferation and maturation. However, these assays examine cells at the intermediate and terminal stages of erythroid maturation and cannot accurately assess the proliferation, apoptosis, or subtle changes in maturation. In order to study PV pathogenesis at the cellular and molecular levels, we selected a culture system that permits evaluation of earlier stages of erythroid maturation. Further, this liquid culture system allows an easy access to the maturating cells during erythroid expansion [12; 30]. In contrast to CD34-derived cultures necessitating sampling of marrow or use of the large amount of peripheral blood for CD34 cell preparation, we used a small amount of peripheral blood (7 ml) as a source of easily obtainable mononuclear cells.
To characterize in vitro PV erythropoiesis, we evaluated erythroid maturation by two independent methods, CD71/CD235a differential surface expression analysis by FACS, and conventional morphology of Wright-Giemsa stained erythroid cells. Initially, PB-MNCs from both controls and PV at day 1 exhibited no morphological feature of erythroid maturation and were CD71/CD235a-negative (Table 1). FACS analyses showed that 40.5% of peripheral blood circulating cells were lymphocytes, however, this population is significantly reduced as erythroid maturation progressed (10.2% at day 9). A morphological evaluation showed that the expanded population was erythroid from day 14. However, PV erythroid cells showed accelerated erythroid proliferation and maturation from day 7 to day 14 compared to control-EPs (Table 1). Morphologically, all erythroid maturation stages (i.e., basophilic and polychromatophilic erythroblasts and eosinophilic normoblasts) appeared earlier in PV; however, by day 16 of the culture, both PV and control erythroid cells were composed of similar proportions of each maturation stage. Previously, Ugo et al demonstrated that glycophorin-positive cells appear earlier in PV than control in CD34 positive in vitro cell culture [31]. Our results confirmed and further refined the accelerated erythroid maturation of PV progenitors. This recognizable erythroid PV maturation was first noted at day 7 when the medium does not contain Epo, which correlates with the hallmark of PV; i.e. presence of Epo-independent (endogenous BFU-E) erythroid colonies (EECs) [4]. However, the accelerated PV erythroid maturation in the presence of Epo observed during the second week of culture was not anticipated, since the numbers of concomitantly analyzed BFU-E colonies from controls and PV are indistinguishable at 3U/ml Epo when examined by phase contrast microscope (data not shown).
We also evaluated erythroid cell proliferation. Erythropoietin and Insulin-like Growth Factor I were present in the medium at the second week of culture, and numbers of erythroid cells increased during this period (Figure 2). However, at this stage of erythroid maturation, PV erythroid cells had higher proliferation rates compared to controls. Our data contrast with data published by Ugo et al who concluded that PV may not have Epo hyperproliferative abnormality [31]; however, later the same group and others demonstrated the Epo hypersensitivity of PV progenitors [32; 33].
Further, we tested a hypothesis that the increased proliferation in PV was due to decreased apoptosis. The proportion of apoptotic erythroid cells from controls and PV at each time point of culture was evaluated by PI staining followed by FACS analysis. As shown in Figure 3, we observed biphasic patterns of the subdiploid population. Our culture conditions supported pluripotent hematopoietic cells initially and then erythroid progenitors. As the cells present at initiation of culture (PB-MNCs) were heterogeneous, the non-erythroid cells (mainly lymphocytes and monocytes) were rapidly undergoing apoptosis during early stages of culture. At the terminal stages of culture, our in vitro expansion assay could not support erythroid cells beyond the late normoblast stage based on the morphological analysis. As shown in Figure 2, there was significant cell number reduction after day 14, but the apoptotic rate was not significantly different between controls and PV. Cell cycle profiles of PV progenitors were significantly different with higher percentage of S-phase population in PV (Figure 3). The combined data suggest that PV specific hyper-proliferation was caused by aberrant cell cycle, not by reduced apoptosis.
To understand the molecular mechanisms of increased proliferation and accelerated maturation in PV, we analyzed various erythropoiesis-regulating genes. We previously identified several uniquely regulated microRNAs in in vitro expanded PV erythroid cells: miR-150, 451, 222, 155, and 378 [12]. We selected these target genes from in silico miRNA target analysis, that were candidates for regulation of erythroid maturation and cell cycle: EPOR [13], BCL-XL [17; 18; 19], BNIP3L [20; 21], cMYB [22; 23] and p27. In present study, we demonstrated that cMYB, BNIP3L, p27 and EPOR have unique profiles in PV erythroid cells during expansion (Figure 4).
In this study, the expression of BCL-XL was changed during maturation, but showed no difference in PV and controls. Bcl-XL has been reported to be involved in regulating erythroid proliferation and survival [34]. The other apoptosis regulating factor BNIP3L in PV erythroid cells trended to a lower expression at day 11 and 14, although these have not reached statistical significance (p=0.16 and p=0.07, respectively).
The expression of cell cycle inhibitor p27KIP1 was higher in control erythroid cells at days 11 and 14 (Figure 4, p=0.05). At that stage, the cell proliferation rate of PV was higher (Figure 2) with an increased S-phase cell proportion (Figure 3), suggesting possible effect of higher levels of p27 in the controls. The p27 is one of miR-222 putative targets [35] and this miRNA was over-expressed during the second week of PV erythroid expansion [12]. The c-Myb is reported to regulate c-Kit receptor and is expressed from the early erythroid cells to the CFU-E stage [23; 36]. It maintains proliferative activity of erythroid progenitors at early stages. We found a high expression of c-MYB in PV erythroid cells at days 7 and 9, possibly causing rapid acceleration/initiation of growth of PV cells at this stage. c-MYB has been shown to be a target of miR-150 that plays a crucial role in B cell development [37]. In our previous study, miR-150 was decreased in PV erythroid cells at all stages of erythroid maturation [12]. We anticipated the higher EPOR expression, since PV erythroid cells are known to be hypersensitive to Epo; however, EPOR mRNA was markedly decreased in PV erythroid cells during the mid-stage of erythroid maturation (days 11 and 14, p=0.0007 and 0.0074, respectively). Our previous work showed that EPOR is potential target of miR-575. However, the differential expression of miR-575 in PV was shown only at the late stage of erythropoiesis. It is possible that the differential expressions of selected genes (c-MYB, p27, EPOR and possibly BNIP3L) in PV may be result of PV accelerated maturation at the mid-point of erythropoiesis. However, as shown in Figure 4, the aberrant expressions of selected genes were stage-specific for PV erythroid progenitors. This suggests that observed differences in expression are PV unique and possibly contribute to PV phenotype.
We are cognizant that the analyses of erythroid progenitors we used here differ from in vivo conditions wherein the typical PV patient has a low Epo level that precludes erythroid maturation and proliferation of non-PV progenitors that are dormant in PV marrow. However, PV is a prototype of primary polycythemia, wherein somatic mutation(s) exert cell specific defect(s) that, unlike in secondary polycythemia, is (are) not humoral factor dependent [38]. In point of fact, the assay we used with low Epo levels allowed us to evaluate PV erythroid progenitors; however, under these conditions an insufficient number of normal erythroid progenitors were generated, precluding meaningful comparative analyses (data not shown).
Here we demonstrate the increased proliferation and accelerated maturation of PV erythroid cells during the mid-stage of erythropoiesis. These PV-specific erythroid differences correlate with aberrant expressions of p27, EPOR and c-MYB.
Acknowledgments
The presented study was supported by 1P01CA108671-O1A2 (MPD) Consortium project#1 (JTP); R01HL50077-11, VAH Merit review grant (JTP), and NR/9236-3 IGA MZd CR.
Footnotes
Authors stated that there is no conflict-of-interest that related to the manuscript.
Publisher's Disclaimer: This is a PDF file of an unedited manuscript that has been accepted for publication. As a service to our customers we are providing this early version of the manuscript. The manuscript will undergo copyediting, typesetting, and review of the resulting proof before it is published in its final citable form. Please note that during the production process errors may be discovered which could affect the content, and all legal disclaimers that apply to the journal pertain.
References
- 1.Adamson JW, Fialkow PJ, Murphy S, Prchal JF, Steinmann L. Polycythemia vera: stem-cell and probable clonal origin of the disease. N Engl J Med. 1976;295:913–6. doi: 10.1056/NEJM197610212951702. [DOI] [PubMed] [Google Scholar]
- 2.Kralovics R, Teo SS, Li S, Theocharides A, Buser AS, Tichelli A, Skoda RC. Acquisition of the V617F mutation of JAK2 is a late genetic event in a subset of patients with myeloproliferative disorders. Blood. 2006;108:1377–80. doi: 10.1182/blood-2005-11-009605. [DOI] [PubMed] [Google Scholar]
- 3.Nussenzveig RH, Swierczek SI, Jelinek J, Gaikwad A, Liu E, Verstovsek S, Prchal JF, Prchal JT. Polycythemia vera is not initiated by JAK2V617F mutation. Exp Hematol. 2007;35:32–8. doi: 10.1016/j.exphem.2006.11.012. [DOI] [PubMed] [Google Scholar]
- 4.Shih LY, Lee CT, See LC, Ou YC, Dunn P, Wang PN, Kuo MC, Wu JH. In vitro culture growth of erythroid progenitors and serum erythropoietin assay in the differential diagnosis of polycythaemia. Eur J Clin Invest. 1998;28:569–76. doi: 10.1046/j.1365-2362.1998.00331.x. [DOI] [PubMed] [Google Scholar]
- 5.Prchal JF, Axelrad AA. Letter: Bone-marrow responses in polycythemia vera. N Engl J Med. 1974;290:1382. doi: 10.1056/nejm197406132902419. [DOI] [PubMed] [Google Scholar]
- 6.James C. The JAK2V617F Mutation in Polycythemia Vera and Other Myeloproliferative Disorders: One Mutation for Three Diseases? Hematology Am Soc Hematol Educ Program. 2008;2008:69–75. doi: 10.1182/asheducation-2008.1.69. [DOI] [PubMed] [Google Scholar]
- 7.Levine RL, Gilliland DG. Myeloproliferative disorders. Blood. 2008;112:2190–8. doi: 10.1182/blood-2008-03-077966. [DOI] [PMC free article] [PubMed] [Google Scholar]
- 8.Bruchova H, Merkerova M, Prchal JT. Aberrant expression of microRNA in polycythemia vera. Haematologica. 2008;93:1009–16. doi: 10.3324/haematol.12706. [DOI] [PubMed] [Google Scholar]
- 9.Schaub FX, Jager R, Looser R, Hao-Shen H, Hermouet S, Girodon F, Tichelli A, Gisslinger H, Kralovics R, Skoda RC. Clonal analysis of deletions on chromosome 20q and JAK2-V617F in MPD suggests that del20q acts independently and is not one of the pre-disposing mutations for JAK2-V617F. Blood. 2008 doi: 10.1182/blood-2008-07-167056. [DOI] [PubMed] [Google Scholar]
- 10.Neildez-Nguyen TM, Wajcman H, Marden MC, Bensidhoum M, Moncollin V, Giarratana MC, Kobari L, Thierry D, Douay L. Human erythroid cells produced ex vivo at large scale differentiate into red blood cells in vivo. Nat Biotechnol. 2002;20:467–72. doi: 10.1038/nbt0502-467. [DOI] [PubMed] [Google Scholar]
- 11.Giarratana MC, Kobari L, Lapillonne H, Chalmers D, Kiger L, Cynober T, Marden MC, Wajcman H, Douay L. Ex vivo generation of fully mature human red blood cells from hematopoietic stem cells. Nat Biotechnol. 2005;23:69–74. doi: 10.1038/nbt1047. [DOI] [PubMed] [Google Scholar]
- 12.Bruchova H, Yoon D, Agarwal AM, Mendell J, Prchal JT. Regulated expression of microRNAs in normal and polycythemia vera erythropoiesis. Exp Hematol. 2007;35:1657–67. doi: 10.1016/j.exphem.2007.08.021. [DOI] [PMC free article] [PubMed] [Google Scholar]
- 13.Wu H, Liu X, Jaenisch R, Lodish HF. Generation of committed erythroid BFU-E and CFU-E progenitors does not require erythropoietin or the erythropoietin receptor. Cell. 1995;83:59–67. doi: 10.1016/0092-8674(95)90234-1. [DOI] [PubMed] [Google Scholar]
- 14.Leonard M, Brice M, Engel JD, Papayannopoulou T. Dynamics of GATA transcription factor expression during erythroid differentiation. Blood. 1993;82:1071–9. [PubMed] [Google Scholar]
- 15.Simon MC. Transcription factor GATA-1 and erythroid development. Proc Soc Exp Biol Med. 1993;202:115–21. doi: 10.3181/00379727-202-43519a. [DOI] [PubMed] [Google Scholar]
- 16.Simon MC, Pevny L, Wiles MV, Keller G, Costantini F, Orkin SH. Rescue of erythroid development in gene targeted GATA-1- mouse embryonic stem cells. Nat Genet. 1992;1:92–8. doi: 10.1038/ng0592-92. [DOI] [PubMed] [Google Scholar]
- 17.Silva M, Benito A, Sanz C, Prosper F, Ekhterae D, Nunez G, Fernandez-Luna JL. Erythropoietin can induce the expression of bcl-x(L) through Stat5 in erythropoietin-dependent progenitor cell lines. J Biol Chem. 1999;274:22165–9. doi: 10.1074/jbc.274.32.22165. [DOI] [PubMed] [Google Scholar]
- 18.Socolovsky M, Fallon AE, Wang S, Brugnara C, Lodish HF. Fetal anemia and apoptosis of red cell progenitors in Stat5a−/−5b−/− mice: a direct role for Stat5 in Bcl-X(L) induction. Cell. 1999;98:181–91. doi: 10.1016/s0092-8674(00)81013-2. [DOI] [PubMed] [Google Scholar]
- 19.Socolovsky M, Nam H-s, Fleming MD, Haase VH, Brugnara C, Lodish HF. Ineffective erythropoiesis in Stat5a−/−5b−/− mice due to decreased survival of early erythroblasts. Blood. 2001;98:3261–3273. doi: 10.1182/blood.v98.12.3261. [DOI] [PubMed] [Google Scholar]
- 20.Sandoval H, Thiagarajan P, Dasgupta SK, Schumacher A, Prchal JT, Chen M, Wang J. Essential role for Nix in autophagic maturation of erythroid cells. Nature. 2008 doi: 10.1038/nature07006. Prepublished online. [DOI] [PMC free article] [PubMed] [Google Scholar]
- 21.Aerbajinai W, Giattina M, Lee YT, Raffeld M, Miller JL. The proapoptotic factor Nix is coexpressed with Bcl-xL during terminal erythroid differentiation. Blood. 2003;102:712–7. doi: 10.1182/blood-2002-11-3324. [DOI] [PubMed] [Google Scholar]
- 22.Lin HH, Sternfeld DC, Shinpock SG, Popp RA, Mucenski ML. Functional analysis of the c-myb proto-oncogene. Curr Top Microbiol Immunol. 1996;211:79–87. doi: 10.1007/978-3-642-85232-9_8. [DOI] [PubMed] [Google Scholar]
- 23.Vegiopoulos A, Garcia P, Emambokus N, Frampton J. Coordination of erythropoiesis by the transcription factor c-Myb. Blood. 2006;107:4703–10. doi: 10.1182/blood-2005-07-2968. [DOI] [PMC free article] [PubMed] [Google Scholar]
- 24.Choong ML, Yang HH, McNiece I. MicroRNA expression profiling during human cord blood-derived CD34 cell erythropoiesis. Exp Hematol. 2007;35:551–64. doi: 10.1016/j.exphem.2006.12.002. [DOI] [PubMed] [Google Scholar]
- 25.Felli N, Fontana L, Pelosi E, Botta R, Bonci D, Facchiano F, Liuzzi F, Lulli V, Morsilli O, Santoro S, Valtieri M, Calin GA, Liu CG, Sorrentino A, Croce CM, Peschle C. MicroRNAs 221 and 222 inhibit normal erythropoiesis and erythroleukemic cell growth via kit receptor down-modulation. Proc Natl Acad Sci U S A. 2005;102:18081–6. doi: 10.1073/pnas.0506216102. [DOI] [PMC free article] [PubMed] [Google Scholar]
- 26.Wang Q, Huang Z, Xue H, Jin C, Ju XL, Han JD, Chen YG. MicroRNA miR-24 inhibits erythropoiesis by targeting activin type I receptor ALK4. Blood. 2008;111:588–95. doi: 10.1182/blood-2007-05-092718. [DOI] [PubMed] [Google Scholar]
- 27.Zhang J, Socolovsky M, Gross AW, Lodish HF. Role of Ras signaling in erythroid differentiation of mouse fetal liver cells: functional analysis by a flow cytometry-based novel culture system. Blood. 2003;102:3938–46. doi: 10.1182/blood-2003-05-1479. [DOI] [PubMed] [Google Scholar]
- 28.Yoon D, Watowich SS. Hematopoietic cell survival signals are elicited through non-tyrosine-containing sequences in the membrane-proximal region of the erythropoietin receptor (EPOR) by a Stat5-dependent pathway. Exp Hematol. 2003;31:1310–6. doi: 10.1016/j.exphem.2003.08.009. [DOI] [PMC free article] [PubMed] [Google Scholar]
- 29.Yoon D, Pastore YD, Divoky V, Liu E, Mlodnicka AE, Rainey K, Ponka P, Semenza GL, Schumacher A, Prchal JT. Hypoxia-inducible factor-1 deficiency results in dysregulated erythropoiesis signaling and iron homeostasis in mouse development. J Biol Chem. 2006;281:25703–11. doi: 10.1074/jbc.M602329200. [DOI] [PubMed] [Google Scholar]
- 30.Gaikwad A, Verstovsek S, Yoon D, Chang KT, Manshouri T, Nussenzveig R, Cortes J, Vainchenker W, Prchal JT. Imatinib effect on growth and signal transduction in polycythemia vera. Exp Hematol. 2007;35:931–8. doi: 10.1016/j.exphem.2007.03.012. [DOI] [PubMed] [Google Scholar]
- 31.Ugo V, Marzac C, Teyssandier I, Larbret F, Lecluse Y, Debili N, Vainchenker W, Casadevall N. Multiple signaling pathways are involved in erythropoietin-independent differentiation of erythroid progenitors in polycythemia vera. Exp Hematol. 2004;32:179–87. doi: 10.1016/j.exphem.2003.11.003. [DOI] [PubMed] [Google Scholar]
- 32.Dupont S, Masse A, James C, Teyssandier I, Lecluse Y, Larbret F, Ugo V, Saulnier P, Koscielny S, Le Couedic JP, Casadevall N, Vainchenker W, Delhommeau F. The JAK2 617V>F mutation triggers erythropoietin hypersensitivity and terminal erythroid amplification in primary cells from patients with polycythemia vera. Blood. 2007;110:1013–21. doi: 10.1182/blood-2006-10-054940. [DOI] [PubMed] [Google Scholar]
- 33.Passamonti F, Vanelli L, Malabarba L, Rumi E, Pungolino E, Malcovati L, Pascutto C, Morra E, Lazzarino M, Cazzola M. Clinical utility of the absolute number of circulating CD34-positive cells in patients with chronic myeloproliferative disorders. Haematologica. 2003;88:1123–9. [PubMed] [Google Scholar]
- 34.Motoyama N, Wang F, Roth KA, Sawa H, Nakayama K, Nakayama K, Negishi I, Senju S, Zhang Q, Fujii S, et al. Massive cell death of immature hematopoietic cells and neurons in Bcl-x-deficient mice. Science. 1995;267:1506–10. doi: 10.1126/science.7878471. [DOI] [PubMed] [Google Scholar]
- 35.le Sage C, Nagel R, Egan DA, Schrier M, Mesman E, Mangiola A, Anile C, Maira G, Mercatelli N, Ciafre SA, Farace MG, Agami R. Regulation of the p27(Kip1) tumor suppressor by miR-221 and miR-222 promotes cancer cell proliferation. Embo J. 2007;26:3699–708. doi: 10.1038/sj.emboj.7601790. [DOI] [PMC free article] [PubMed] [Google Scholar]
- 36.Ogawa M, Matsuzaki Y, Nishikawa S, Hayashi S, Kunisada T, Sudo T, Kina T, Nakauchi H, Nishikawa S. Expression and function of c-kit in hemopoietic progenitor cells. J Exp Med. 1991;174:63–71. doi: 10.1084/jem.174.1.63. [DOI] [PMC free article] [PubMed] [Google Scholar]
- 37.Xiao C, Calado DP, Galler G, Thai TH, Patterson HC, Wang J, Rajewsky N, Bender TP, Rajewsky K. MiR-150 controls B cell differentiation by targeting the transcription factor c-Myb. Cell. 2007;131:146–59. doi: 10.1016/j.cell.2007.07.021. [DOI] [PubMed] [Google Scholar]
- 38.Prchal JT. Polycythemia vera and other primary polycythemias. Curr Opin Hematol. 2005;12:112–6. doi: 10.1097/01.moh.0000154029.05396.d2. [DOI] [PubMed] [Google Scholar]